| Param | Original file | Final file |
|---|---|---|
| Filename | modeM0/AS1A03_052T01_9000001480_10256cztM0_level2.evt | modeM0/AS1A03_052T01_9000001480_10256cztM0_level2_quad_clean.evt |
| Size (bytes) | 552,934,080 | 87,759,360 |
| Size | 527.3 MB | 83.7 MB |
| Events in quadrant A | 3,428,430 | 543,094 |
| Events in quadrant B | 4,140,002 | 545,752 |
| Events in quadrant C | 3,357,590 | 537,365 |
| Events in quadrant D | 5,312,358 | 511,088 |
| Mode SS | |||
|---|---|---|---|
| Quadrant | BADHDUFLAG | Total packets | Discarded packets |
| A | 0 | 154 | 0 |
| B | 0 | 154 | 0 |
| C | 0 | 154 | 0 |
| D | 0 | 154 | 0 |
| Mode M0 | |||
|---|---|---|---|
| Quadrant | BADHDUFLAG | Total packets | Discarded packets |
| A | 0 | 15295 | 18 |
| B | 0 | 17175 | 41 |
| C | 0 | 15243 | 17 |
| D | 0 | 20623 | 30 |
| Mode M9 | |||
|---|---|---|---|
| Quadrant | BADHDUFLAG | Total packets | Discarded packets |
| A | 0 | 15 | 0 |
| B | 0 | 15 | 0 |
| C | 0 | 15 | 0 |
| D | 0 | 15 | 0 |
| Quadrant | Total seconds | Saturated seconds | Saturation percentage |
|---|---|---|---|
| A | 7477 | 47 | 0.628594% |
| B | 7468 | 121 | 1.620246% |
| C | 7477 | 28 | 0.374482% |
| D | 7476 | 314 | 4.200107% |
Noise dominated data is calculated using 1-second bins in cleaned event files. If a bin has >2000 counts, and if more than 50% of those come from <1% of pixels, then it is considered to be noise-dominated and hence unusable.
| Quadrant | # 1 sec bins | Bins with >0 counts | Bins with >2000 counts | High rate bins dominated by noise | Noise dominated (total time) | Noise dominated (detector-on time) | Marked lightcurve |
|---|---|---|---|---|---|---|---|
| A | 9021 | 7486 | 5 | 5 | 0.06% | 0.07% | 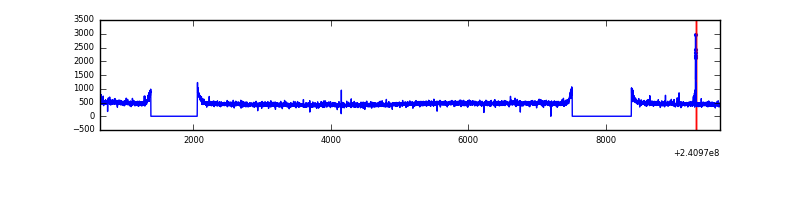 |
| B | 9021 | 7486 | 46 | 46 | 0.51% | 0.61% | 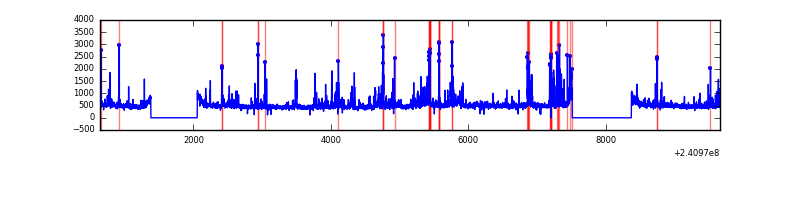 |
| C | 9021 | 7487 | 1 | 1 | 0.01% | 0.01% | 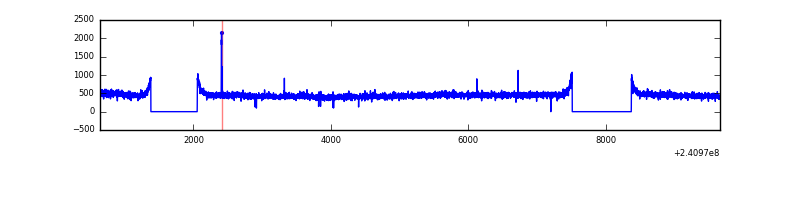 |
| D | 9021 | 7487 | 275 | 275 | 3.05% | 3.67% |  |
Top three noisy pixels from each quadrant. If the there are fewer than three noisy pixels in the level2.evt file, extra rows are filled as -1
| Pixel properties | Quadrant properties | ||||||
|---|---|---|---|---|---|---|---|
| Quadrant | DetID | PixID | Counts | Sigma | Mean | Median | Sigma |
| A | 15 | 174 | 22115 | 118.5 | 879 | 859 | 179.4 |
| A | 8 | 15 | 17257 | 91.42 | 879 | 859 | 179.4 |
| A | 0 | 226 | 8097 | 40.35 | 879 | 859 | 179.4 |
| B | 10 | 245 | 390311 | 2275.78 | 882 | 859 | 171.1 |
| B | 4 | 239 | 199568 | 1161.17 | 882 | 859 | 171.1 |
| B | 4 | 81 | 43531 | 249.36 | 882 | 859 | 171.1 |
| C | 14 | 67 | 30028 | 147.0 | 850 | 855 | 198.4 |
| C | 14 | 234 | 14072 | 66.6 | 850 | 855 | 198.4 |
| C | 13 | 61 | 6504 | 28.47 | 850 | 855 | 198.4 |
| D | 1 | 52 | 958406 | 4800.12 | 828 | 804 | 199.5 |
| D | 8 | 195 | 604054 | 3023.88 | 828 | 804 | 199.5 |
| D | 13 | 105 | 159759 | 796.78 | 828 | 804 | 199.5 |
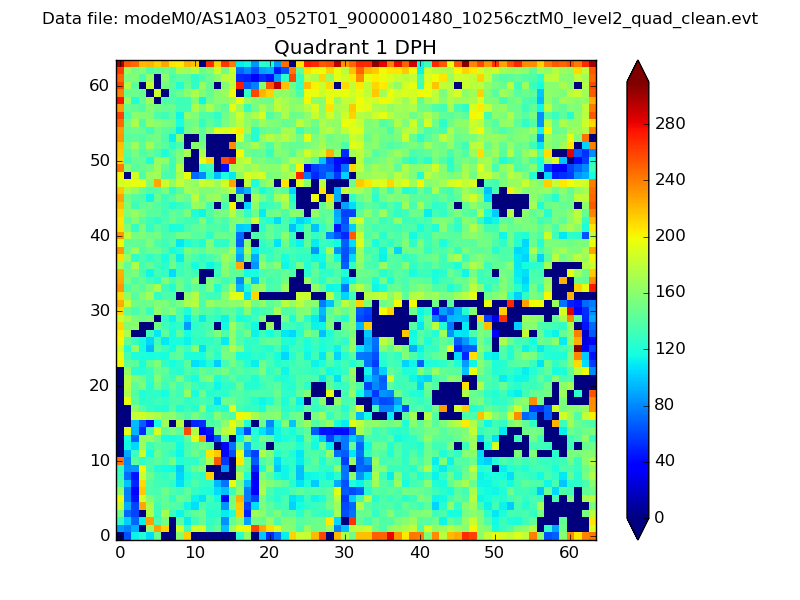
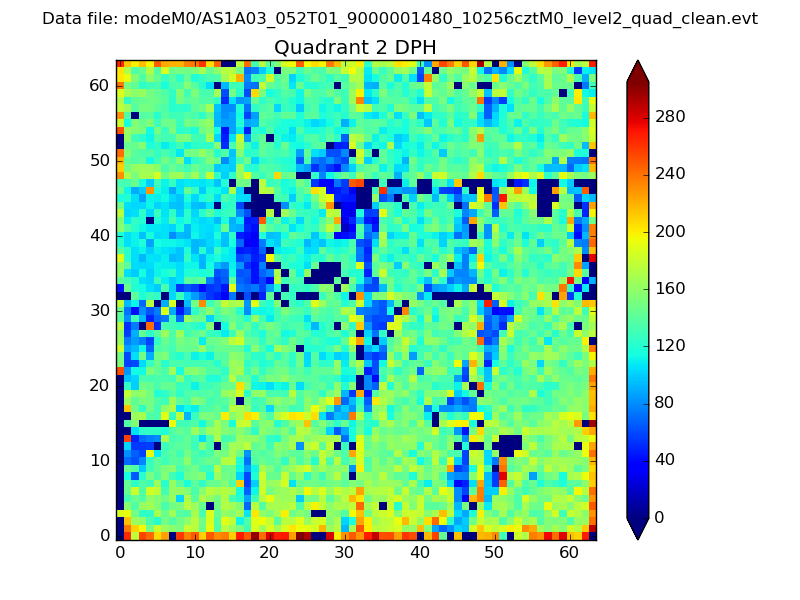
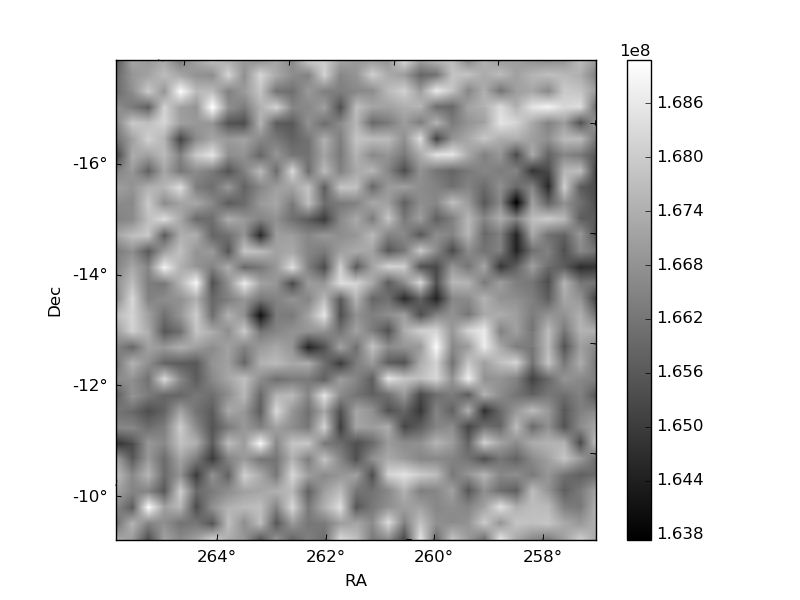
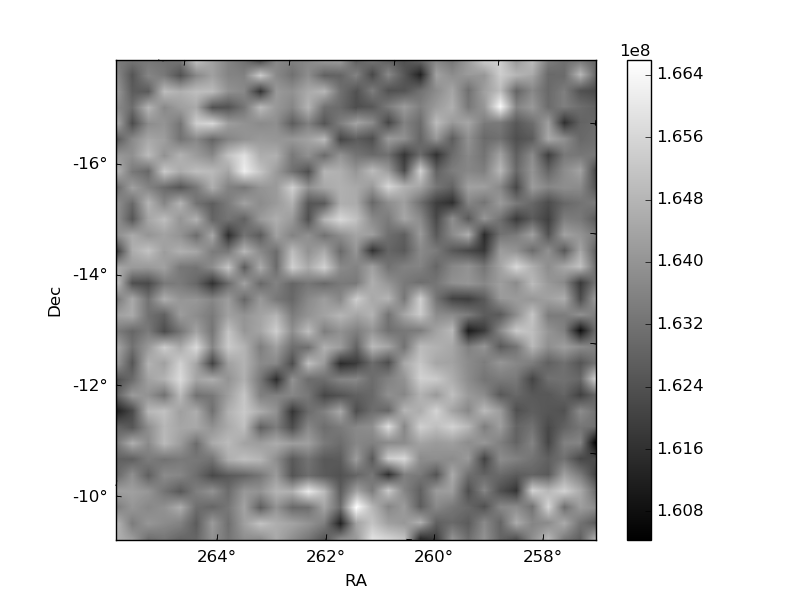
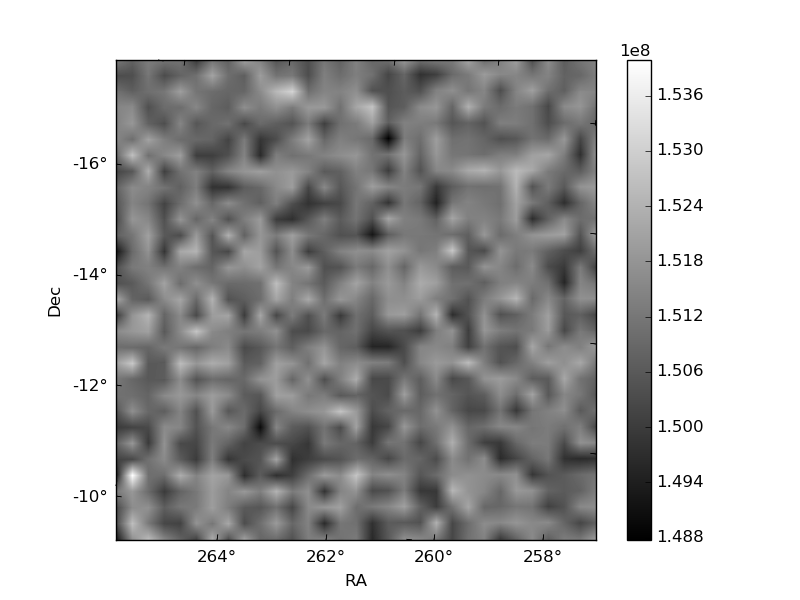
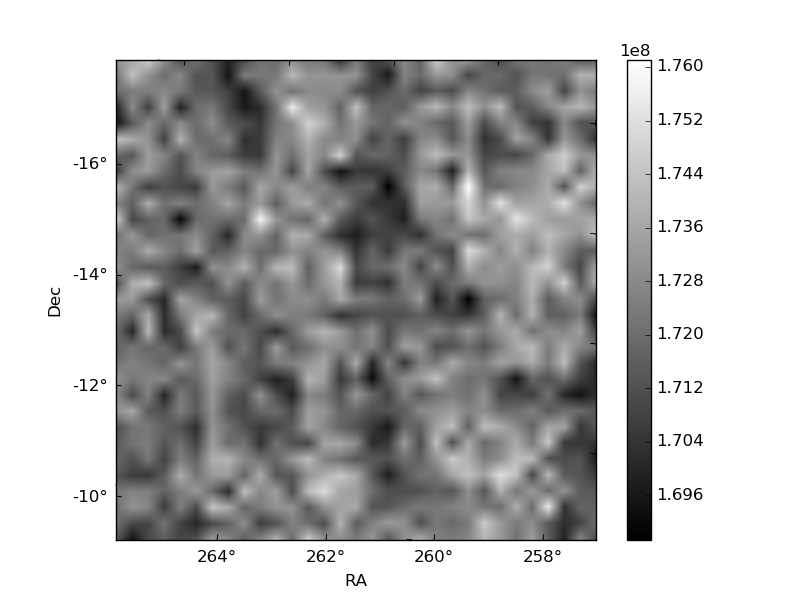
Histogram calculated using DETX and DETY for each event in the final _common_clean file
| Quadrant A | 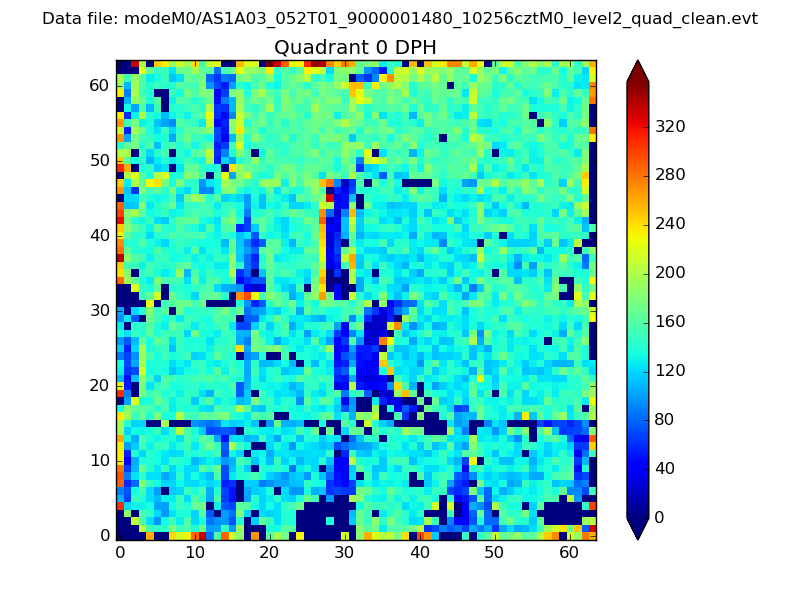 |
 |
Quadrant B |
|---|---|---|---|
| Quadrant D |  |
 |
Quadrant C |
| Plot type | Count rate plots | Images |
|---|---|---|
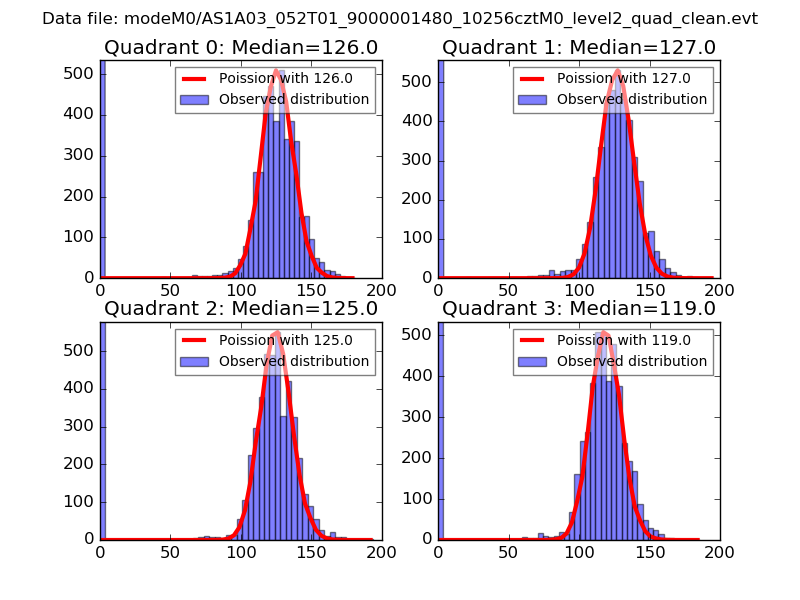
| Comparison with Poisson distribution Blue bars denote a histogram of data divided into 1 sec bins. Red curve is a Poisson curve with rate = median count rate of data. |
 |
 |
| Quadrant-wise count rates Data is divided into 100 sec bins |
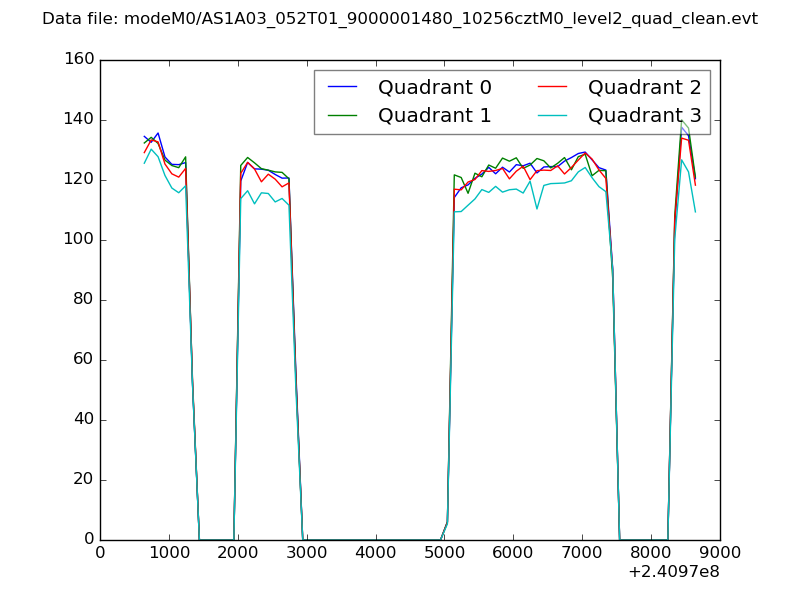 |
|
| Module-wise count rates for Quadrant A Data is divided into 100 sec bins |
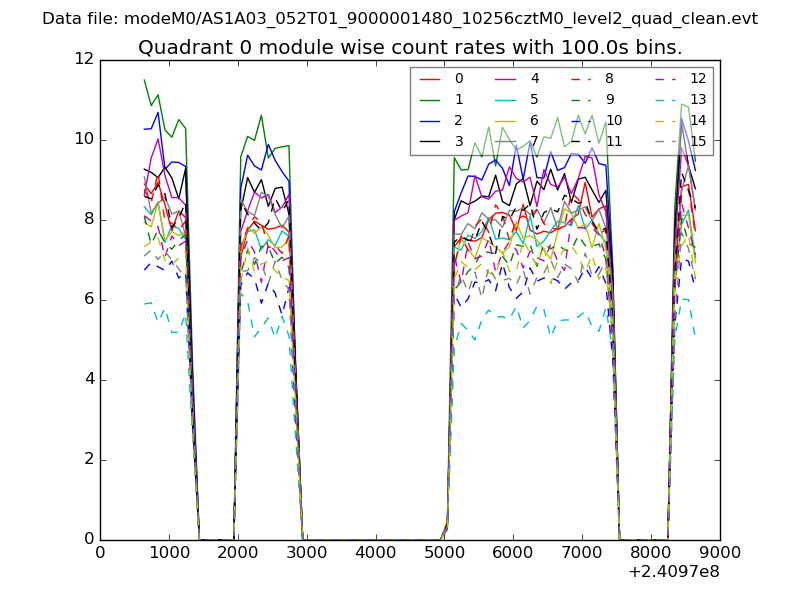 |
 |
| Module-wise count rates for Quadrant B Data is divided into 100 sec bins |
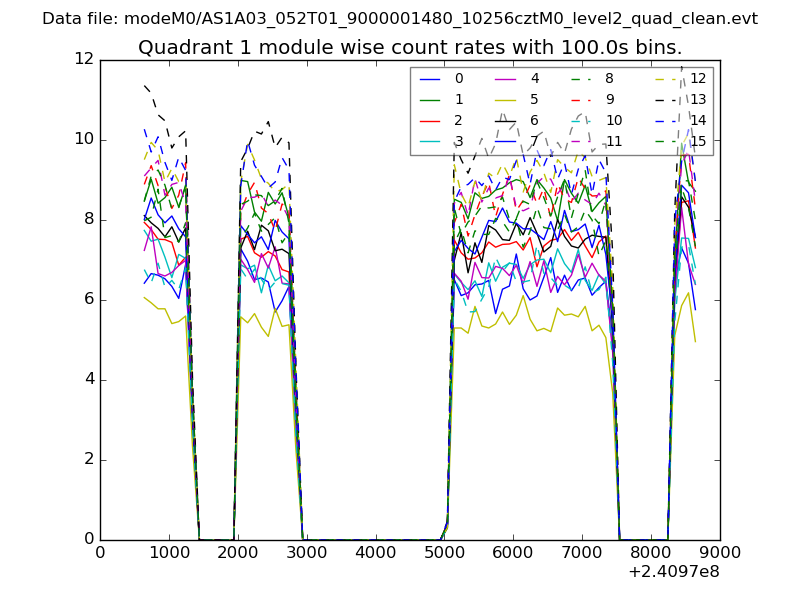 |
 |
| Module-wise count rates for Quadrant C Data is divided into 100 sec bins |
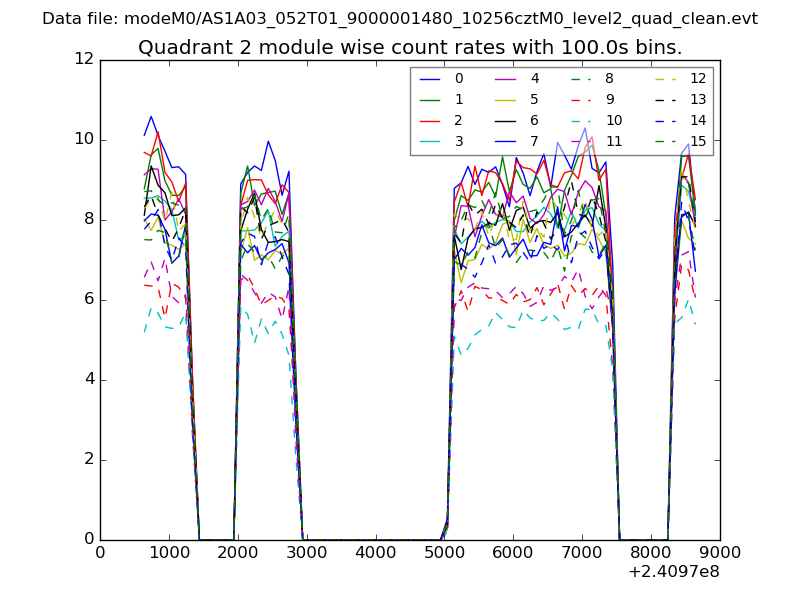 |
 |
| Module-wise count rates for Quadrant D Data is divided into 100 sec bins |
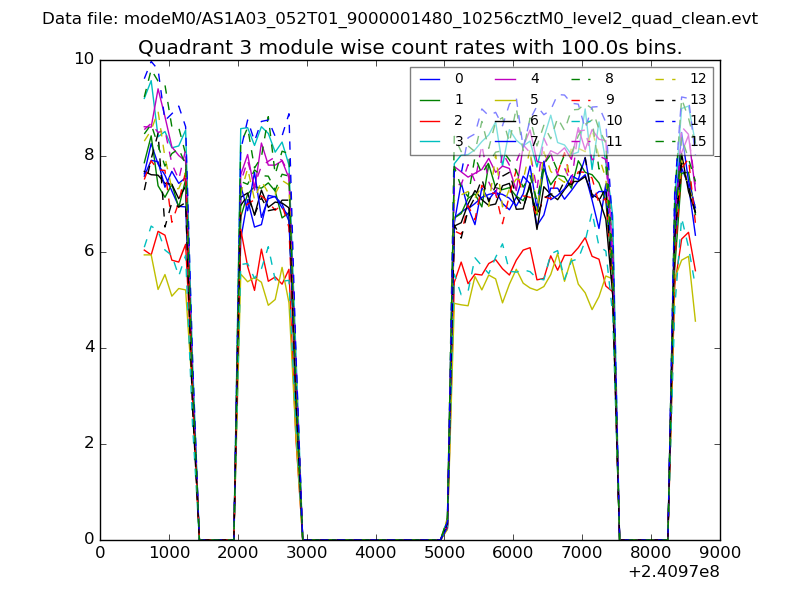 |
 |
| Parameter | Plot |
|---|---|
| CZT HV Monitor | 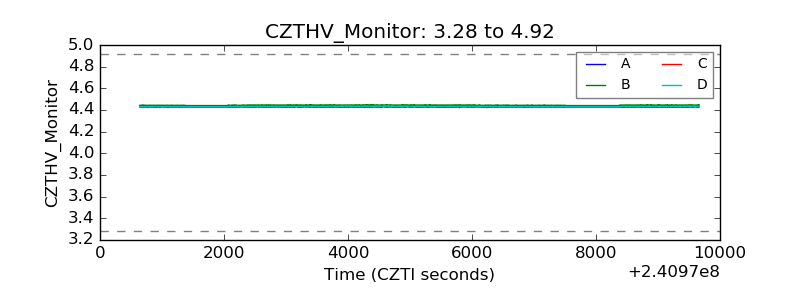 |
| D_VDD | 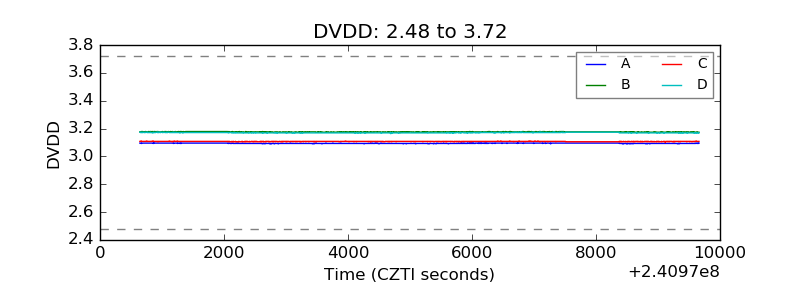 |
| Temperature 1 |  |
| Veto HV Monitor | 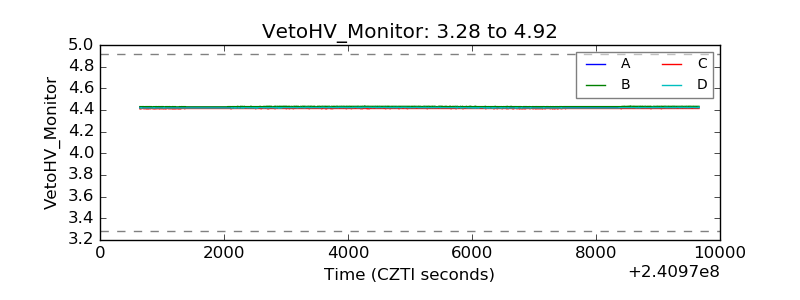 |
| Veto LLD | 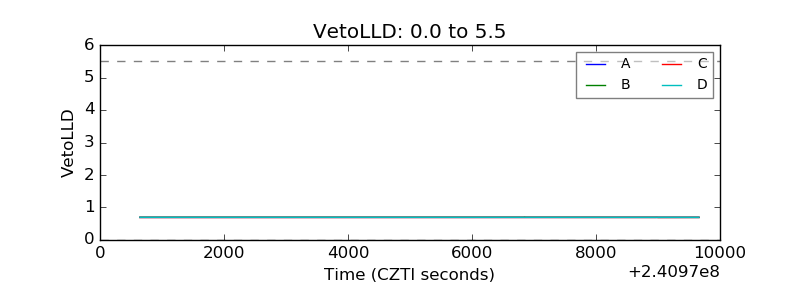 |
| Alpha Counter | 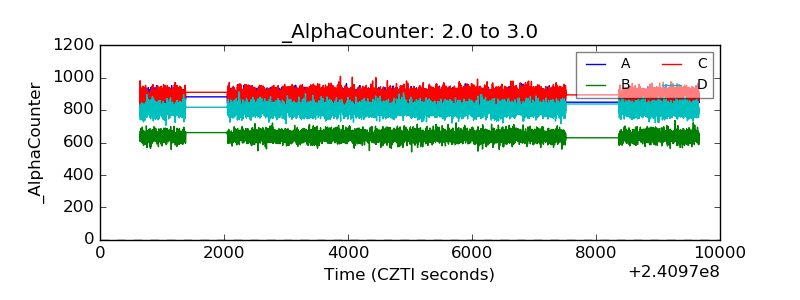 |
| _CPM_Rate | 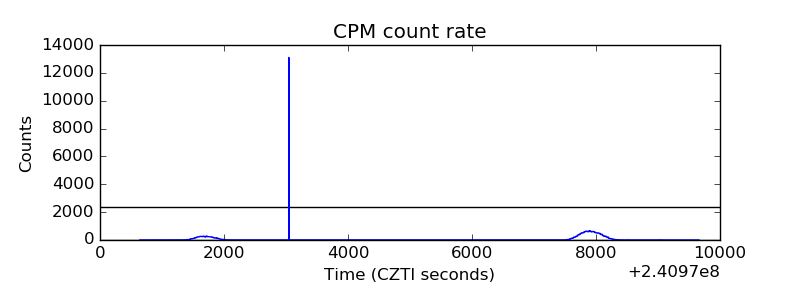 |
| CZT Counter | 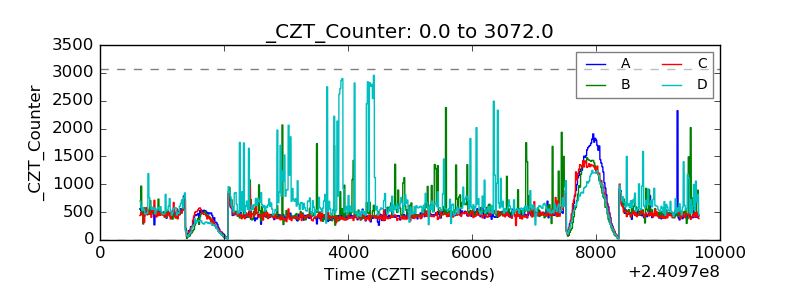 |
| +2.5 Volts monitor |  |
| +5 Volts monitor |  |
| _ROLL_ROT | 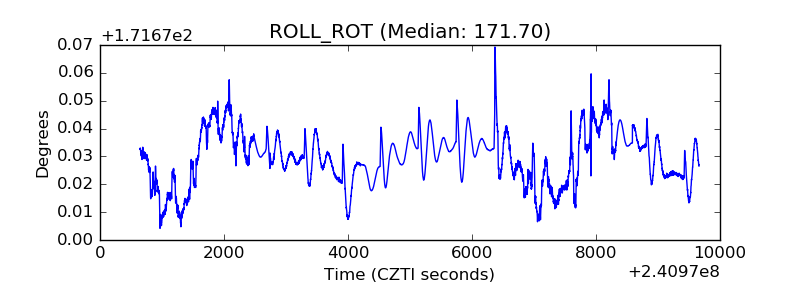 |
| _Roll_DEC | 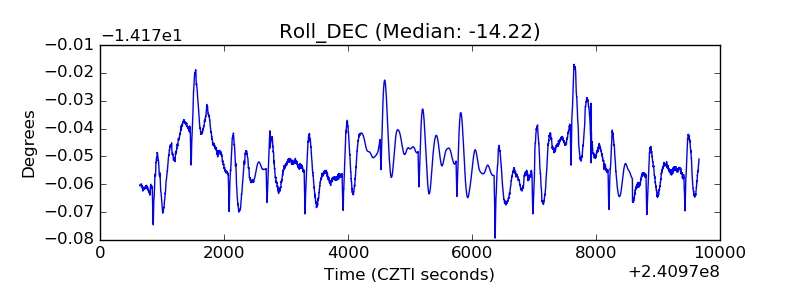 |
| _Roll_RA | 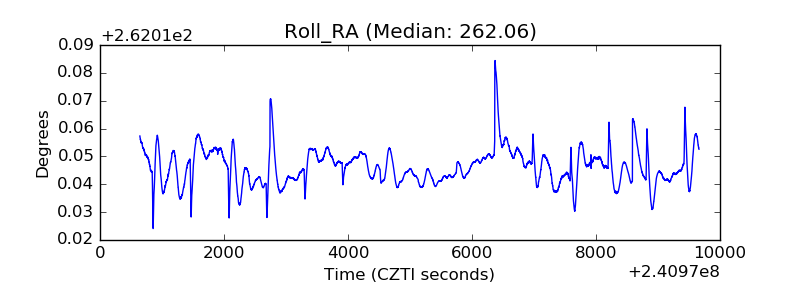 |
| Veto Counter | 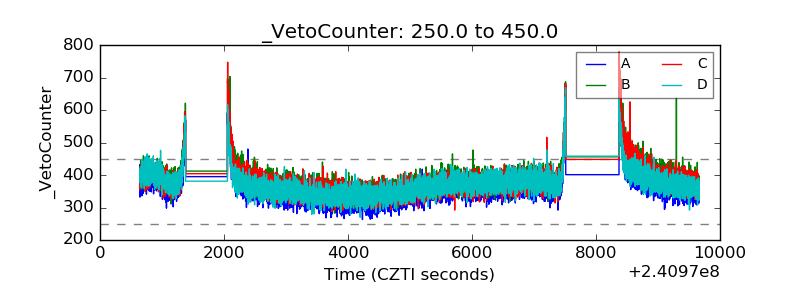 |