| Param | Original file | Final file |
|---|---|---|
| Filename | modeM0/AS1A03_052T01_9000001480_10257cztM0_level2.evt | modeM0/AS1A03_052T01_9000001480_10257cztM0_level2_quad_clean.evt |
| Size (bytes) | 475,773,120 | 65,701,440 |
| Size | 453.7 MB | 62.7 MB |
| Events in quadrant A | 3,169,929 | 386,665 |
| Events in quadrant B | 3,488,809 | 387,368 |
| Events in quadrant C | 3,043,018 | 382,441 |
| Events in quadrant D | 4,247,961 | 361,804 |
| Mode SS | |||
|---|---|---|---|
| Quadrant | BADHDUFLAG | Total packets | Discarded packets |
| A | 0 | 148 | 6 |
| B | 0 | 148 | 7 |
| C | 0 | 148 | 6 |
| D | 0 | 149 | 8 |
| Mode M0 | |||
|---|---|---|---|
| Quadrant | BADHDUFLAG | Total packets | Discarded packets |
| A | 0 | 14673 | 788 |
| B | 0 | 15555 | 868 |
| C | 0 | 14615 | 842 |
| D | 0 | 17940 | 729 |
| Mode M9 | |||
|---|---|---|---|
| Quadrant | BADHDUFLAG | Total packets | Discarded packets |
| A | 0 | 18 | 0 |
| B | 0 | 18 | 0 |
| C | 0 | 18 | 0 |
| D | 0 | 18 | 0 |
| Quadrant | Total seconds | Saturated seconds | Saturation percentage |
|---|---|---|---|
| A | 6740 | 69 | 1.023739% |
| B | 6731 | 98 | 1.455950% |
| C | 6742 | 42 | 0.622961% |
| D | 6786 | 143 | 2.107280% |
Noise dominated data is calculated using 1-second bins in cleaned event files. If a bin has >2000 counts, and if more than 50% of those come from <1% of pixels, then it is considered to be noise-dominated and hence unusable.
| Quadrant | # 1 sec bins | Bins with >0 counts | Bins with >2000 counts | High rate bins dominated by noise | Noise dominated (total time) | Noise dominated (detector-on time) | Marked lightcurve |
|---|---|---|---|---|---|---|---|
| A | 8667 | 6791 | 5 | 5 | 0.06% | 0.07% | 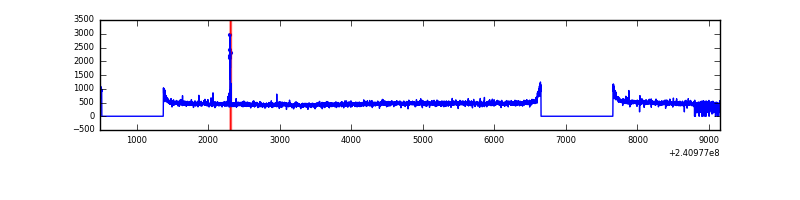 |
| B | 8667 | 6791 | 23 | 23 | 0.27% | 0.34% | 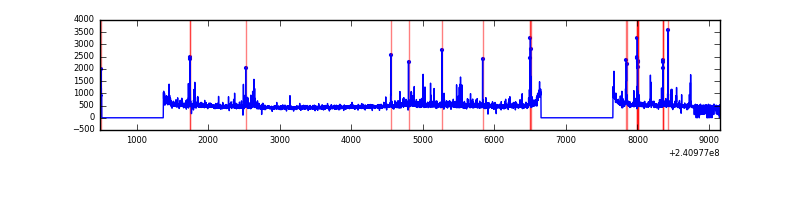 |
| C | 8667 | 6795 | 0 | 0 | 0.00% | 0.00% | 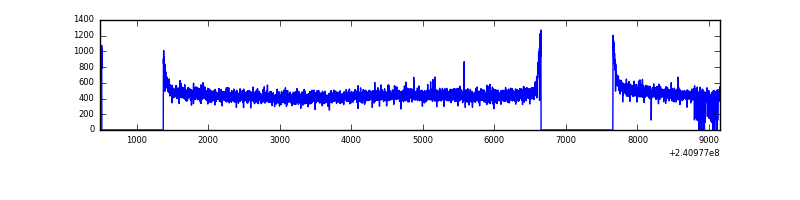 |
| D | 8667 | 6804 | 82 | 82 | 0.95% | 1.21% | 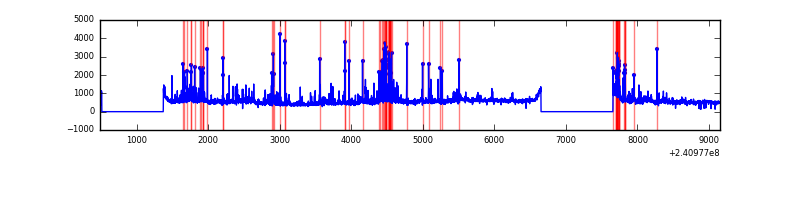 |
Top three noisy pixels from each quadrant. If the there are fewer than three noisy pixels in the level2.evt file, extra rows are filled as -1
| Pixel properties | Quadrant properties | ||||||
|---|---|---|---|---|---|---|---|
| Quadrant | DetID | PixID | Counts | Sigma | Mean | Median | Sigma |
| A | 8 | 15 | 40494 | 240.71 | 807 | 789 | 164.9 |
| A | 15 | 174 | 22024 | 128.74 | 807 | 789 | 164.9 |
| A | 0 | 226 | 7341 | 39.72 | 807 | 789 | 164.9 |
| B | 0 | 214 | 91662 | 582.04 | 808 | 788 | 156.1 |
| B | 4 | 239 | 88614 | 562.52 | 808 | 788 | 156.1 |
| B | 10 | 247 | 52461 | 330.96 | 808 | 788 | 156.1 |
| C | 13 | 61 | 5772 | 27.5 | 779 | 782 | 181.4 |
| C | 12 | 4 | 2503 | 9.48 | 779 | 782 | 181.4 |
| C | 14 | 67 | 2161 | 7.6 | 779 | 782 | 181.4 |
| D | 8 | 195 | 529767 | 2836.97 | 772 | 750 | 186.5 |
| D | 1 | 52 | 291762 | 1560.62 | 772 | 750 | 186.5 |
| D | 10 | 172 | 238310 | 1273.97 | 772 | 750 | 186.5 |
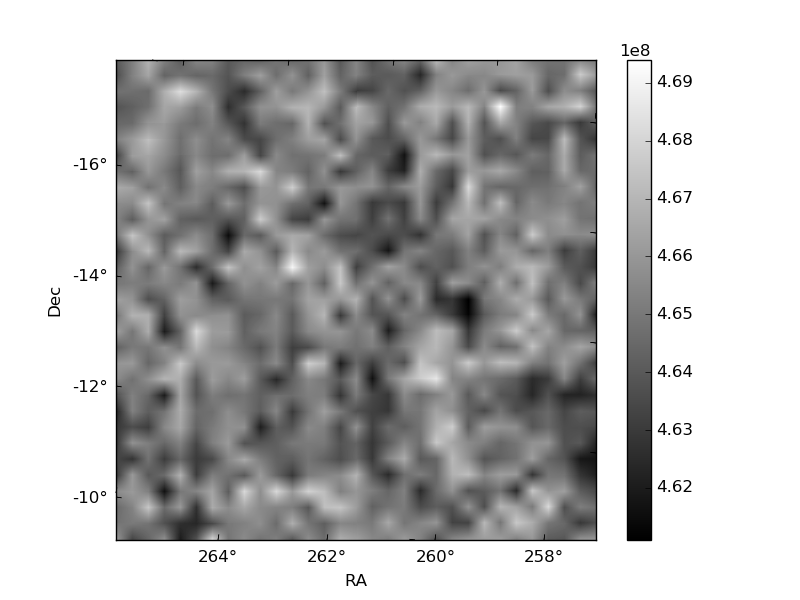
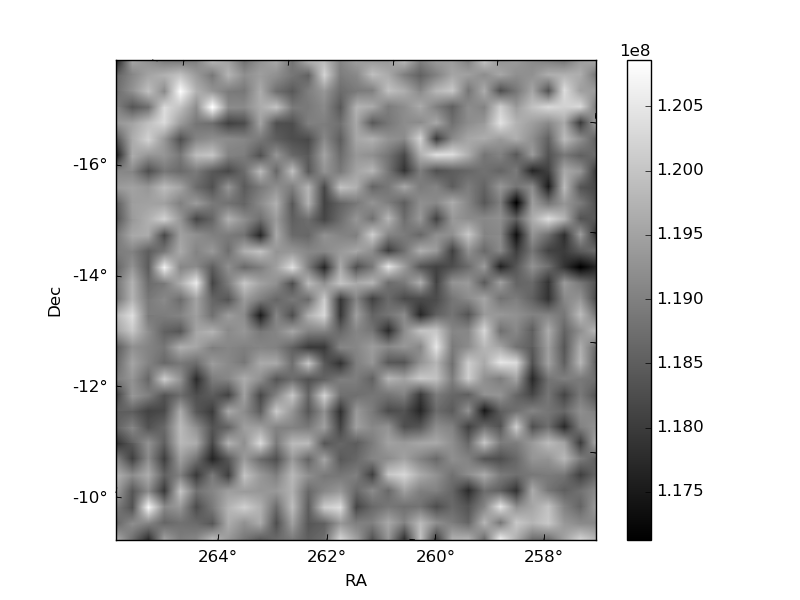
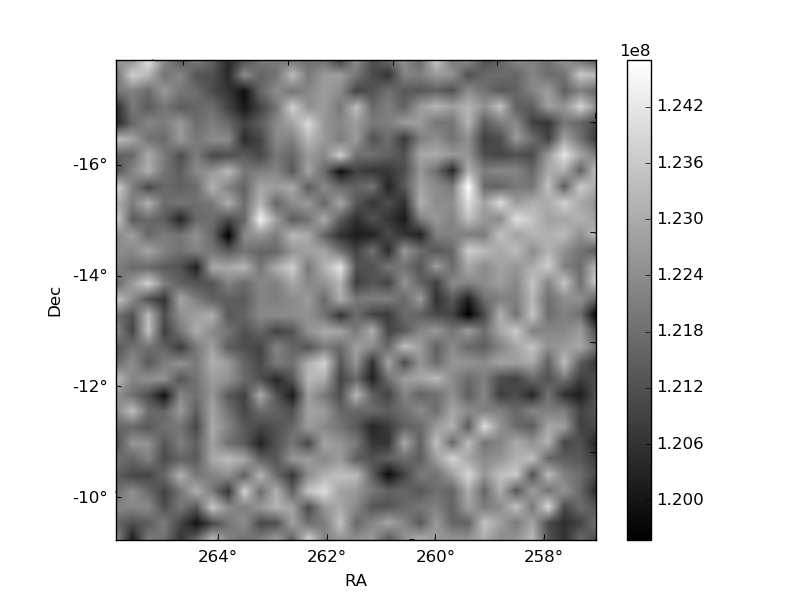
Histogram calculated using DETX and DETY for each event in the final _common_clean file
| Quadrant A | 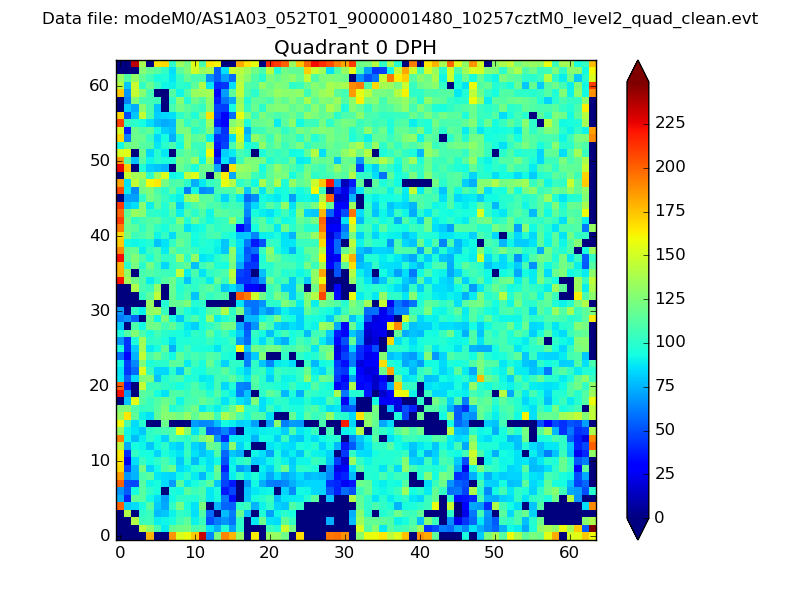 |
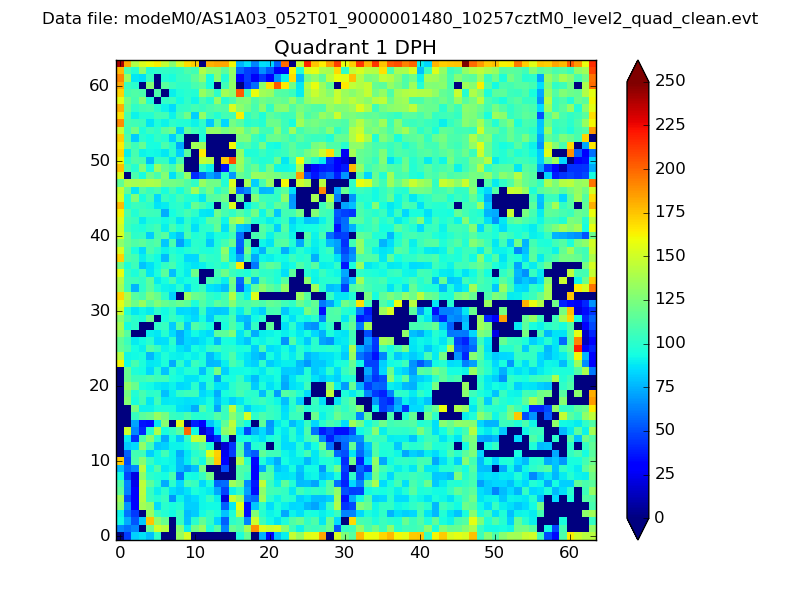 |
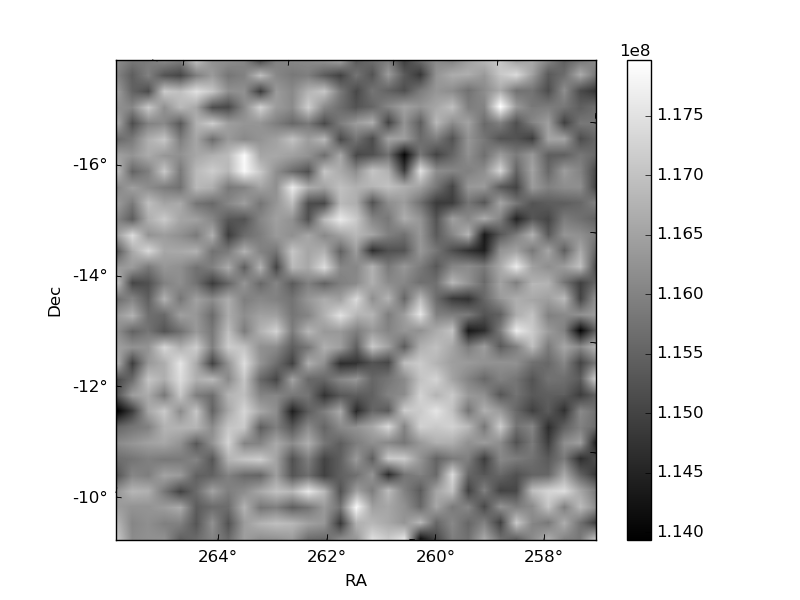
Quadrant B |
|---|---|---|---|
| Quadrant D | 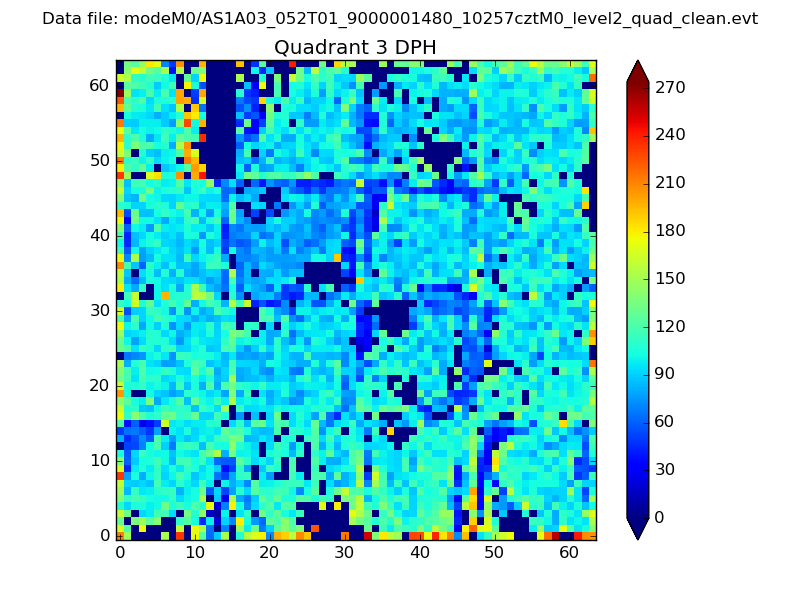 |
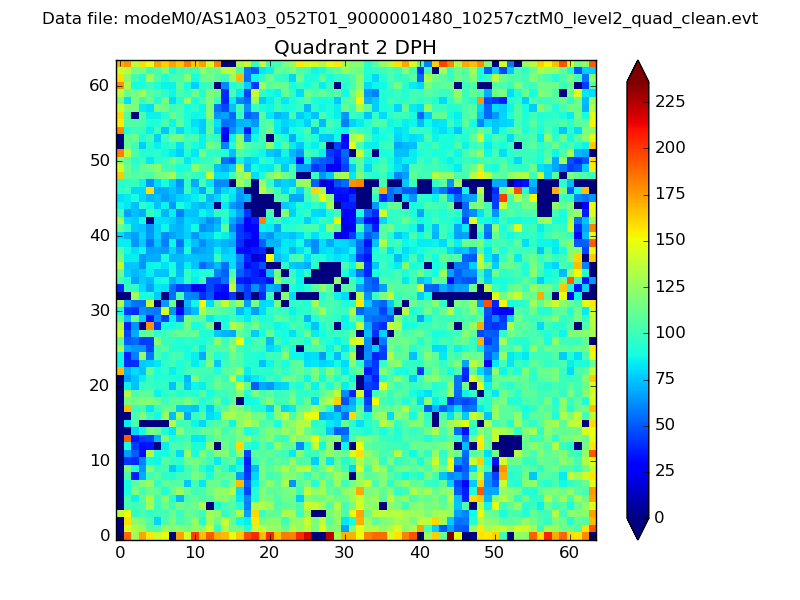 |
Quadrant C |
| Plot type | Count rate plots | Images |
|---|---|---|
| Comparison with Poisson distribution Blue bars denote a histogram of data divided into 1 sec bins. Red curve is a Poisson curve with rate = median count rate of data. |
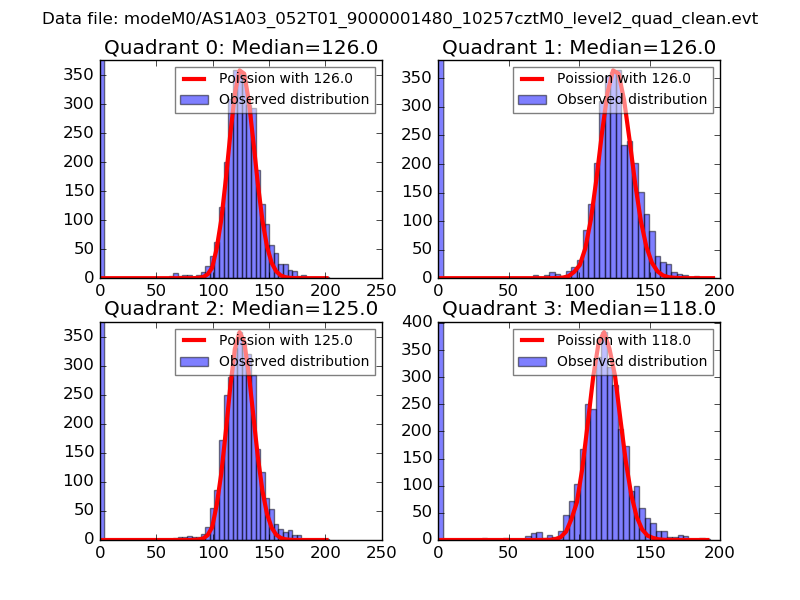 |
 |
| Quadrant-wise count rates Data is divided into 100 sec bins |
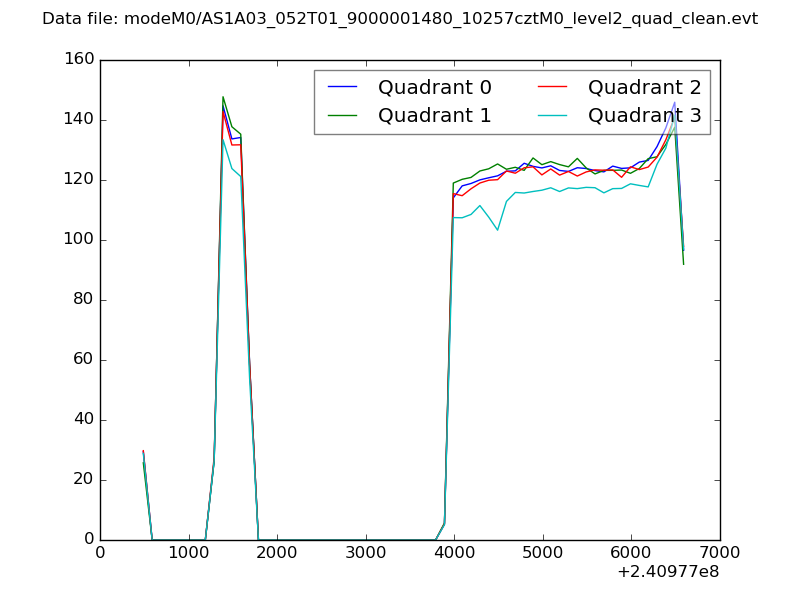 |
|
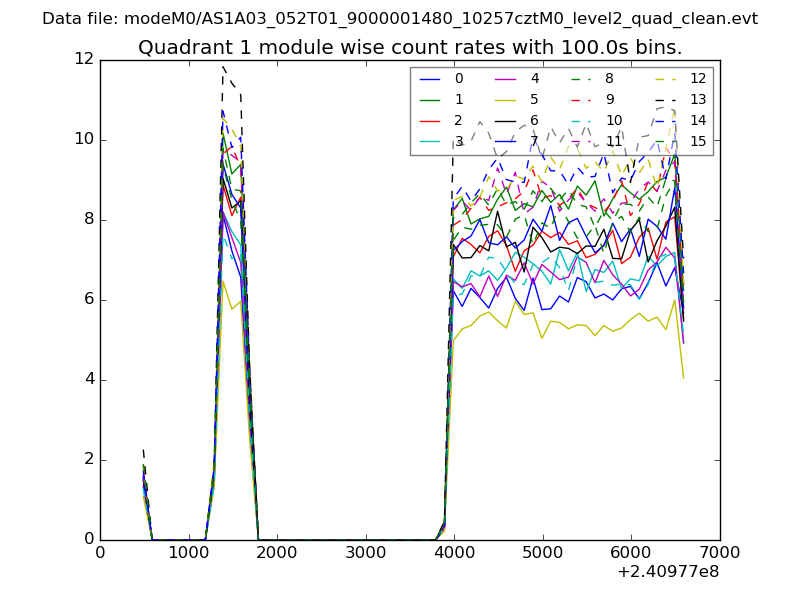
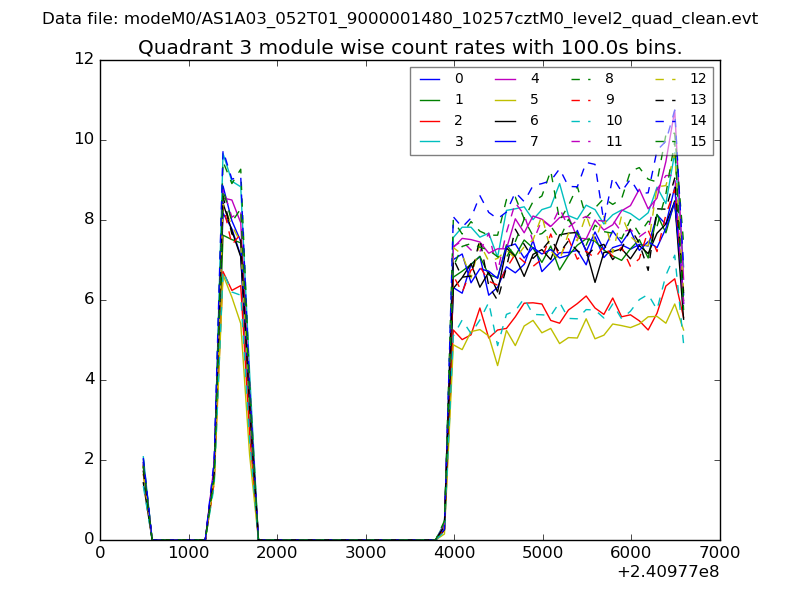
| Module-wise count rates for Quadrant A Data is divided into 100 sec bins |
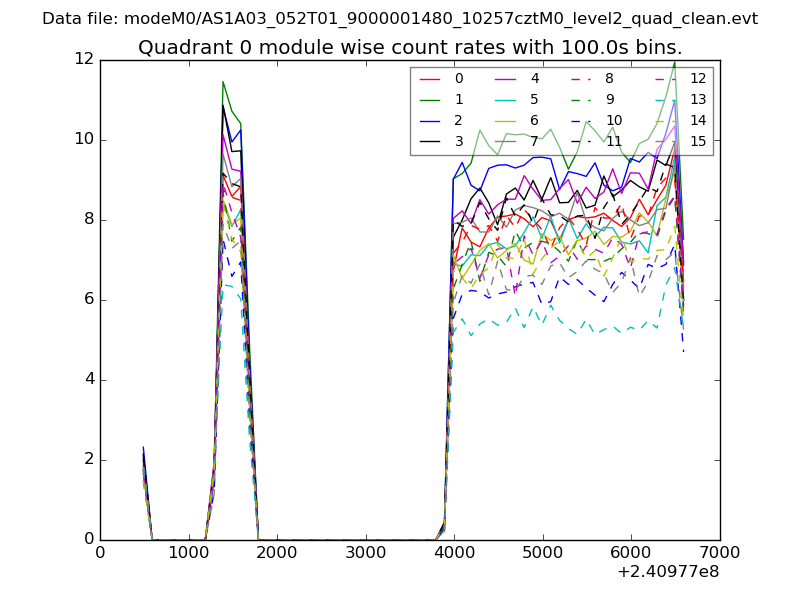 |
 |
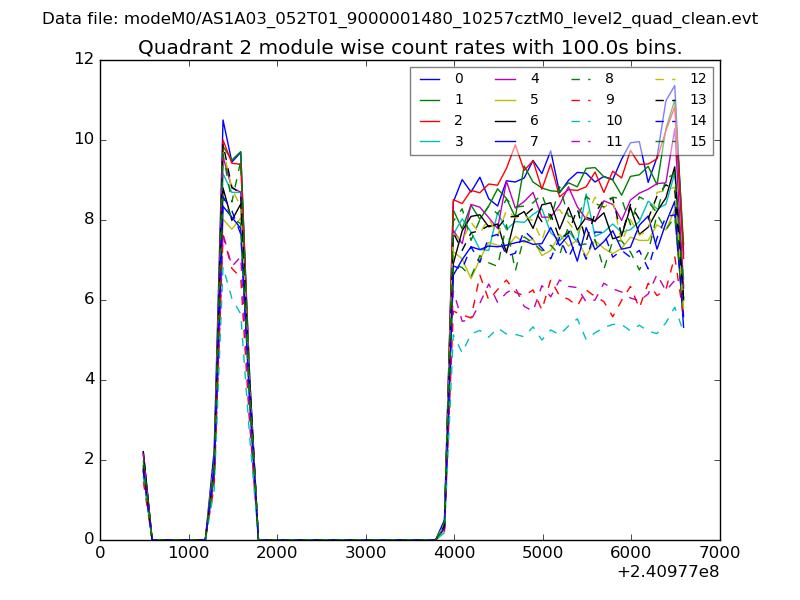
| Module-wise count rates for Quadrant B Data is divided into 100 sec bins |
 |
 |
| Module-wise count rates for Quadrant C Data is divided into 100 sec bins |
 |
 |
| Module-wise count rates for Quadrant D Data is divided into 100 sec bins |
 |
 |
| Parameter | Plot |
|---|---|
| CZT HV Monitor | 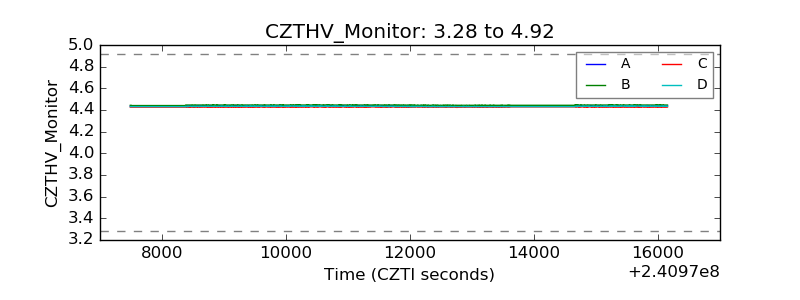 |
| D_VDD |  |
| Temperature 1 | 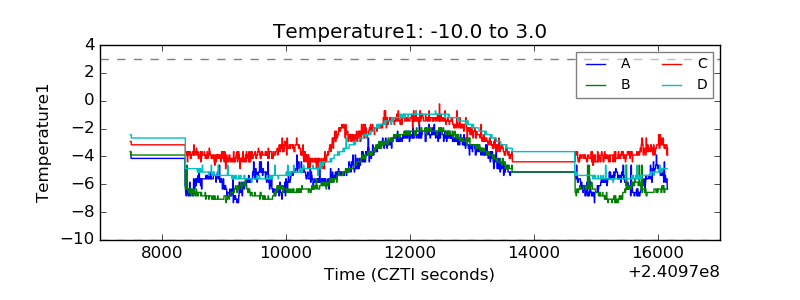 |
| Veto HV Monitor | 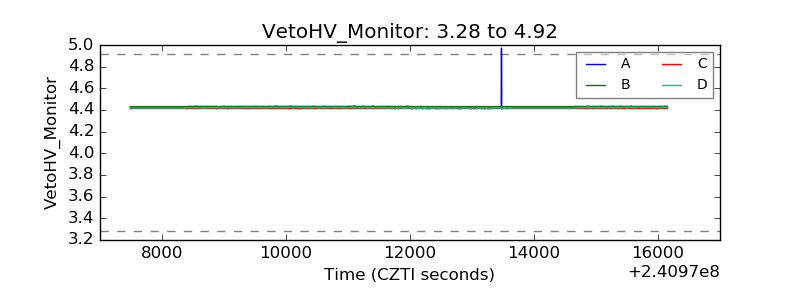 |
| Veto LLD | 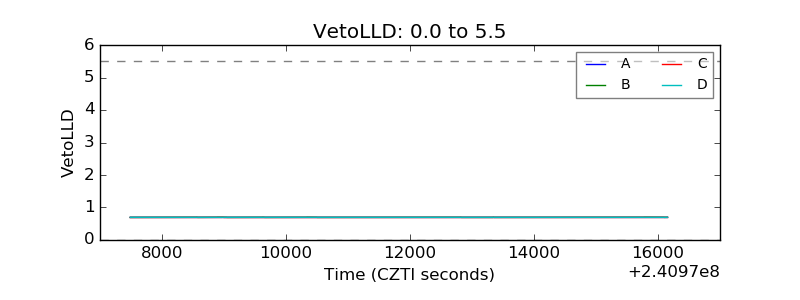 |
| Alpha Counter | 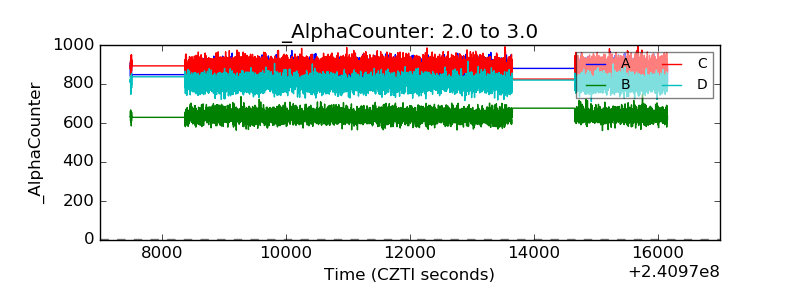 |
| _CPM_Rate | 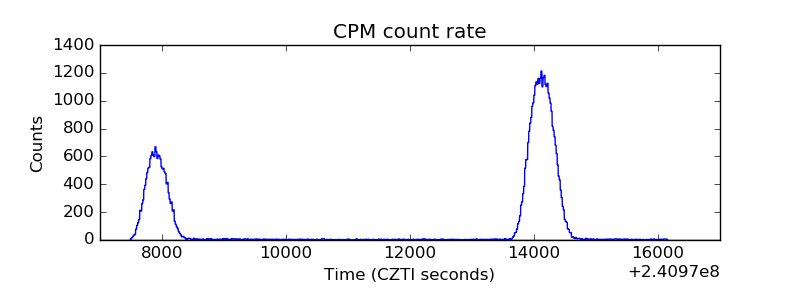 |
| CZT Counter | 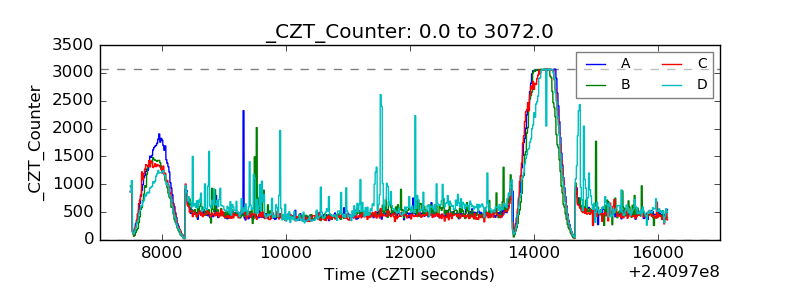 |
| +2.5 Volts monitor | 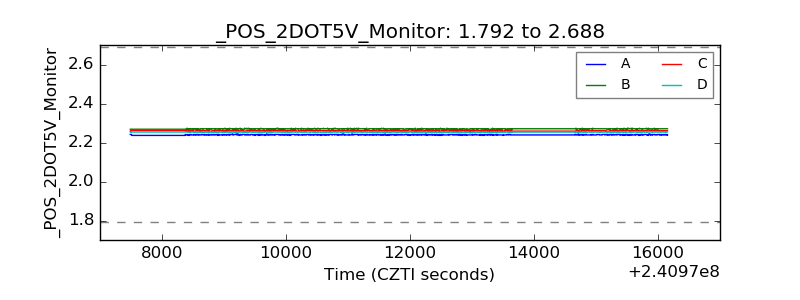 |
| +5 Volts monitor |  |
| _ROLL_ROT | 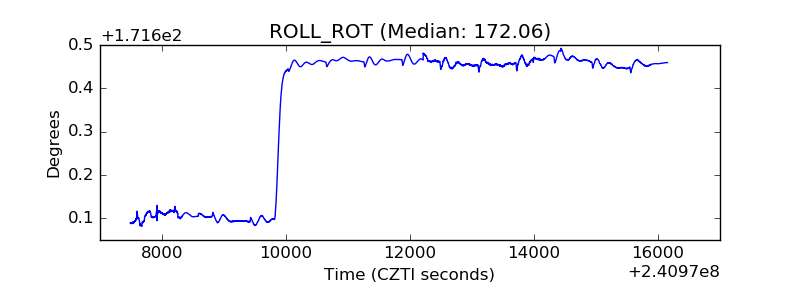 |
| _Roll_DEC | 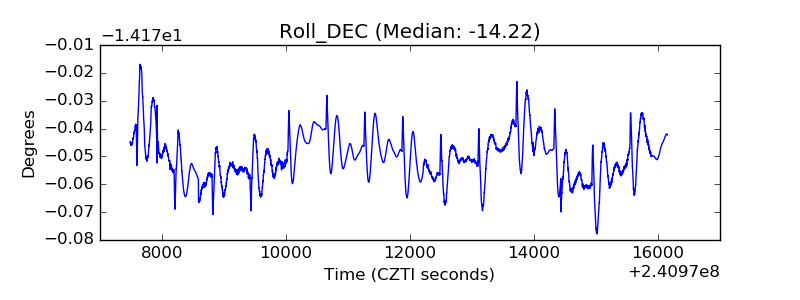 |
| _Roll_RA | 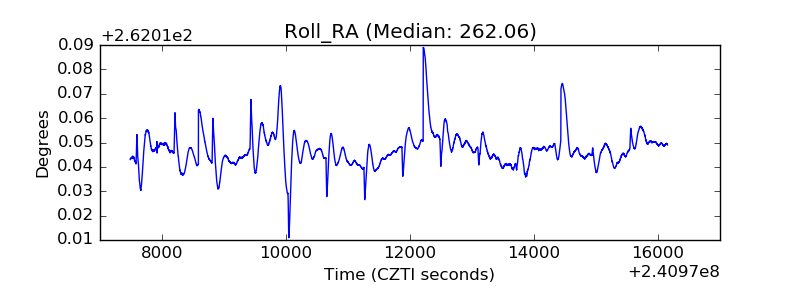 |
| Veto Counter | 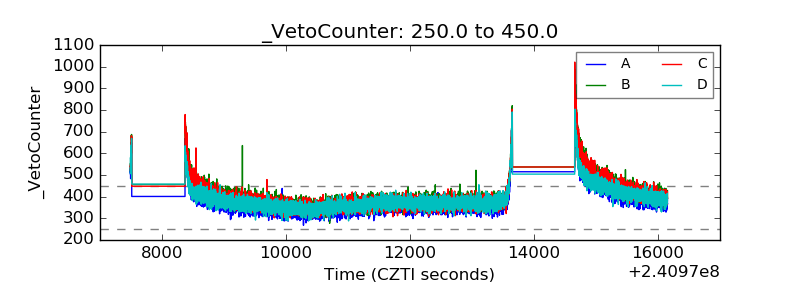 |