| Param | Original file | Final file |
|---|---|---|
| Filename | modeM0/AS1A03_052T01_9000001480_10259cztM0_level2.evt | modeM0/AS1A03_052T01_9000001480_10259cztM0_level2_quad_clean.evt |
| Size (bytes) | 489,574,080 | 63,236,160 |
| Size | 466.9 MB | 60.3 MB |
| Events in quadrant A | 3,204,563 | 373,448 |
| Events in quadrant B | 4,010,170 | 374,301 |
| Events in quadrant C | 3,035,643 | 367,844 |
| Events in quadrant D | 4,136,016 | 346,353 |
| Mode SS | |||
|---|---|---|---|
| Quadrant | BADHDUFLAG | Total packets | Discarded packets |
| A | 0 | 132 | 0 |
| B | 0 | 132 | 0 |
| C | 0 | 132 | 0 |
| D | 0 | 132 | 0 |
| Mode M0 | |||
|---|---|---|---|
| Quadrant | BADHDUFLAG | Total packets | Discarded packets |
| A | 0 | 13495 | 3 |
| B | 0 | 16048 | 2 |
| C | 0 | 13359 | 2 |
| D | 0 | 16460 | 2 |
| Mode M9 | |||
|---|---|---|---|
| Quadrant | BADHDUFLAG | Total packets | Discarded packets |
| A | 0 | 15 | 0 |
| B | 0 | 15 | 0 |
| C | 0 | 15 | 0 |
| D | 0 | 16 | 0 |
| Quadrant | Total seconds | Saturated seconds | Saturation percentage |
|---|---|---|---|
| A | 6488 | 53 | 0.816893% |
| B | 6488 | 245 | 3.776202% |
| C | 6488 | 41 | 0.631936% |
| D | 6488 | 131 | 2.019112% |
Noise dominated data is calculated using 1-second bins in cleaned event files. If a bin has >2000 counts, and if more than 50% of those come from <1% of pixels, then it is considered to be noise-dominated and hence unusable.
| Quadrant | # 1 sec bins | Bins with >0 counts | Bins with >2000 counts | High rate bins dominated by noise | Noise dominated (total time) | Noise dominated (detector-on time) | Marked lightcurve |
|---|---|---|---|---|---|---|---|
| A | 7643 | 6488 | 0 | 0 | 0.00% | 0.00% | 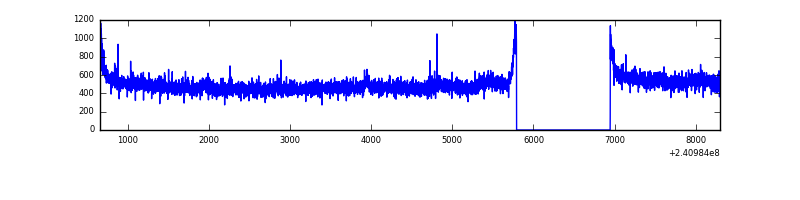 |
| B | 7643 | 6488 | 120 | 120 | 1.57% | 1.85% | 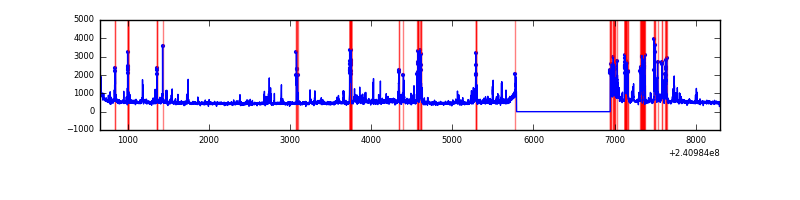 |
| C | 7643 | 6489 | 0 | 0 | 0.00% | 0.00% |  |
| D | 7643 | 6488 | 73 | 73 | 0.96% | 1.13% | 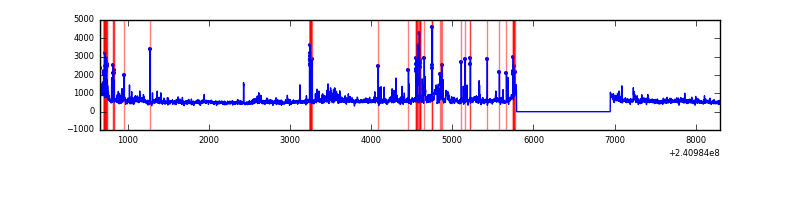 |
Top three noisy pixels from each quadrant. If the there are fewer than three noisy pixels in the level2.evt file, extra rows are filled as -1
| Pixel properties | Quadrant properties | ||||||
|---|---|---|---|---|---|---|---|
| Quadrant | DetID | PixID | Counts | Sigma | Mean | Median | Sigma |
| A | 8 | 15 | 95649 | 584.16 | 804 | 789 | 162.4 |
| A | 13 | 253 | 7830 | 43.36 | 804 | 789 | 162.4 |
| A | 0 | 226 | 7436 | 40.93 | 804 | 789 | 162.4 |
| B | 10 | 247 | 607022 | 3990.76 | 799 | 782 | 151.9 |
| B | 4 | 239 | 159267 | 1043.28 | 799 | 782 | 151.9 |
| B | 0 | 214 | 66105 | 430.01 | 799 | 782 | 151.9 |
| C | 13 | 61 | 5822 | 28.04 | 777 | 784 | 179.7 |
| C | 14 | 67 | 3363 | 14.35 | 777 | 784 | 179.7 |
| C | 14 | 234 | 2840 | 11.44 | 777 | 784 | 179.7 |
| D | 8 | 195 | 523798 | 2619.64 | 757 | 744 | 199.7 |
| D | 1 | 52 | 288253 | 1439.95 | 757 | 744 | 199.7 |
| D | 10 | 172 | 118652 | 590.53 | 757 | 744 | 199.7 |
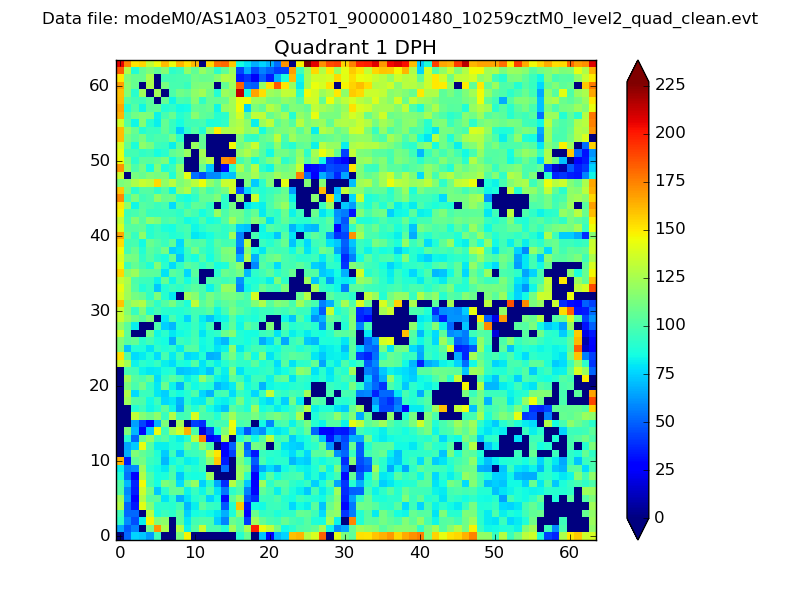
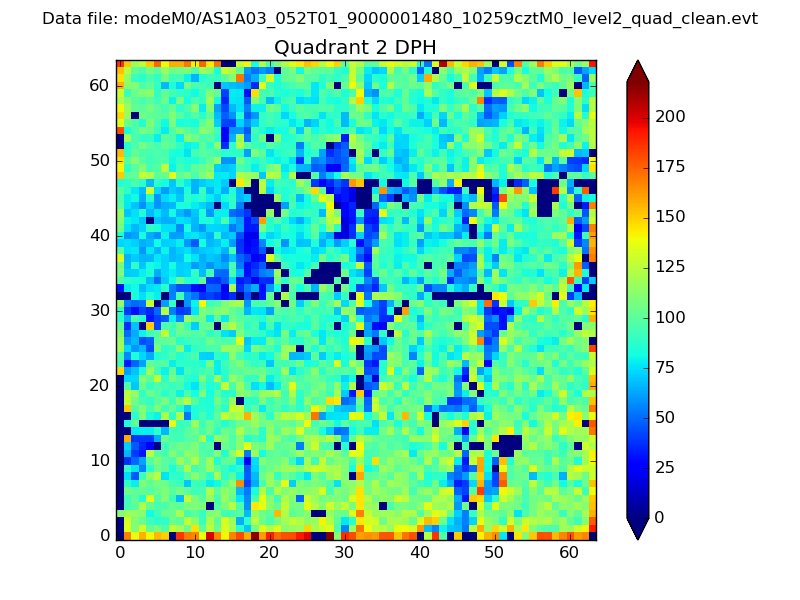
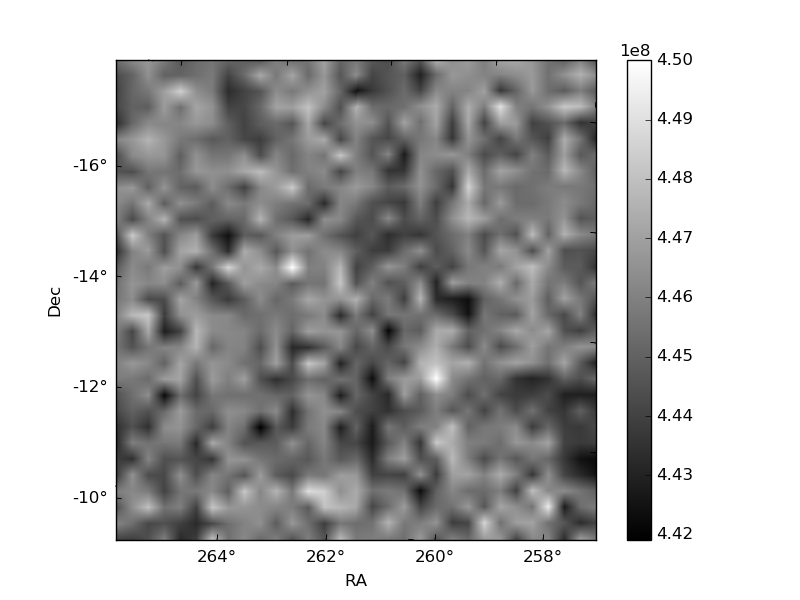
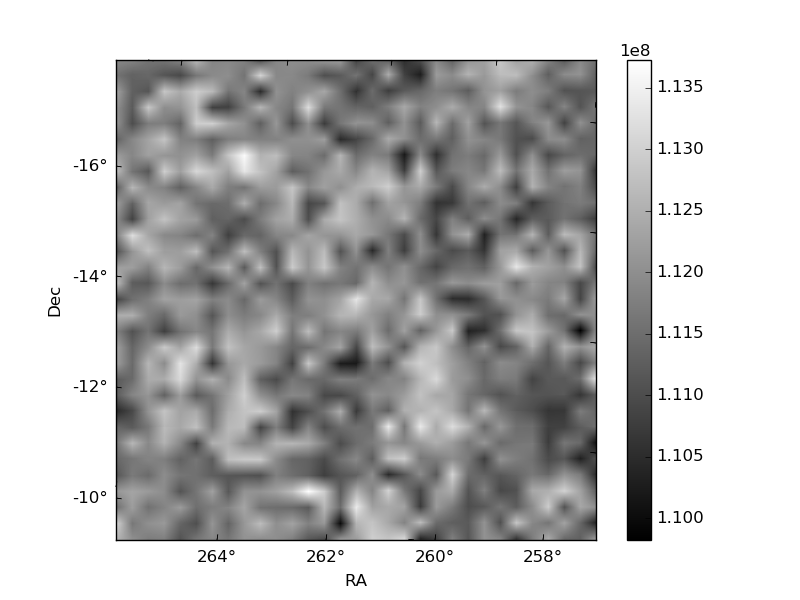
Histogram calculated using DETX and DETY for each event in the final _common_clean file
| Quadrant A | 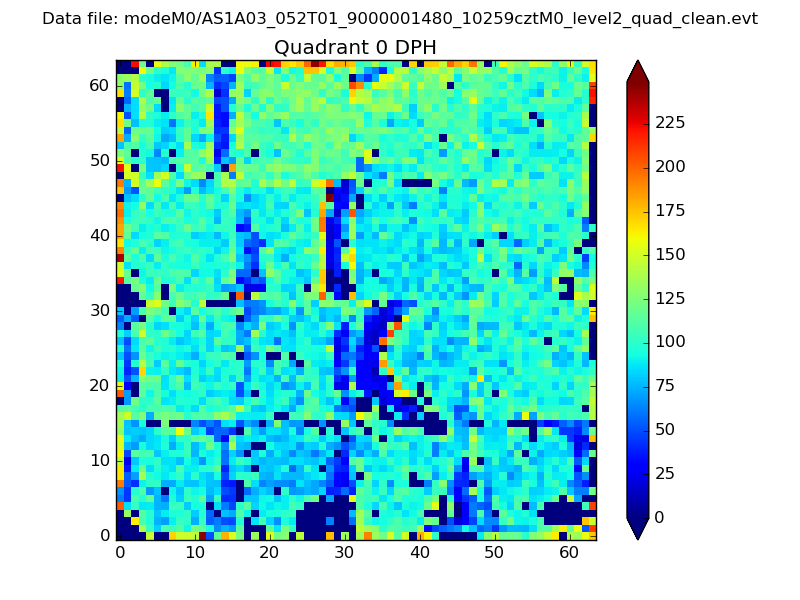 |
 |
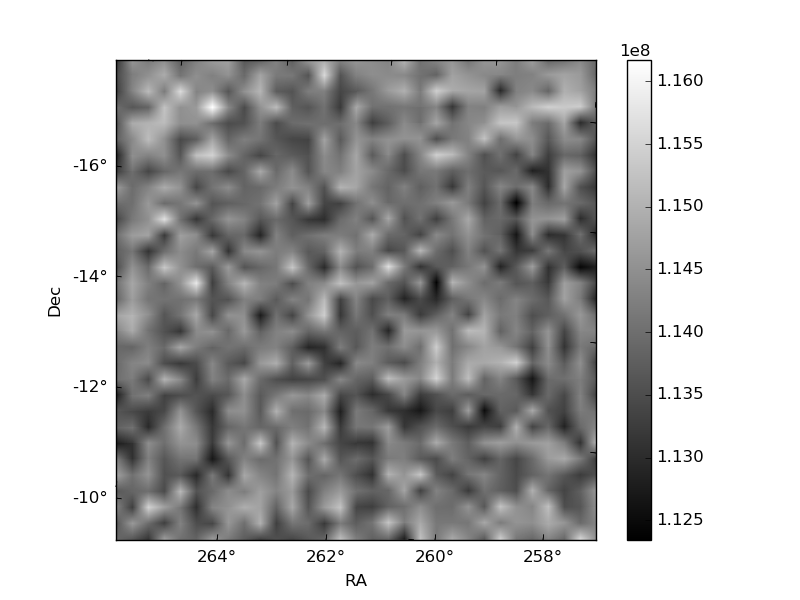
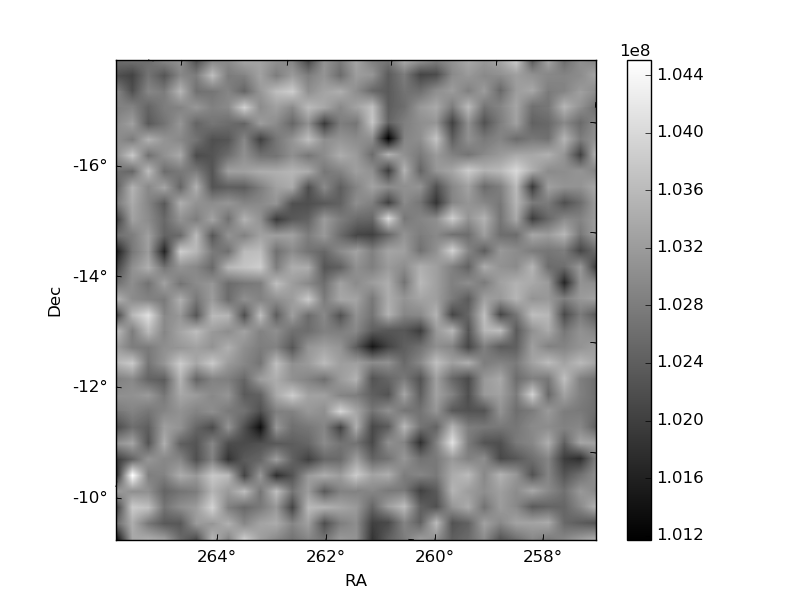
Quadrant B |
|---|---|---|---|
| Quadrant D | 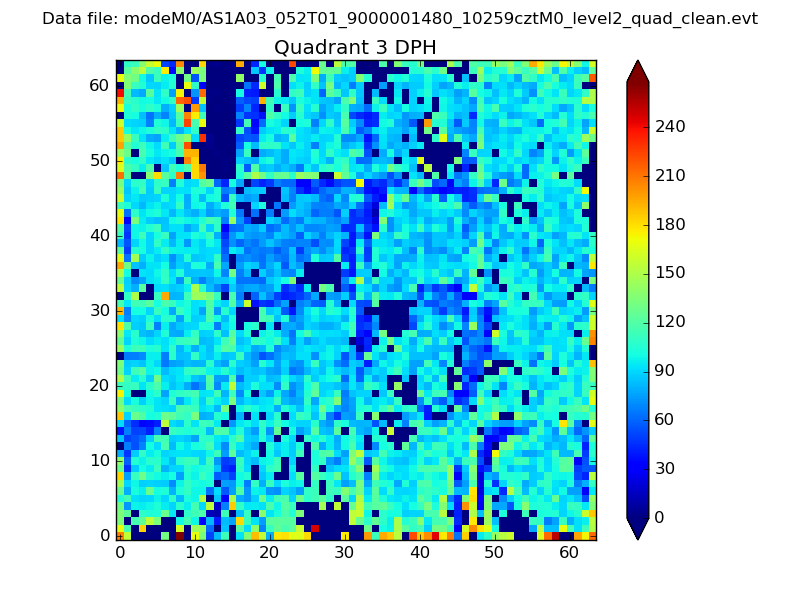 |
 |
Quadrant C |
| Plot type | Count rate plots | Images |
|---|---|---|
| Comparison with Poisson distribution Blue bars denote a histogram of data divided into 1 sec bins. Red curve is a Poisson curve with rate = median count rate of data. |
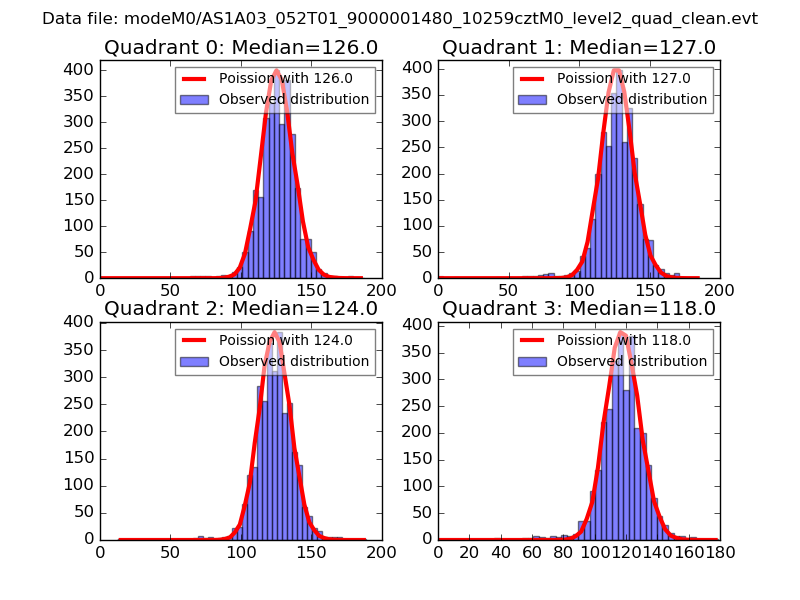 |
 |
| Quadrant-wise count rates Data is divided into 100 sec bins |
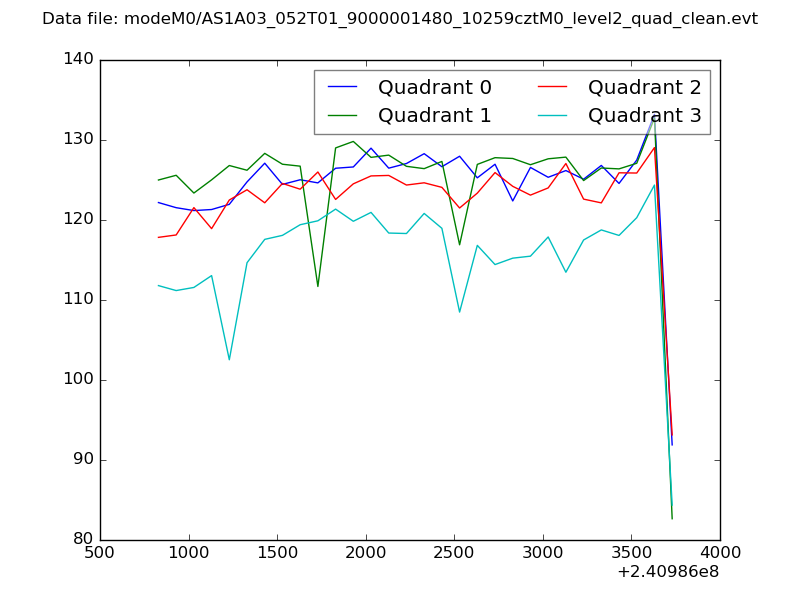 |
|
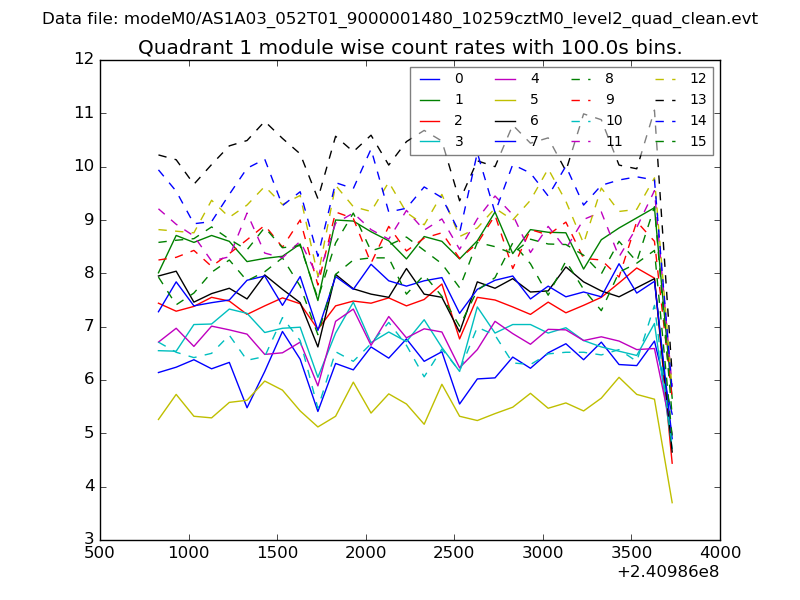
| Module-wise count rates for Quadrant A Data is divided into 100 sec bins |
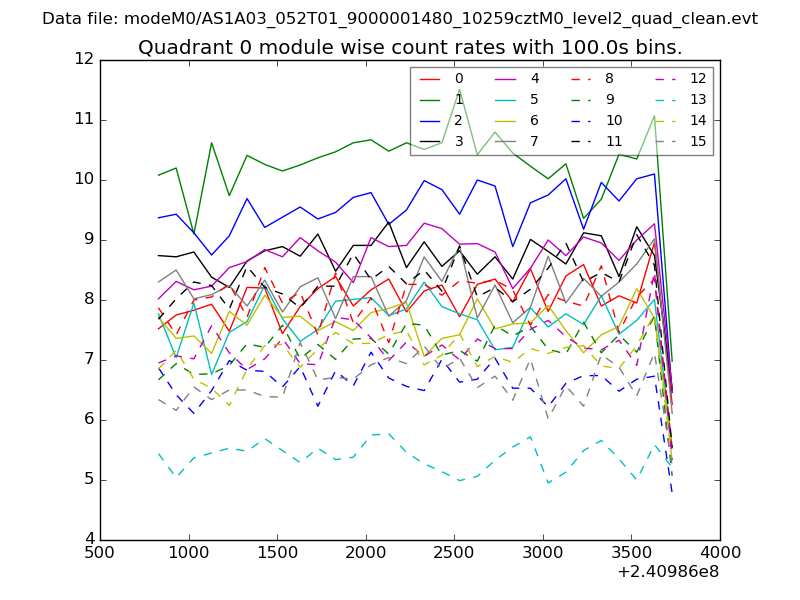 |
 |
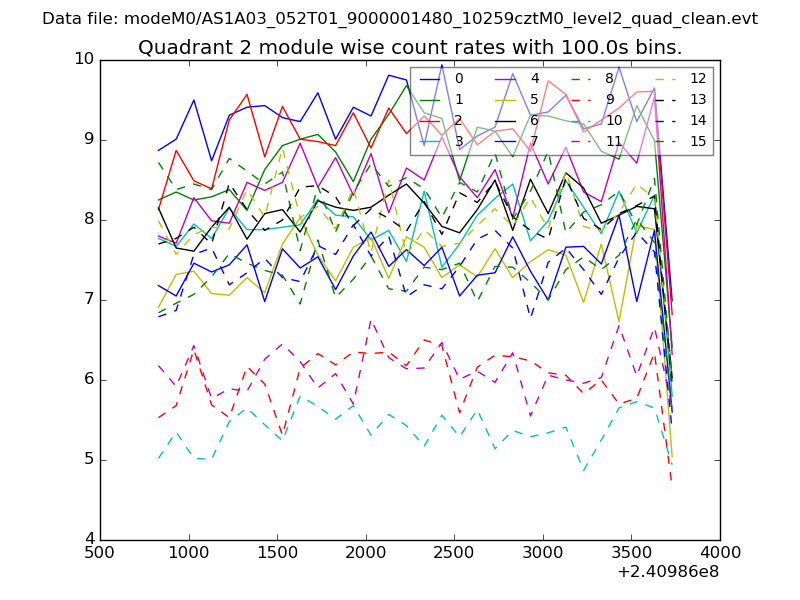
| Module-wise count rates for Quadrant B Data is divided into 100 sec bins |
 |
 |
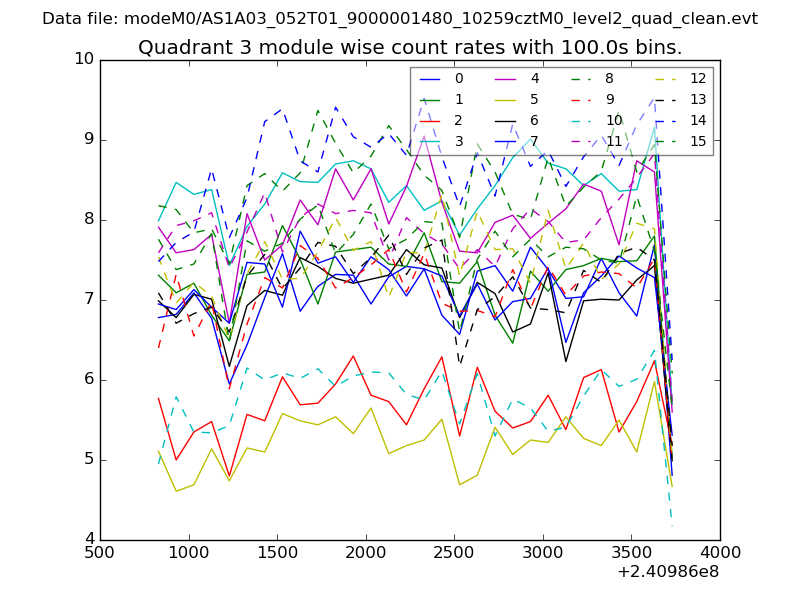
| Module-wise count rates for Quadrant C Data is divided into 100 sec bins |
 |
 |
| Module-wise count rates for Quadrant D Data is divided into 100 sec bins |
 |
 |
| Parameter | Plot |
|---|---|
| CZT HV Monitor | 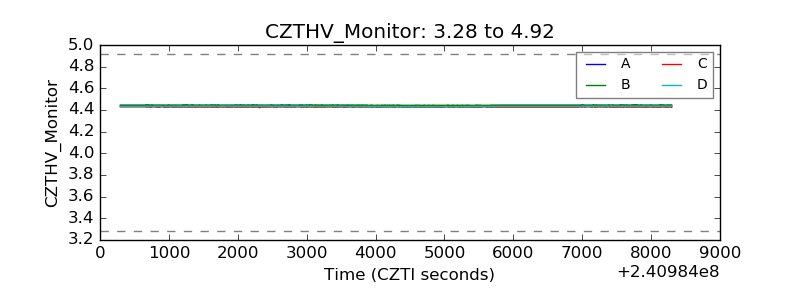 |
| D_VDD | 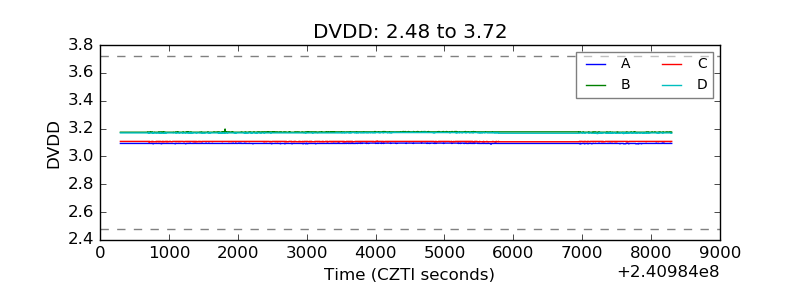 |
| Temperature 1 | 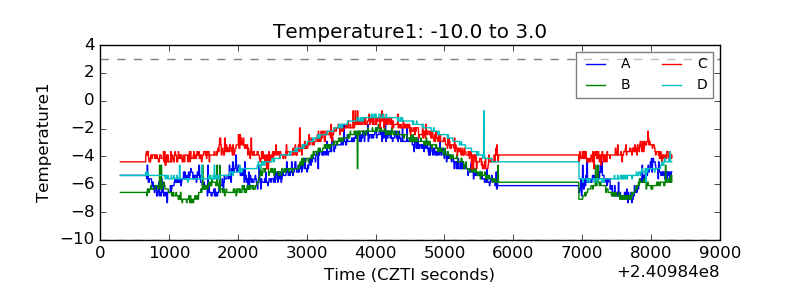 |
| Veto HV Monitor |  |
| Veto LLD | 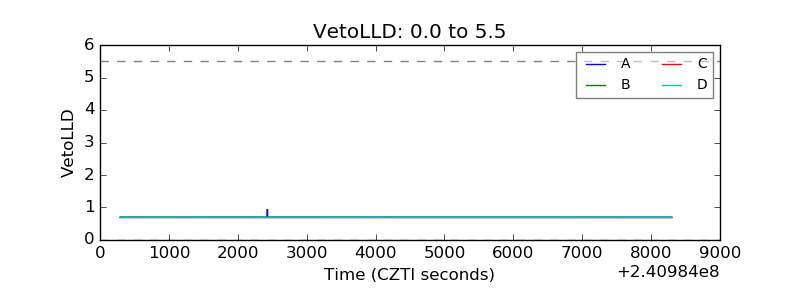 |
| Alpha Counter | 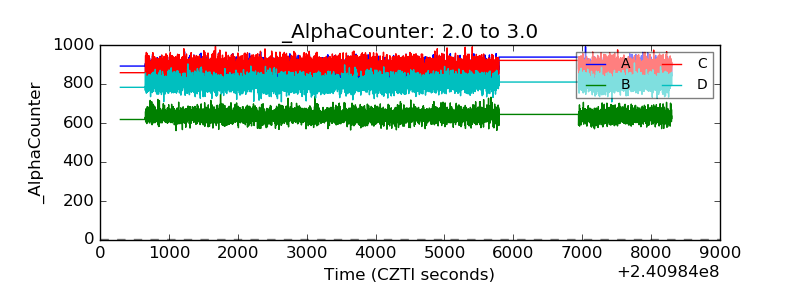 |
| _CPM_Rate | 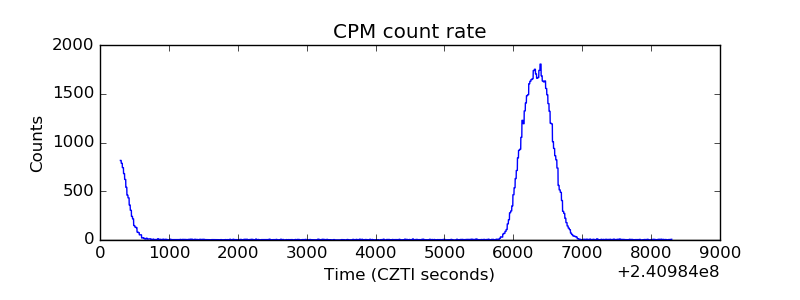 |
| CZT Counter | 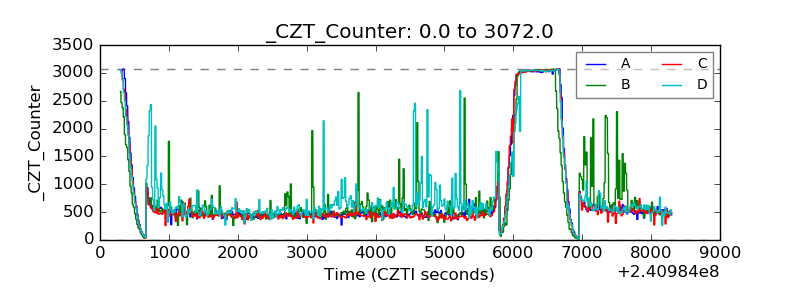 |
| +2.5 Volts monitor |  |
| +5 Volts monitor | 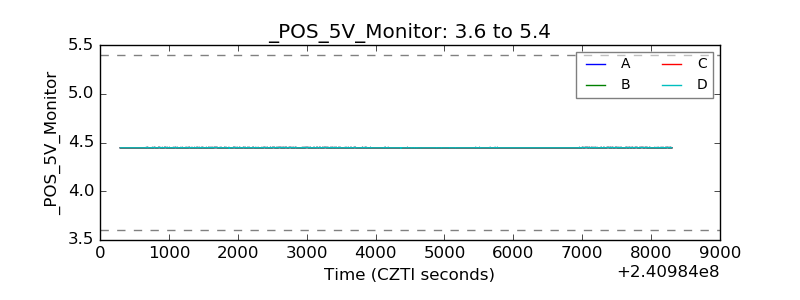 |
| _ROLL_ROT | 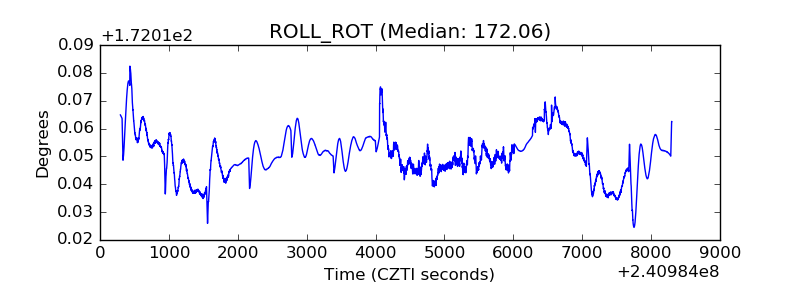 |
| _Roll_DEC | 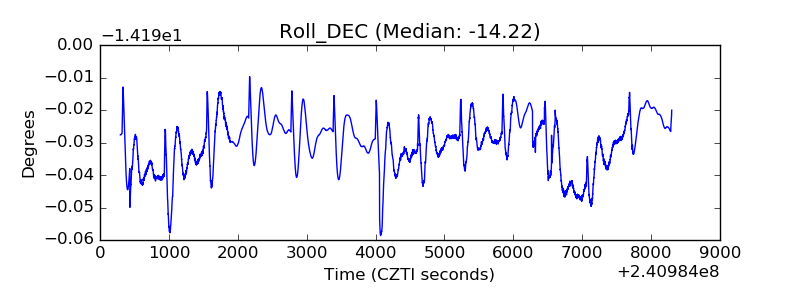 |
| _Roll_RA | 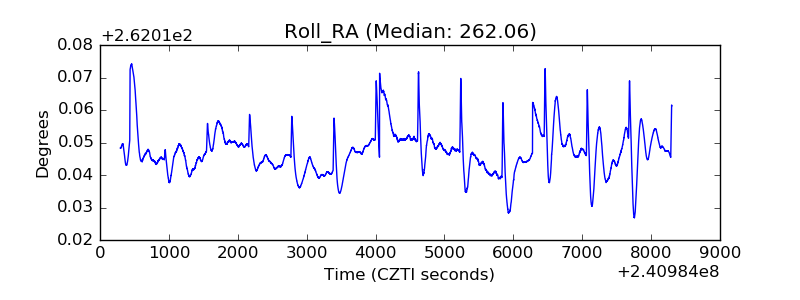 |
| Veto Counter | 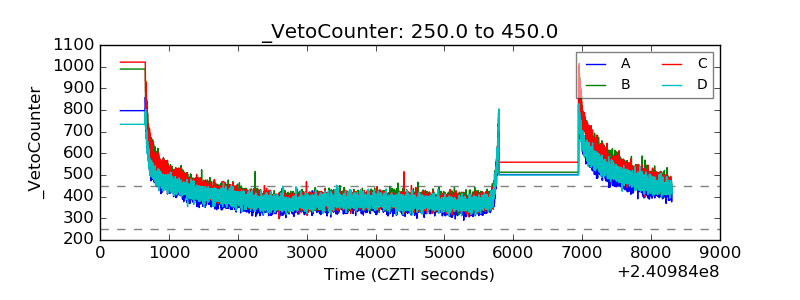 |