| Param | Original file | Final file |
|---|---|---|
| Filename | modeM0/AS1A03_052T01_9000001480_10261cztM0_level2.evt | modeM0/AS1A03_052T01_9000001480_10261cztM0_level2_quad_clean.evt |
| Size (bytes) | 645,661,440 | 127,457,280 |
| Size | 615.8 MB | 121.6 MB |
| Events in quadrant A | 4,609,078 | 778,669 |
| Events in quadrant B | 4,455,057 | 797,312 |
| Events in quadrant C | 4,190,451 | 820,101 |
| Events in quadrant D | 5,712,349 | 864,509 |
| Mode SS | |||
|---|---|---|---|
| Quadrant | BADHDUFLAG | Total packets | Discarded packets |
| A | 0 | 672 | 485 |
| B | 0 | 671 | 475 |
| C | 0 | 672 | 477 |
| D | 0 | 629 | 441 |
| Mode M0 | |||
|---|---|---|---|
| Quadrant | BADHDUFLAG | Total packets | Discarded packets |
| A | 0 | 74407 | 55775 |
| B | 0 | 76896 | 58815 |
| C | 0 | 70434 | 52414 |
| D | 0 | 79582 | 56570 |
| Mode M9 | |||
|---|---|---|---|
| Quadrant | BADHDUFLAG | Total packets | Discarded packets |
| A | 0 | 66 | 40 |
| B | 0 | 82 | 56 |
| C | 0 | 82 | 56 |
| D | 0 | 59 | 34 |
| Quadrant | Total seconds | Saturated seconds | Saturation percentage |
|---|---|---|---|
| A | 8202 | 89 | 1.085101% |
| B | 8181 | 75 | 0.916758% |
| C | 8632 | 64 | 0.741427% |
| D | 9482 | 72 | 0.759333% |
Noise dominated data is calculated using 1-second bins in cleaned event files. If a bin has >2000 counts, and if more than 50% of those come from <1% of pixels, then it is considered to be noise-dominated and hence unusable.
| Quadrant | # 1 sec bins | Bins with >0 counts | Bins with >2000 counts | High rate bins dominated by noise | Noise dominated (total time) | Noise dominated (detector-on time) | Marked lightcurve |
|---|---|---|---|---|---|---|---|
| A | 13002 | 9813 | 0 | 0 | 0.00% | 0.00% | 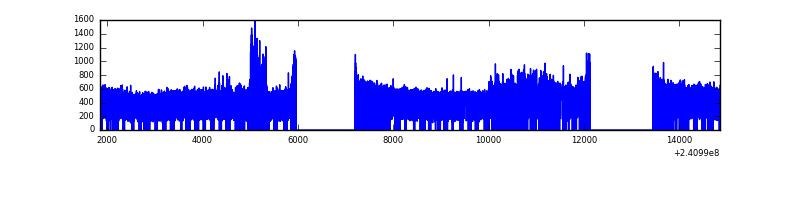 |
| B | 13002 | 9726 | 0 | 0 | 0.00% | 0.00% | 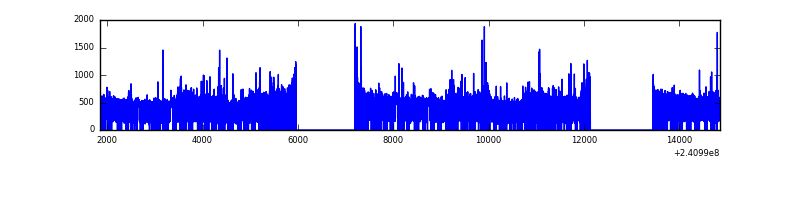 |
| C | 13001 | 10051 | 0 | 0 | 0.00% | 0.00% | 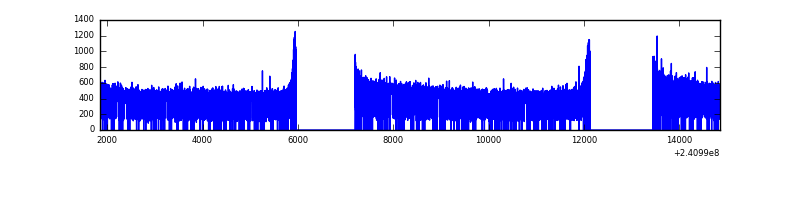 |
| D | 13002 | 10237 | 3 | 3 | 0.02% | 0.03% | 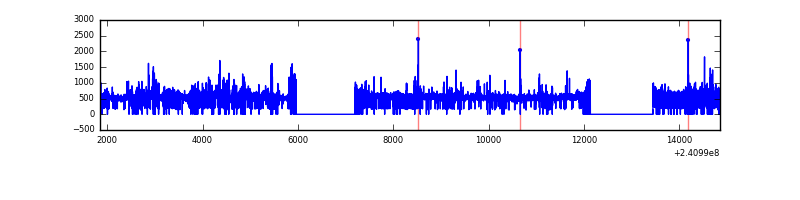 |
Top three noisy pixels from each quadrant. If the there are fewer than three noisy pixels in the level2.evt file, extra rows are filled as -1
| Pixel properties | Quadrant properties | ||||||
|---|---|---|---|---|---|---|---|
| Quadrant | DetID | PixID | Counts | Sigma | Mean | Median | Sigma |
| A | 8 | 15 | 433257 | 2032.15 | 1059 | 1040 | 212.7 |
| A | 15 | 239 | 84170 | 390.85 | 1059 | 1040 | 212.7 |
| A | 3 | 1 | 11201 | 47.77 | 1059 | 1040 | 212.7 |
| B | 11 | 51 | 113802 | 573.05 | 1047 | 1026 | 196.8 |
| B | 0 | 214 | 113341 | 570.7 | 1047 | 1026 | 196.8 |
| B | 4 | 239 | 68724 | 343.99 | 1047 | 1026 | 196.8 |
| C | 9 | 68 | 28218 | 111.53 | 1066 | 1073 | 243.4 |
| C | 13 | 61 | 8003 | 28.47 | 1066 | 1073 | 243.4 |
| C | 14 | 67 | 5569 | 18.47 | 1066 | 1073 | 243.4 |
| D | 8 | 195 | 719224 | 2484.54 | 1167 | 1141 | 289.0 |
| D | 1 | 52 | 257007 | 885.29 | 1167 | 1141 | 289.0 |
| D | 10 | 172 | 93763 | 320.47 | 1167 | 1141 | 289.0 |
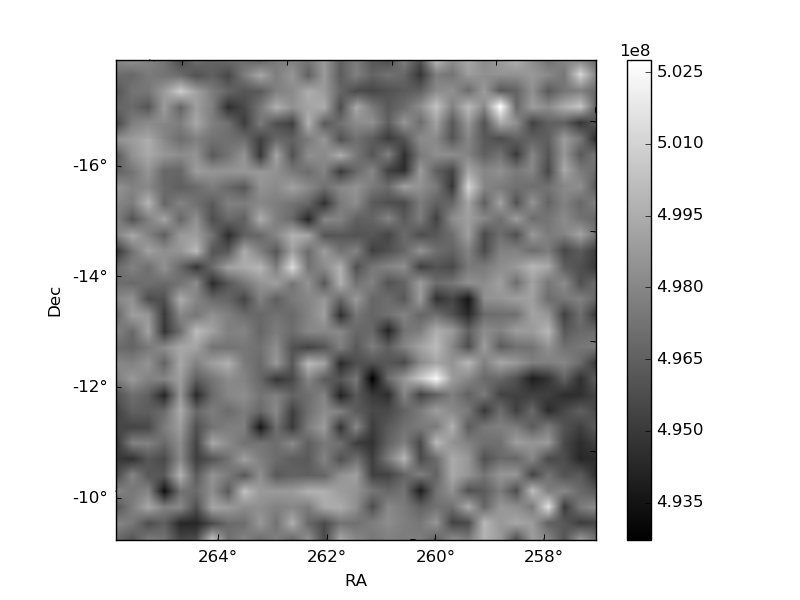
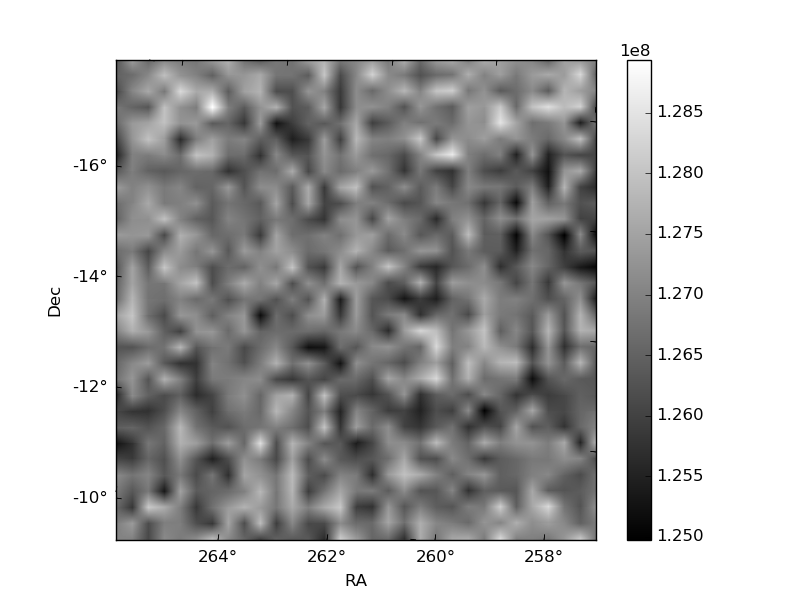
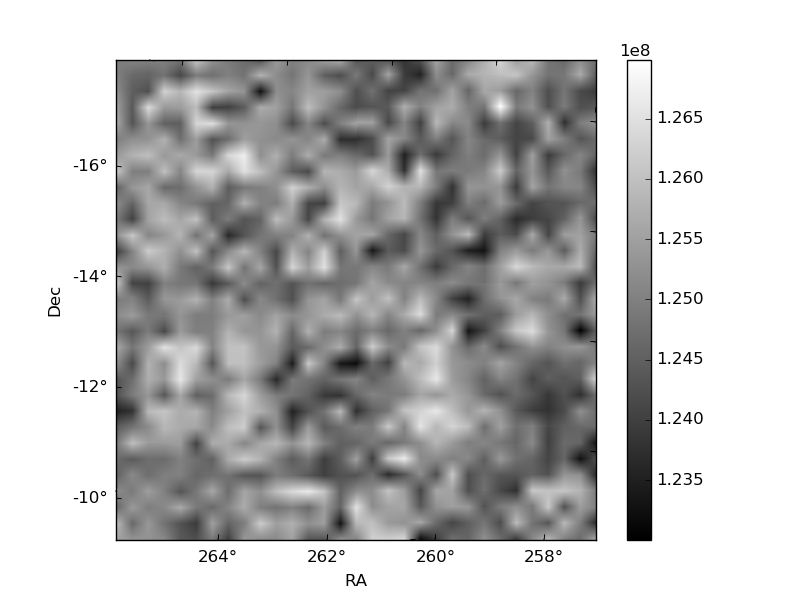
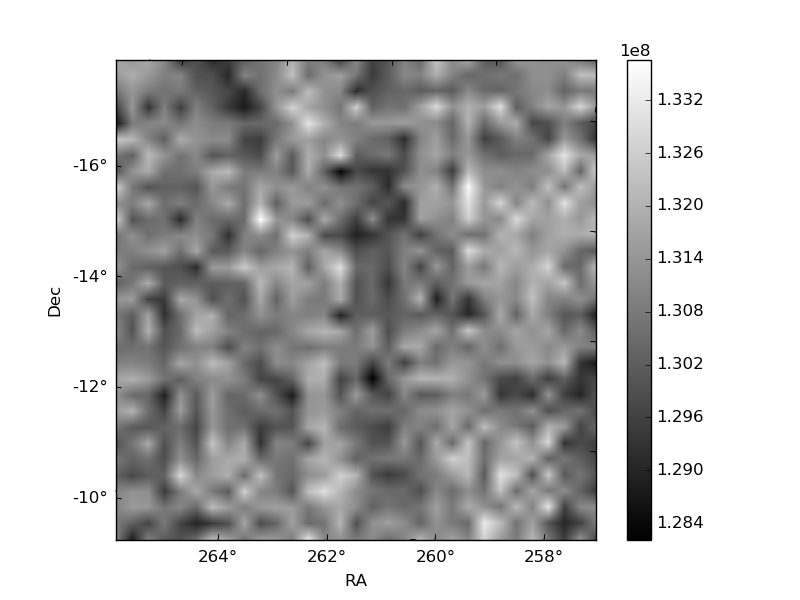
Histogram calculated using DETX and DETY for each event in the final _common_clean file
| Quadrant A | 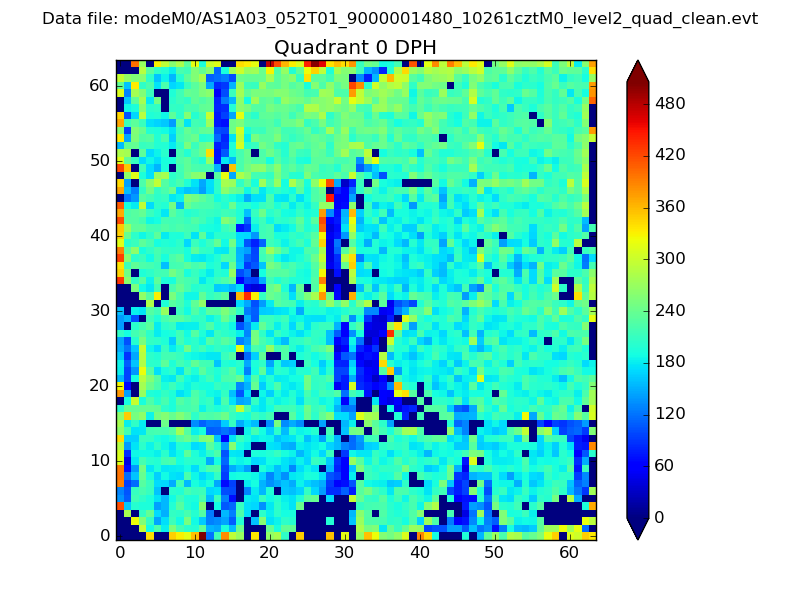 |
 |
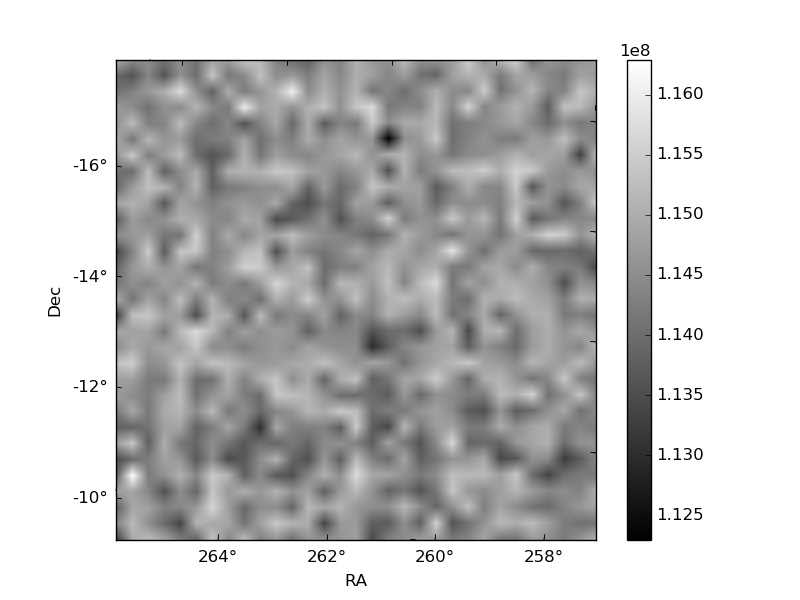
Quadrant B |
|---|---|---|---|
| Quadrant D | 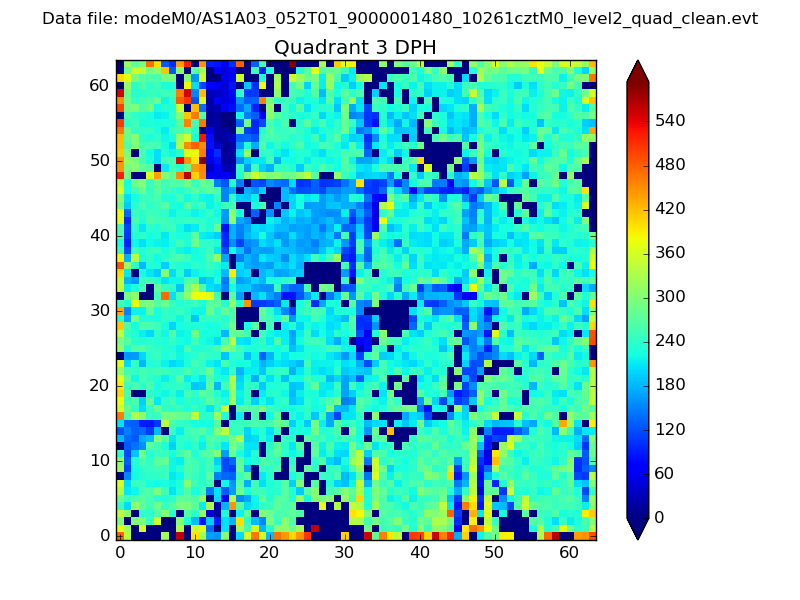 |
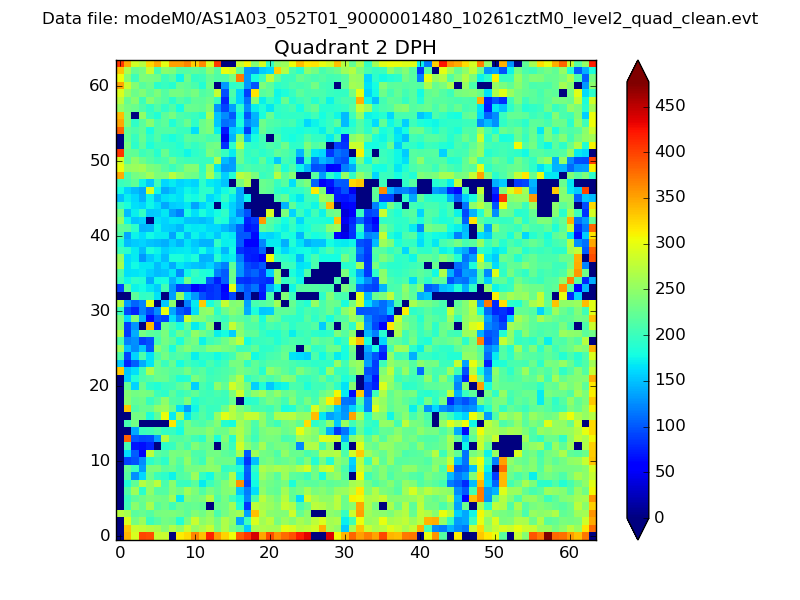 |
Quadrant C |
| Plot type | Count rate plots | Images |
|---|---|---|
| Comparison with Poisson distribution Blue bars denote a histogram of data divided into 1 sec bins. Red curve is a Poisson curve with rate = median count rate of data. |
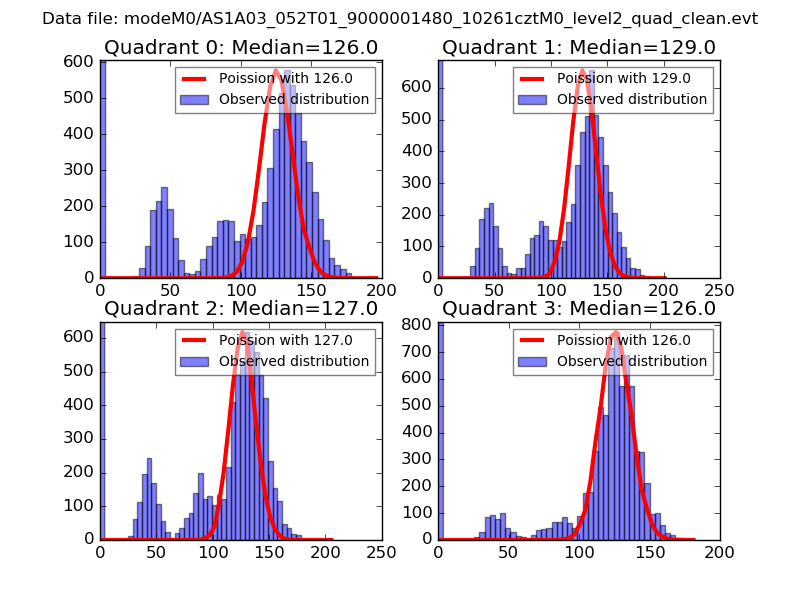 |
 |
| Quadrant-wise count rates Data is divided into 100 sec bins |
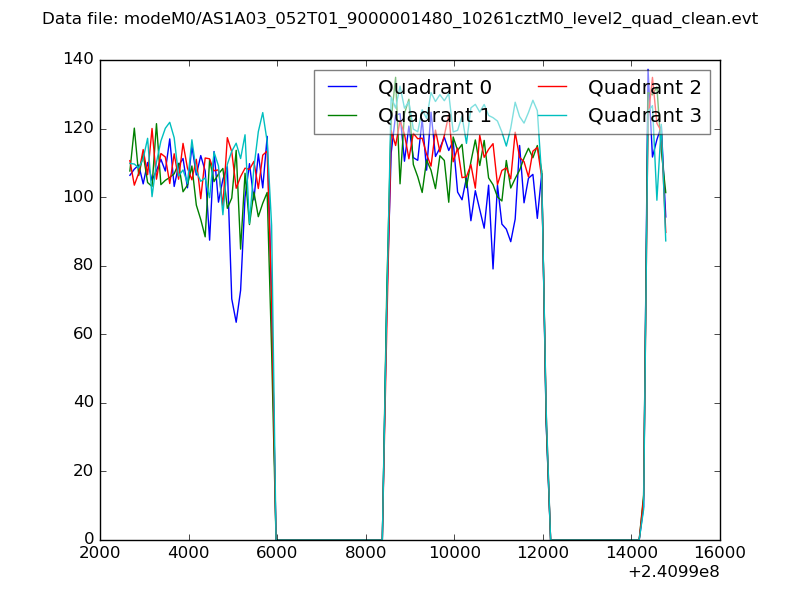 |
|
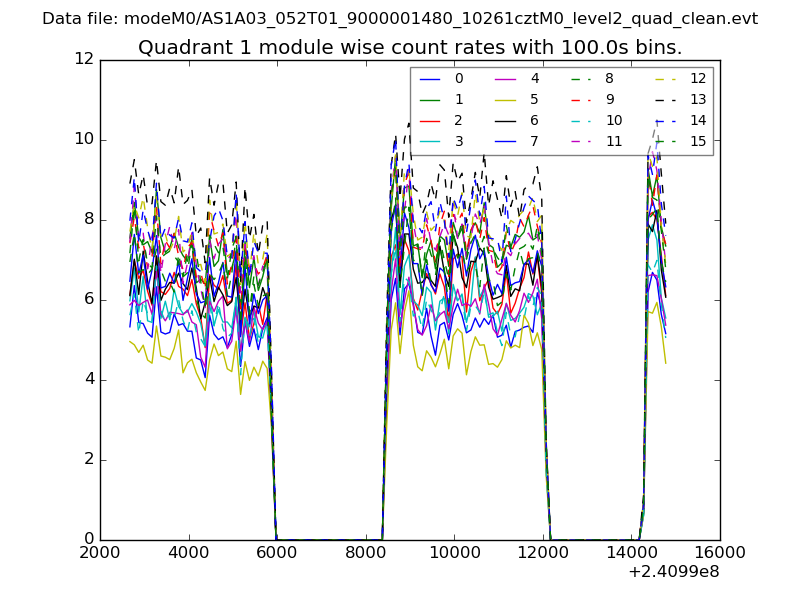
| Module-wise count rates for Quadrant A Data is divided into 100 sec bins |
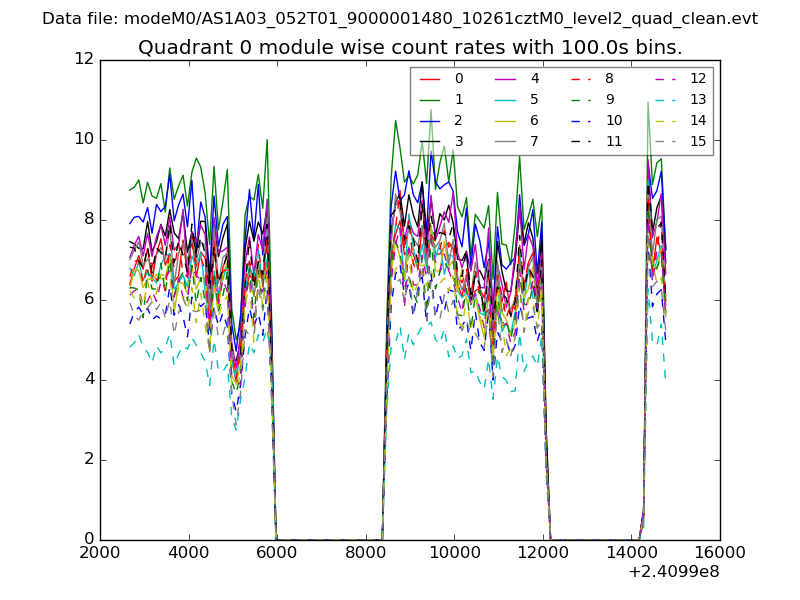 |
 |
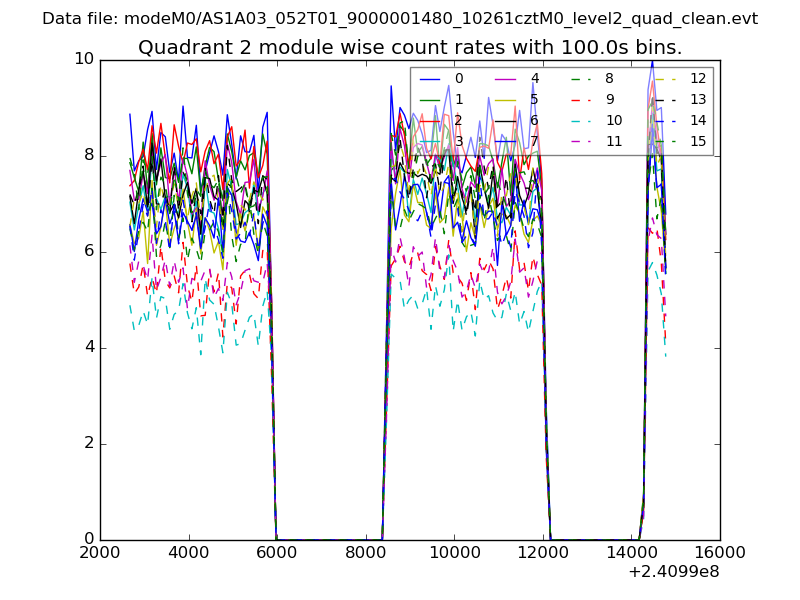
| Module-wise count rates for Quadrant B Data is divided into 100 sec bins |
 |
 |
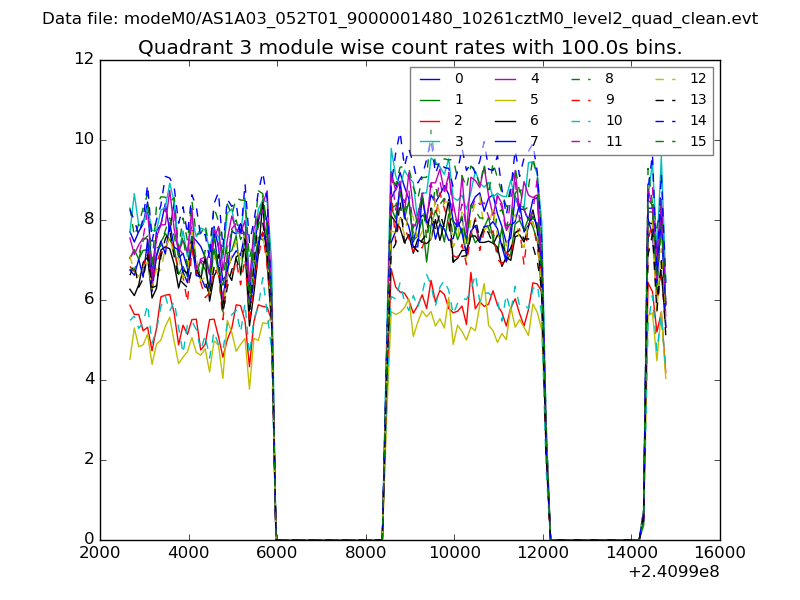
| Module-wise count rates for Quadrant C Data is divided into 100 sec bins |
 |
 |
| Module-wise count rates for Quadrant D Data is divided into 100 sec bins |
 |
 |
| Parameter | Plot |
|---|---|
| CZT HV Monitor | 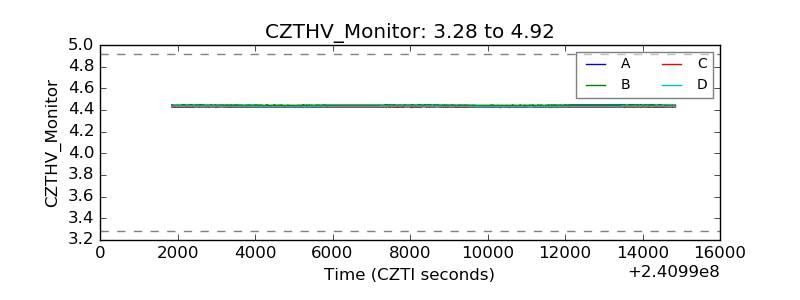 |
| D_VDD | 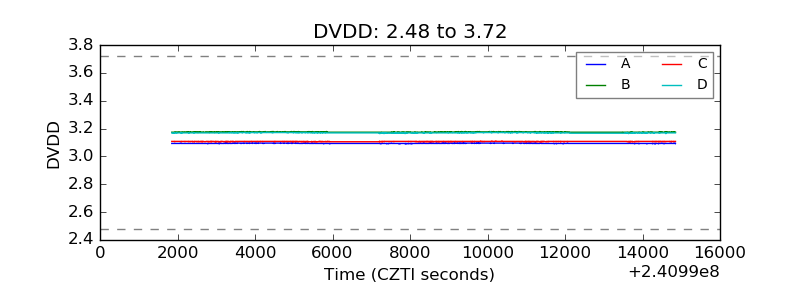 |
| Temperature 1 | 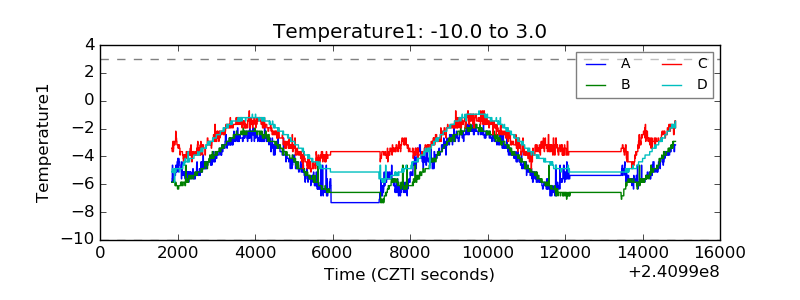 |
| Veto HV Monitor | 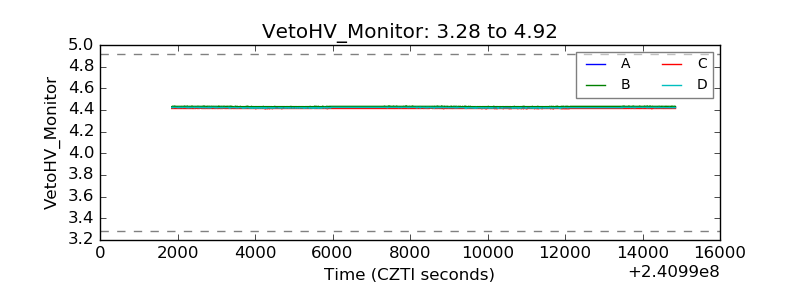 |
| Veto LLD | 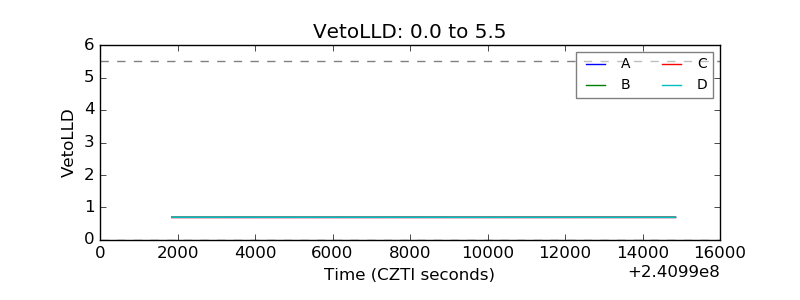 |
| Alpha Counter | 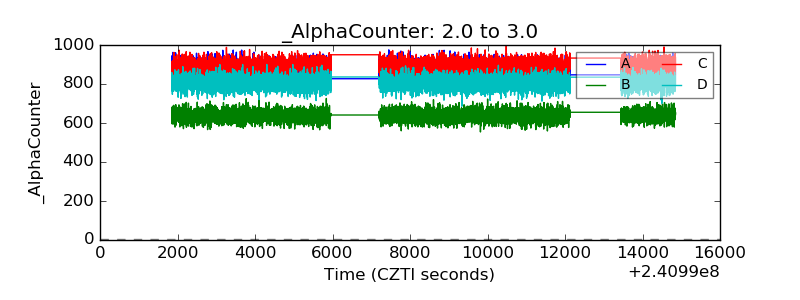 |
| _CPM_Rate | 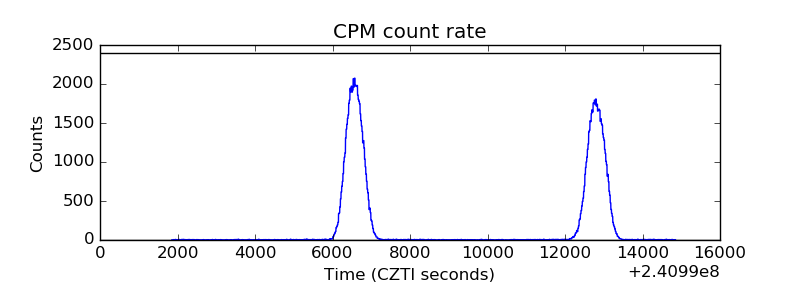 |
| CZT Counter | 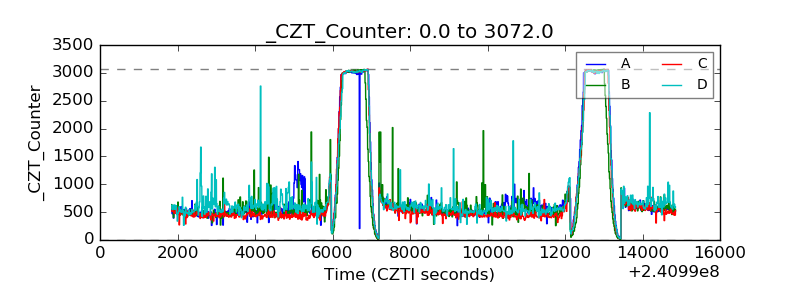 |
| +2.5 Volts monitor | 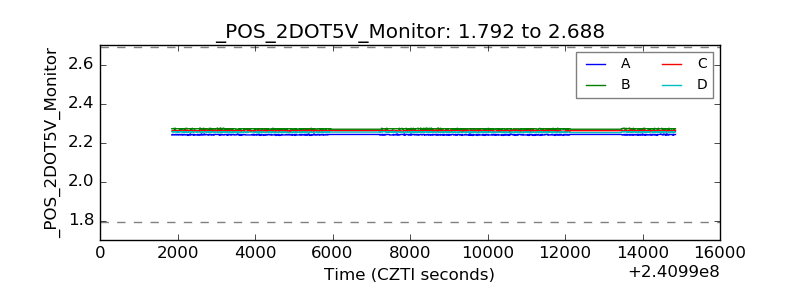 |
| +5 Volts monitor |  |
| _ROLL_ROT | 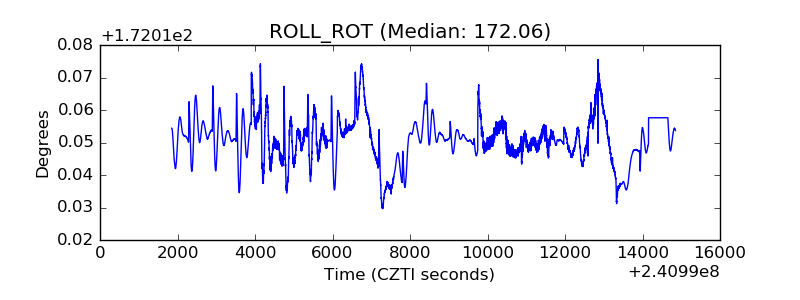 |
| _Roll_DEC | 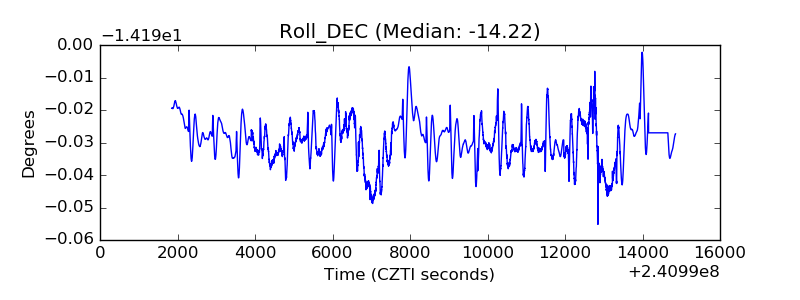 |
| _Roll_RA | 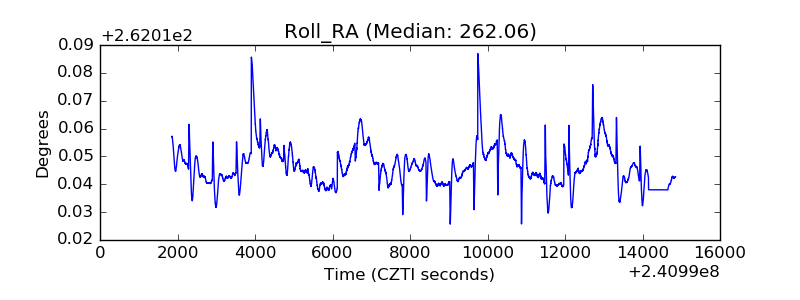 |
| Veto Counter | 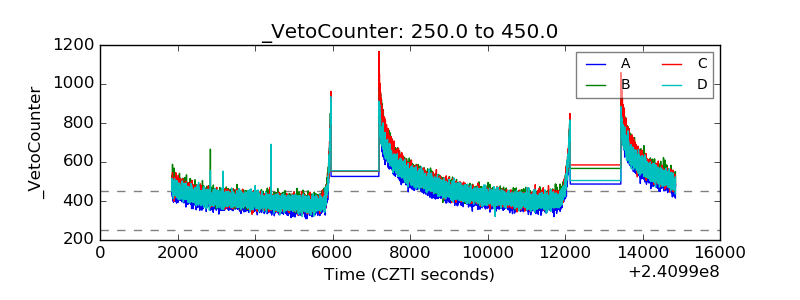 |