| Param | Original file | Final file |
|---|---|---|
| Filename | modeM0/AS1A03_052T01_9000001480_10262cztM0_level2.evt | modeM0/AS1A03_052T01_9000001480_10262cztM0_level2_quad_clean.evt |
| Size (bytes) | 381,245,760 | 77,938,560 |
| Size | 363.6 MB | 74.3 MB |
| Events in quadrant A | 2,621,259 | 513,205 |
| Events in quadrant B | 2,664,258 | 492,933 |
| Events in quadrant C | 2,521,787 | 505,095 |
| Events in quadrant D | 3,395,862 | 496,717 |
| Mode SS | |||
|---|---|---|---|
| Quadrant | BADHDUFLAG | Total packets | Discarded packets |
| A | 0 | 246 | 133 |
| B | 0 | 246 | 131 |
| C | 0 | 246 | 137 |
| D | 0 | 238 | 124 |
| Mode M0 | |||
|---|---|---|---|
| Quadrant | BADHDUFLAG | Total packets | Discarded packets |
| A | 0 | 25897 | 15142 |
| B | 0 | 28621 | 17869 |
| C | 0 | 26352 | 15724 |
| D | 0 | 34381 | 20392 |
| Mode M9 | |||
|---|---|---|---|
| Quadrant | BADHDUFLAG | Total packets | Discarded packets |
| A | 0 | 23 | 9 |
| B | 0 | 28 | 14 |
| C | 0 | 28 | 14 |
| D | 0 | 24 | 10 |
| Quadrant | Total seconds | Saturated seconds | Saturation percentage |
|---|---|---|---|
| A | 4979 | 50 | 1.004218% |
| B | 4785 | 49 | 1.024033% |
| C | 5023 | 40 | 0.796337% |
| D | 5226 | 45 | 0.861079% |
Noise dominated data is calculated using 1-second bins in cleaned event files. If a bin has >2000 counts, and if more than 50% of those come from <1% of pixels, then it is considered to be noise-dominated and hence unusable.
| Quadrant | # 1 sec bins | Bins with >0 counts | Bins with >2000 counts | High rate bins dominated by noise | Noise dominated (total time) | Noise dominated (detector-on time) | Marked lightcurve |
|---|---|---|---|---|---|---|---|
| A | 7537 | 5885 | 0 | 0 | 0.00% | 0.00% |  |
| B | 7537 | 5751 | 1 | 1 | 0.01% | 0.02% |  |
| C | 7536 | 5881 | 0 | 0 | 0.00% | 0.00% | 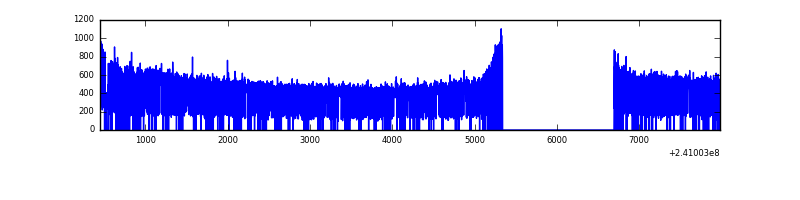 |
| D | 7537 | 5868 | 3 | 3 | 0.04% | 0.05% | 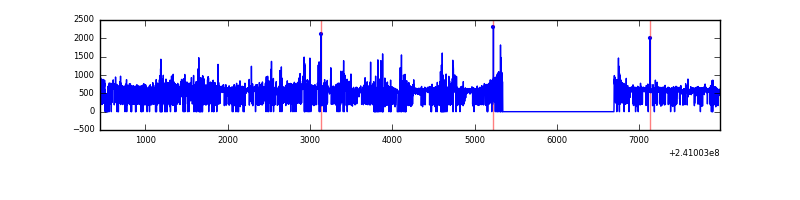 |
Top three noisy pixels from each quadrant. If the there are fewer than three noisy pixels in the level2.evt file, extra rows are filled as -1
| Pixel properties | Quadrant properties | ||||||
|---|---|---|---|---|---|---|---|
| Quadrant | DetID | PixID | Counts | Sigma | Mean | Median | Sigma |
| A | 8 | 15 | 47508 | 349.36 | 665 | 654 | 134.1 |
| A | 3 | 1 | 6835 | 46.09 | 665 | 654 | 134.1 |
| A | 0 | 226 | 6124 | 40.79 | 665 | 654 | 134.1 |
| B | 4 | 239 | 60113 | 497.74 | 633 | 622 | 119.5 |
| B | 0 | 214 | 43062 | 355.08 | 633 | 622 | 119.5 |
| B | 11 | 51 | 38759 | 319.08 | 633 | 622 | 119.5 |
| C | 9 | 68 | 26874 | 179.37 | 638 | 643 | 146.2 |
| C | 13 | 61 | 4911 | 29.18 | 638 | 643 | 146.2 |
| C | 14 | 67 | 2940 | 15.71 | 638 | 643 | 146.2 |
| D | 8 | 195 | 514907 | 3019.02 | 670 | 657 | 170.3 |
| D | 1 | 52 | 129266 | 755.03 | 670 | 657 | 170.3 |
| D | 2 | 16 | 101160 | 590.03 | 670 | 657 | 170.3 |
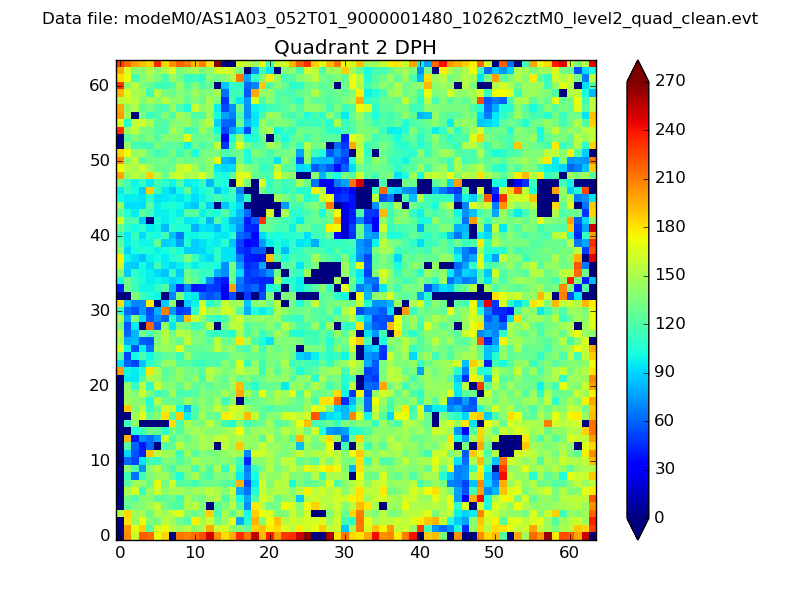
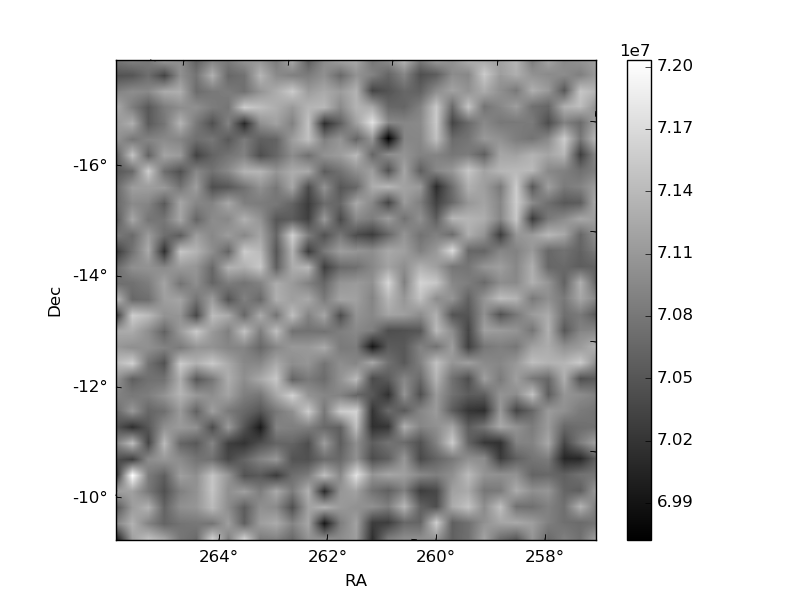
Histogram calculated using DETX and DETY for each event in the final _common_clean file
| Quadrant A | 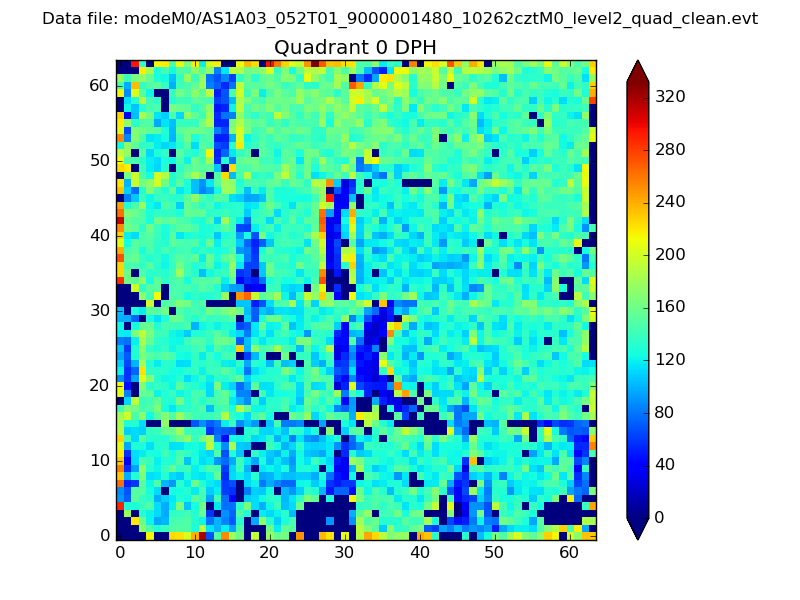 |
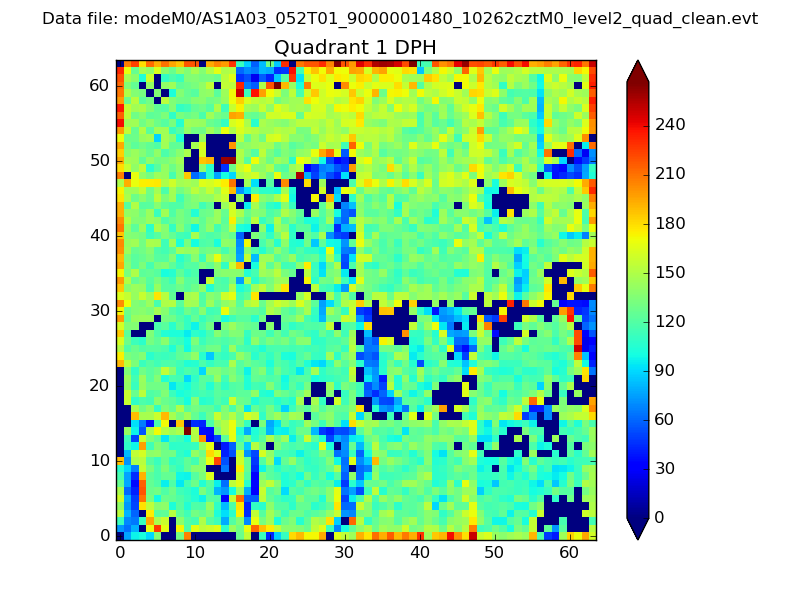 |
Quadrant B |
|---|---|---|---|
| Quadrant D | 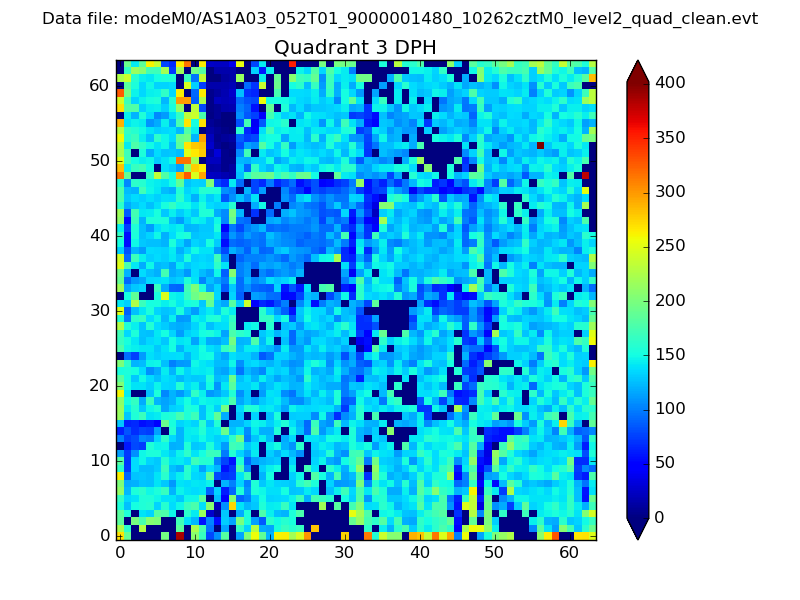 |
 |
Quadrant C |
| Plot type | Count rate plots | Images |
|---|---|---|
| Comparison with Poisson distribution Blue bars denote a histogram of data divided into 1 sec bins. Red curve is a Poisson curve with rate = median count rate of data. |
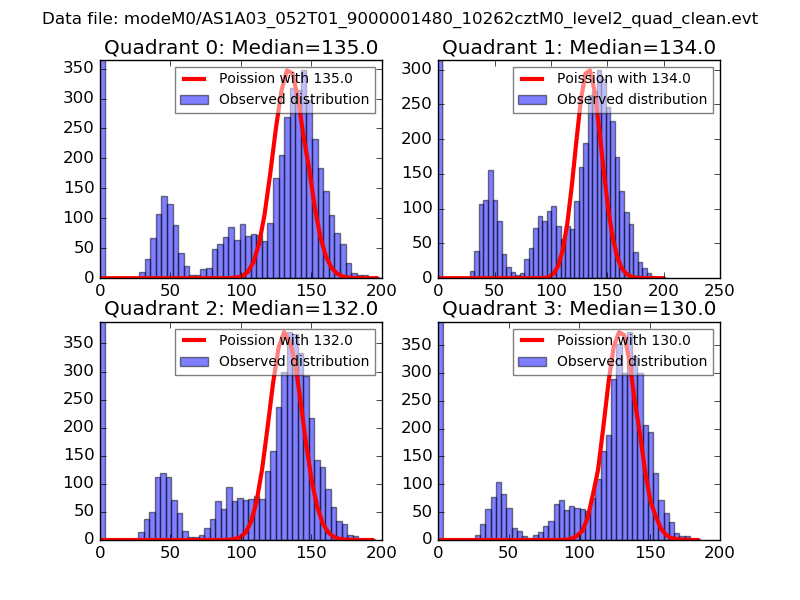 |
 |
| Quadrant-wise count rates Data is divided into 100 sec bins |
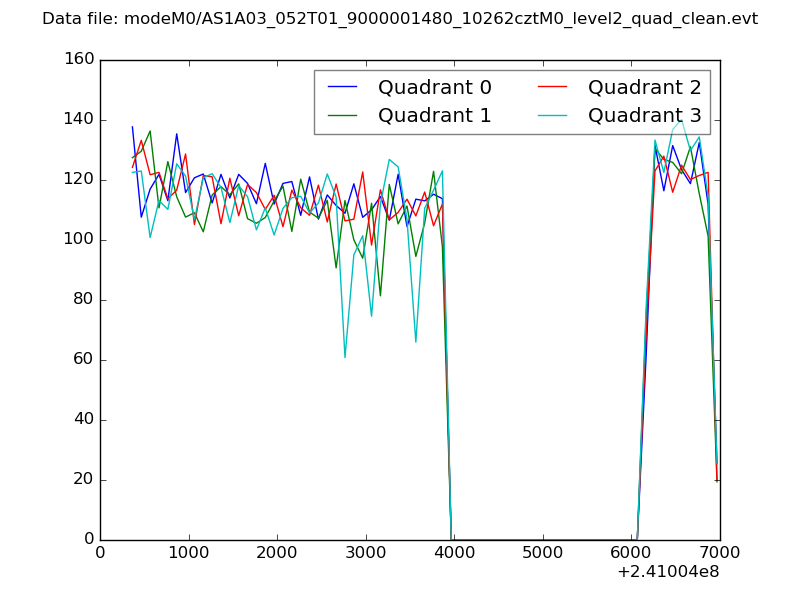 |
|
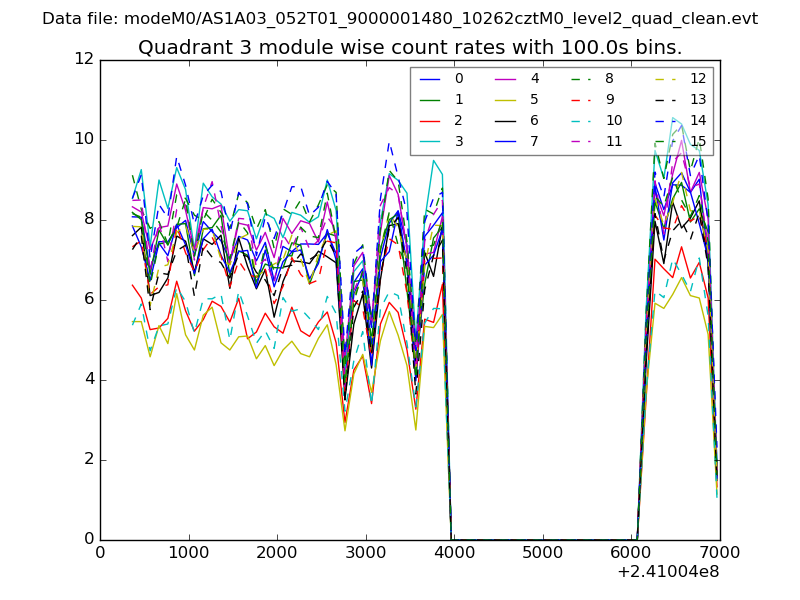
| Module-wise count rates for Quadrant A Data is divided into 100 sec bins |
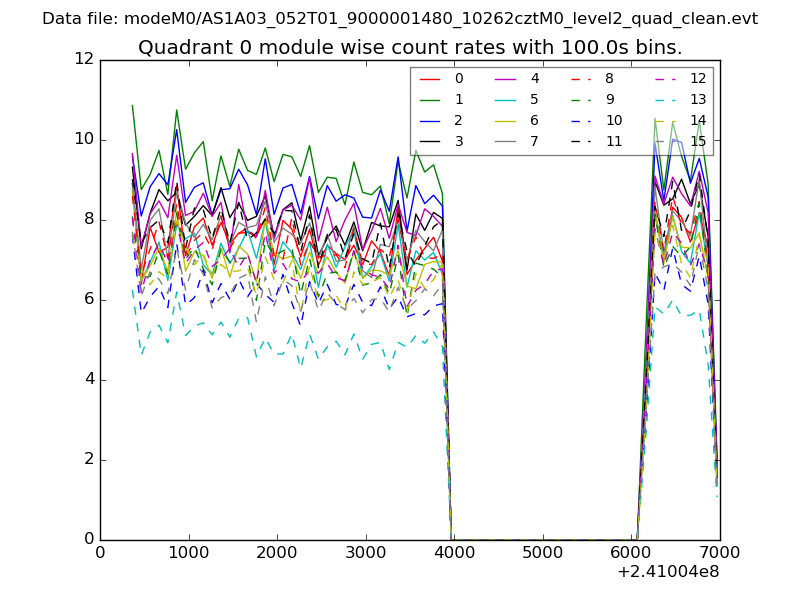 |
 |
| Module-wise count rates for Quadrant B Data is divided into 100 sec bins |
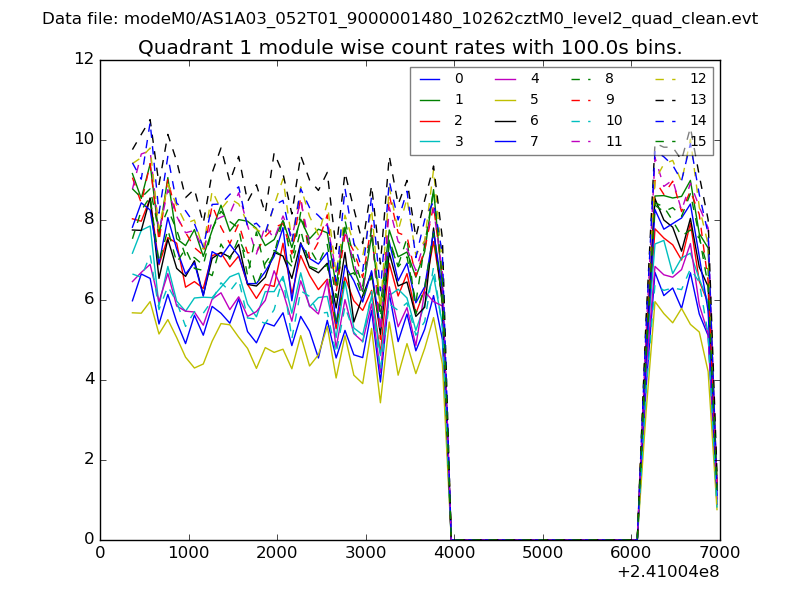 |
 |
| Module-wise count rates for Quadrant C Data is divided into 100 sec bins |
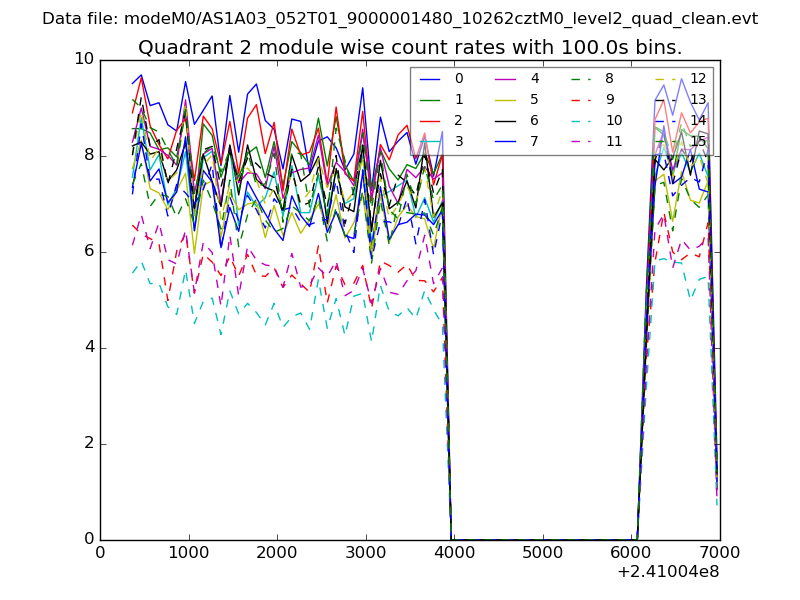 |
 |
| Module-wise count rates for Quadrant D Data is divided into 100 sec bins |
 |
 |
| Parameter | Plot |
|---|---|
| CZT HV Monitor | 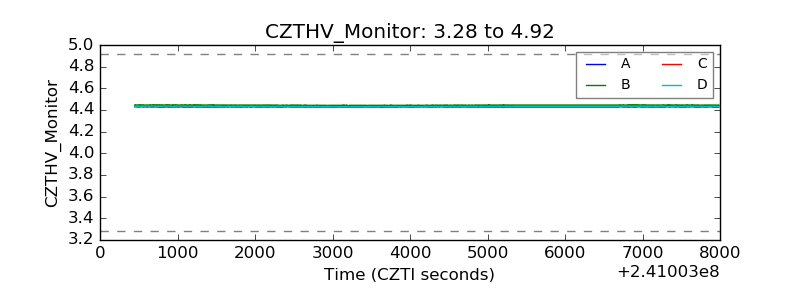 |
| D_VDD | 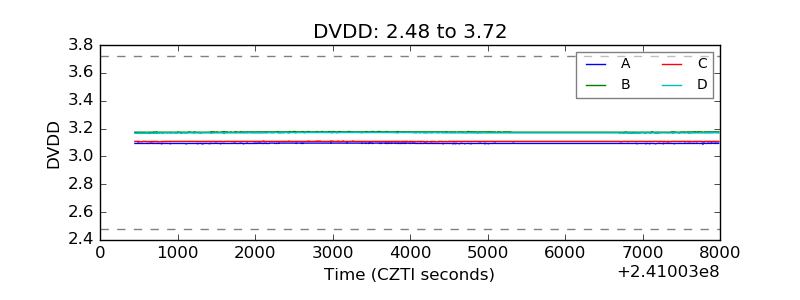 |
| Temperature 1 | 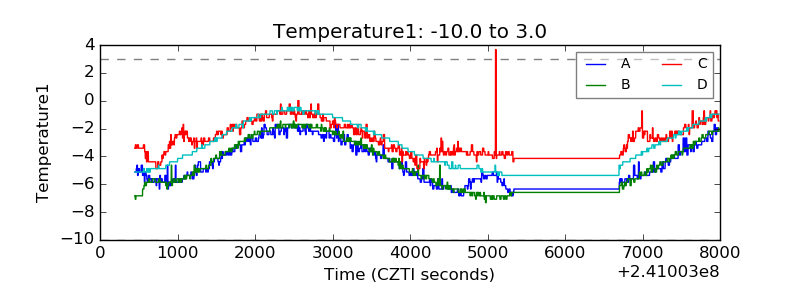 |
| Veto HV Monitor | 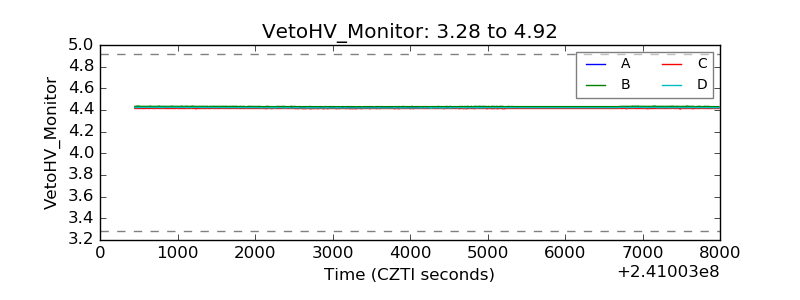 |
| Veto LLD | 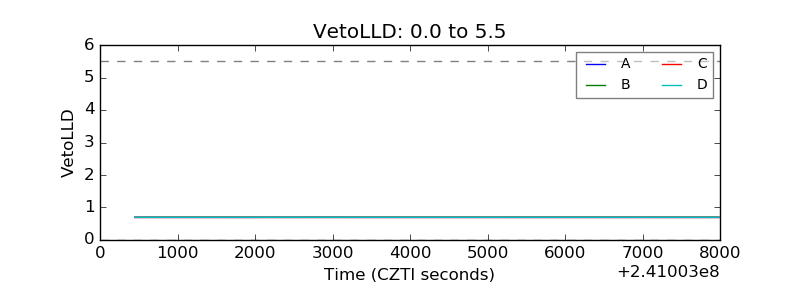 |
| Alpha Counter | 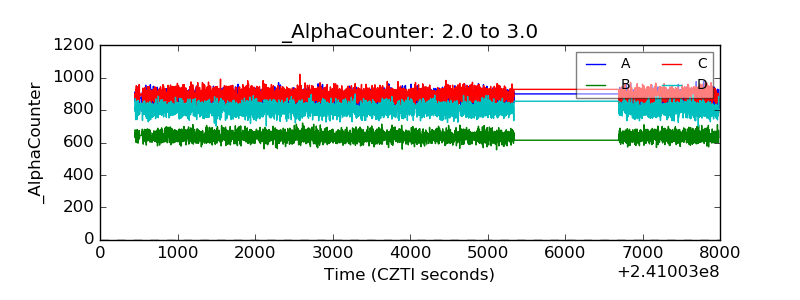 |
| _CPM_Rate | 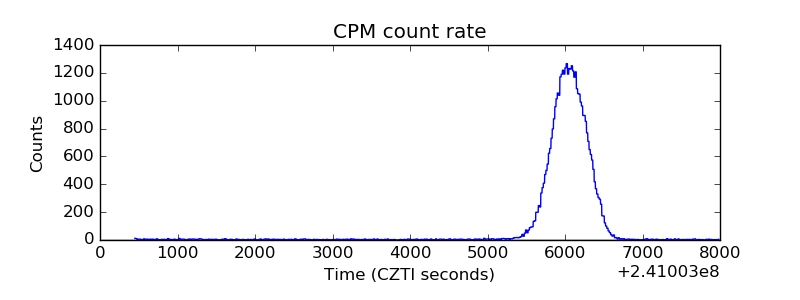 |
| CZT Counter | 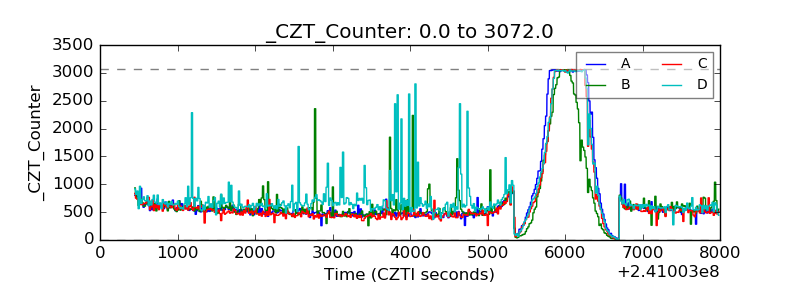 |
| +2.5 Volts monitor |  |
| +5 Volts monitor |  |
| _ROLL_ROT | 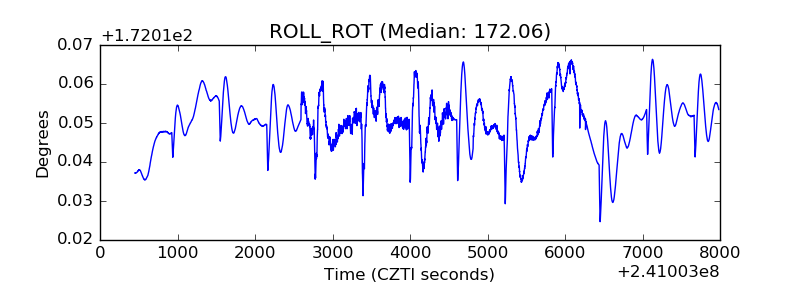 |
| _Roll_DEC | 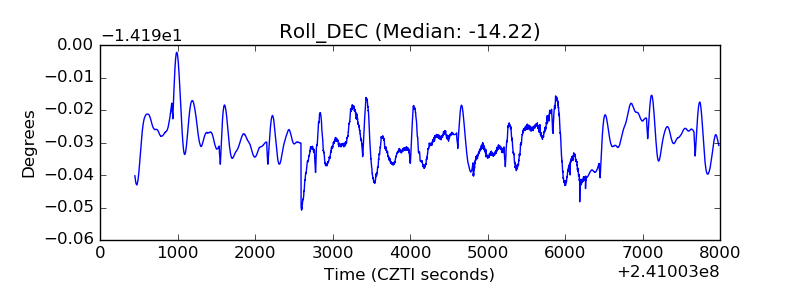 |
| _Roll_RA | 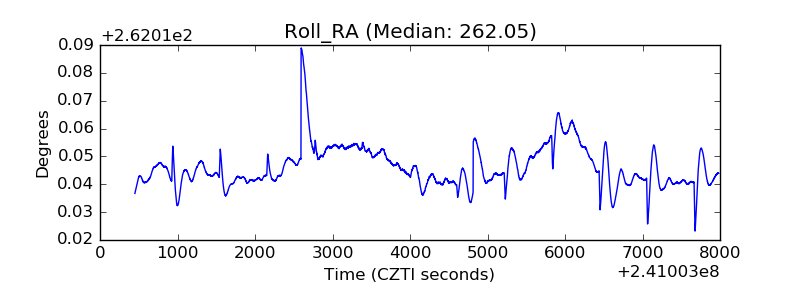 |
| Veto Counter | 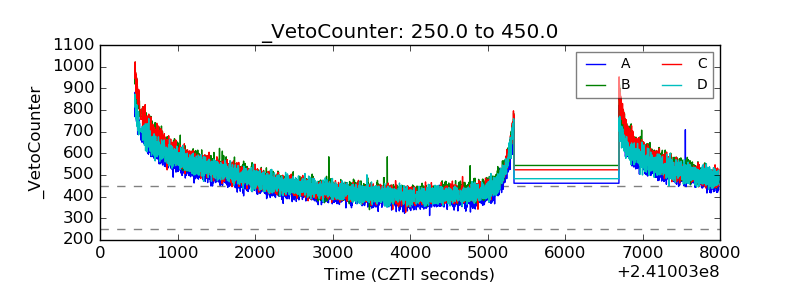 |