| Param | Original file | Final file |
|---|---|---|
| Filename | modeM0/AS1A03_052T01_9000001480_10263cztM0_level2.evt | modeM0/AS1A03_052T01_9000001480_10263cztM0_level2_quad_clean.evt |
| Size (bytes) | 608,719,680 | 142,191,360 |
| Size | 580.5 MB | 135.6 MB |
| Events in quadrant A | 4,132,005 | 941,933 |
| Events in quadrant B | 4,278,870 | 899,598 |
| Events in quadrant C | 3,941,587 | 921,370 |
| Events in quadrant D | 5,511,859 | 960,737 |
| Mode SS | |||
|---|---|---|---|
| Quadrant | BADHDUFLAG | Total packets | Discarded packets |
| A | 0 | 672 | 482 |
| B | 0 | 672 | 484 |
| C | 0 | 672 | 486 |
| D | 0 | 649 | 456 |
| Mode M0 | |||
|---|---|---|---|
| Quadrant | BADHDUFLAG | Total packets | Discarded packets |
| A | 0 | 65692 | 48481 |
| B | 0 | 75957 | 58474 |
| C | 0 | 68420 | 51328 |
| D | 0 | 80262 | 57951 |
| Mode M9 | |||
|---|---|---|---|
| Quadrant | BADHDUFLAG | Total packets | Discarded packets |
| A | 0 | 75 | 49 |
| B | 0 | 87 | 61 |
| C | 0 | 87 | 61 |
| D | 0 | 74 | 48 |
| Quadrant | Total seconds | Saturated seconds | Saturation percentage |
|---|---|---|---|
| A | 8243 | 122 | 1.480044% |
| B | 7887 | 134 | 1.698998% |
| C | 8286 | 107 | 1.291335% |
| D | 9016 | 121 | 1.342059% |
Noise dominated data is calculated using 1-second bins in cleaned event files. If a bin has >2000 counts, and if more than 50% of those come from <1% of pixels, then it is considered to be noise-dominated and hence unusable.
| Quadrant | # 1 sec bins | Bins with >0 counts | Bins with >2000 counts | High rate bins dominated by noise | Noise dominated (total time) | Noise dominated (detector-on time) | Marked lightcurve |
|---|---|---|---|---|---|---|---|
| A | 12637 | 9686 | 0 | 0 | 0.00% | 0.00% | 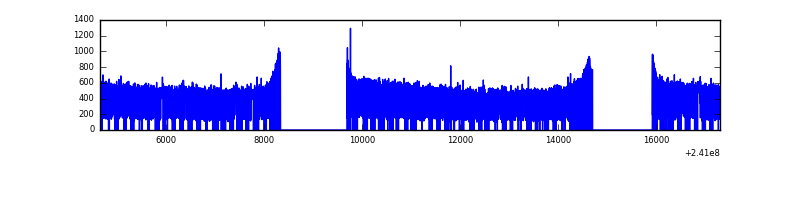 |
| B | 12638 | 9446 | 1 | 1 | 0.01% | 0.01% | 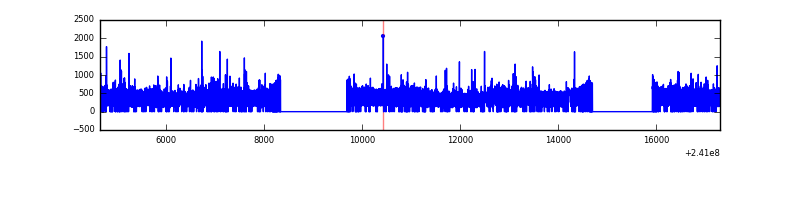 |
| C | 12638 | 9684 | 0 | 0 | 0.00% | 0.00% | 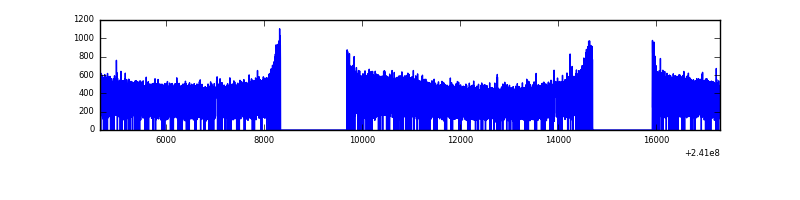 |
| D | 12636 | 9767 | 6 | 6 | 0.05% | 0.06% | 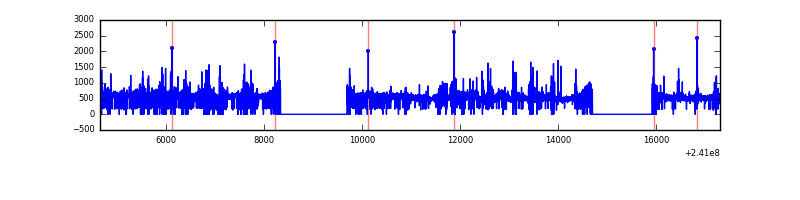 |
Top three noisy pixels from each quadrant. If the there are fewer than three noisy pixels in the level2.evt file, extra rows are filled as -1
| Pixel properties | Quadrant properties | ||||||
|---|---|---|---|---|---|---|---|
| Quadrant | DetID | PixID | Counts | Sigma | Mean | Median | Sigma |
| A | 8 | 15 | 50053 | 230.39 | 1056 | 1037 | 212.8 |
| A | 3 | 1 | 10633 | 45.1 | 1056 | 1037 | 212.8 |
| A | 0 | 226 | 9851 | 41.43 | 1056 | 1037 | 212.8 |
| B | 4 | 239 | 107723 | 564.96 | 999 | 979 | 188.9 |
| B | 11 | 51 | 94303 | 493.93 | 999 | 979 | 188.9 |
| B | 0 | 214 | 79091 | 413.42 | 999 | 979 | 188.9 |
| C | 13 | 61 | 7716 | 28.85 | 1010 | 1020 | 232.1 |
| C | 14 | 67 | 4117 | 13.35 | 1010 | 1020 | 232.1 |
| C | 3 | 202 | 2467 | 6.24 | 1010 | 1020 | 232.1 |
| D | 8 | 195 | 546188 | 1886.25 | 1104 | 1088 | 289.0 |
| D | 2 | 16 | 340260 | 1173.66 | 1104 | 1088 | 289.0 |
| D | 1 | 52 | 229840 | 791.57 | 1104 | 1088 | 289.0 |
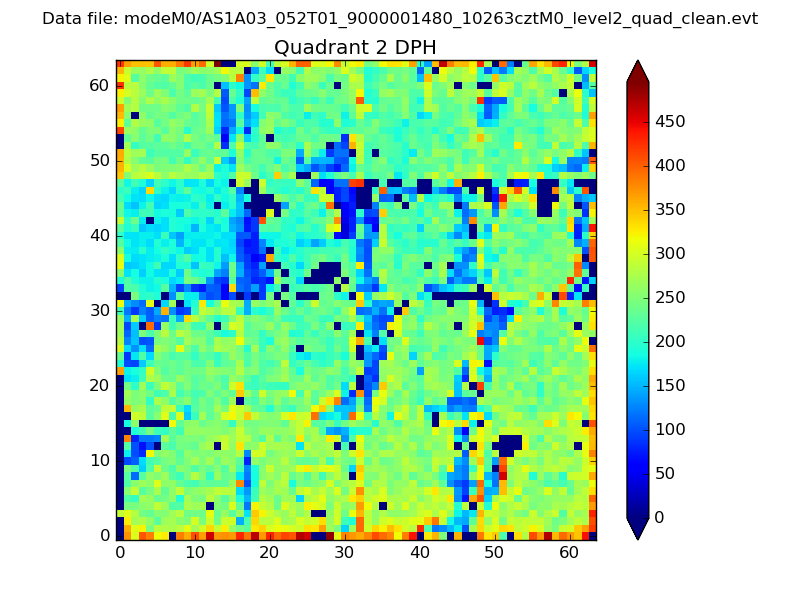
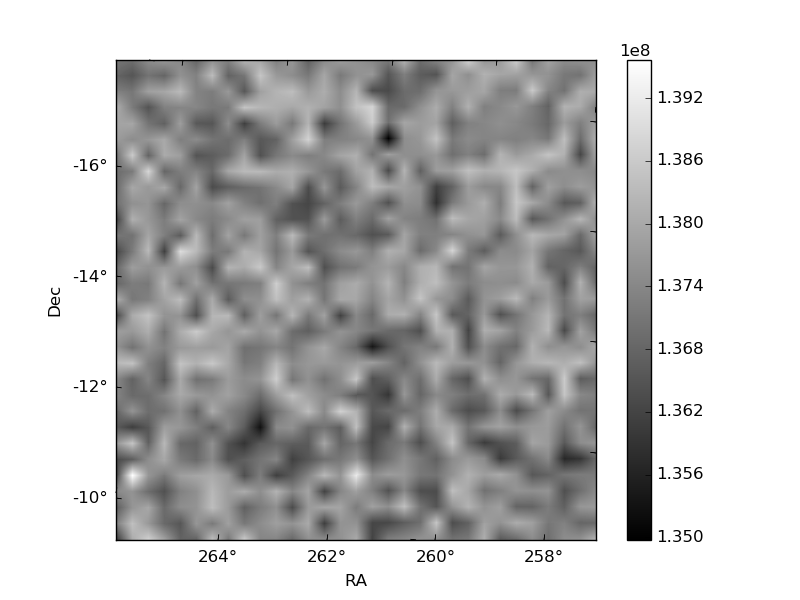
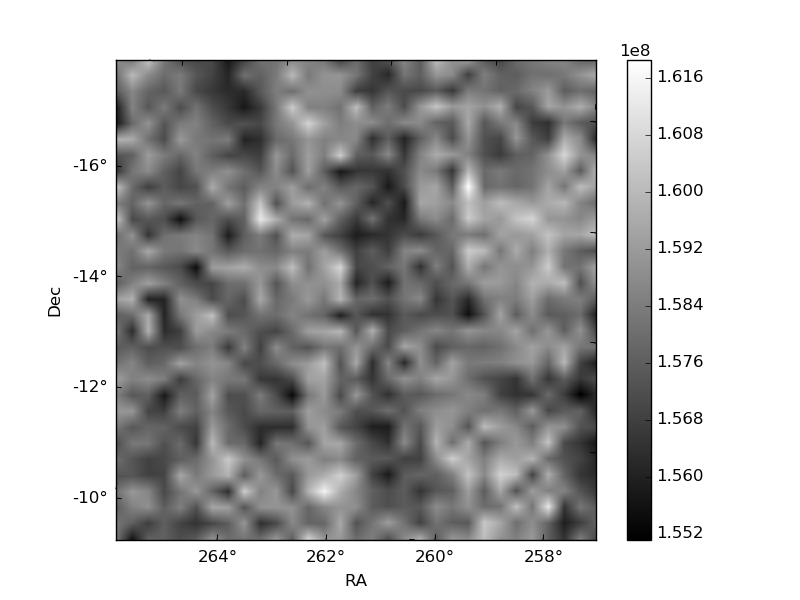
Histogram calculated using DETX and DETY for each event in the final _common_clean file
| Quadrant A | 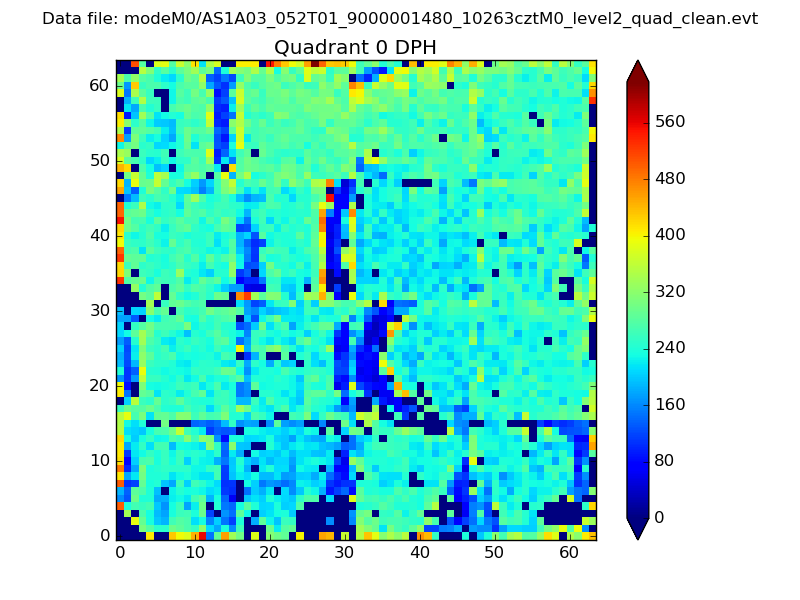 |
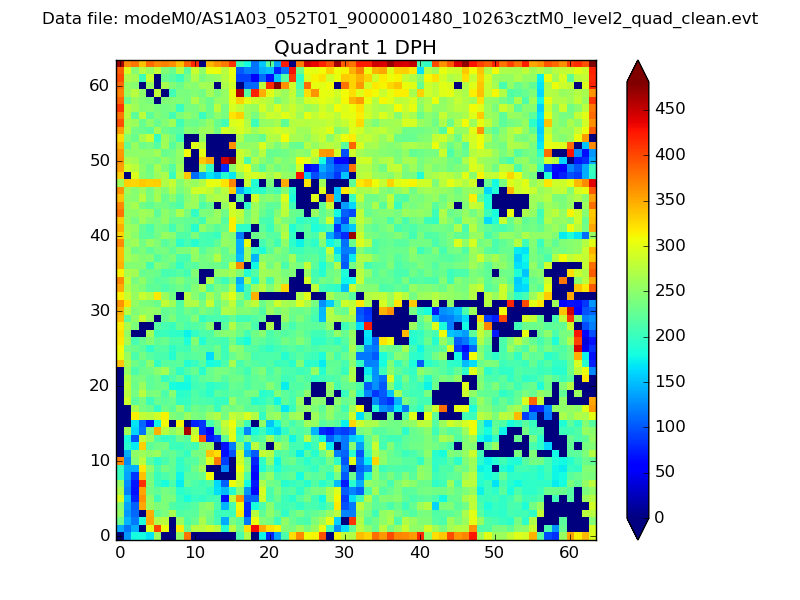 |
Quadrant B |
|---|---|---|---|
| Quadrant D | 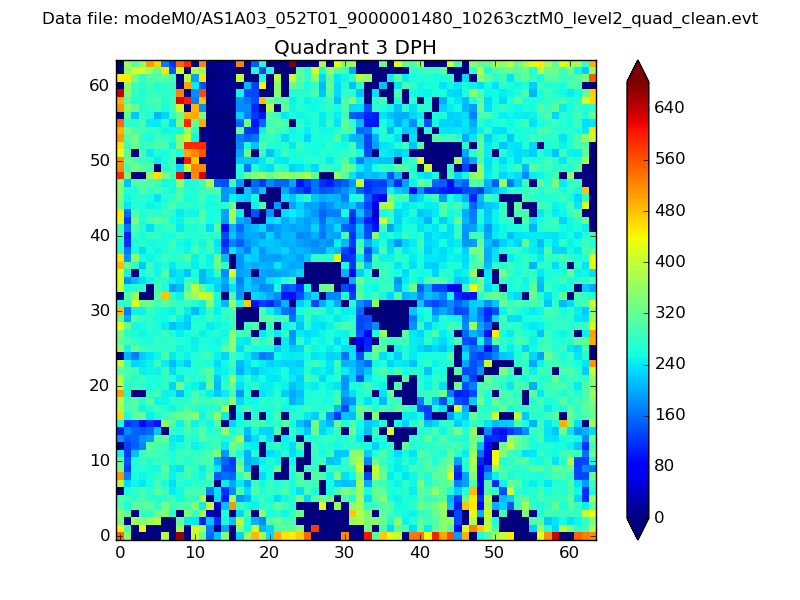 |
 |
Quadrant C |
| Plot type | Count rate plots | Images |
|---|---|---|
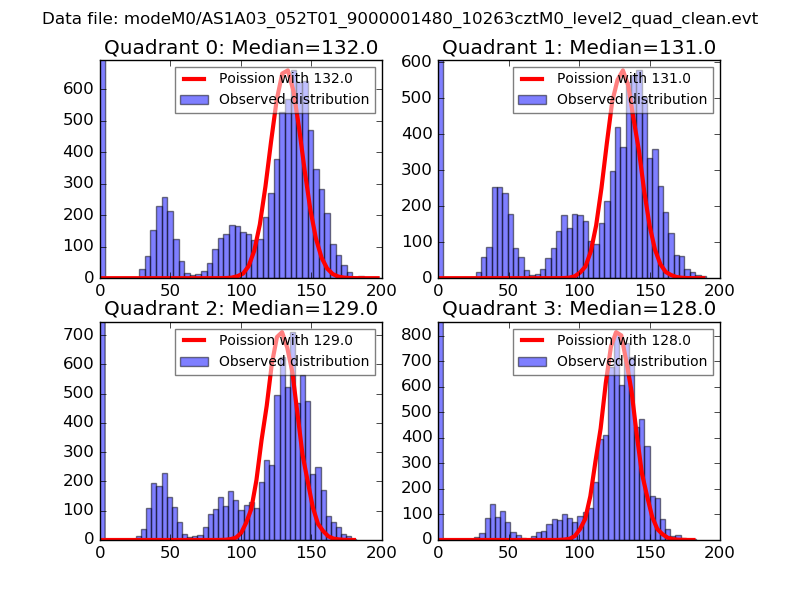
| Comparison with Poisson distribution Blue bars denote a histogram of data divided into 1 sec bins. Red curve is a Poisson curve with rate = median count rate of data. |
 |
 |
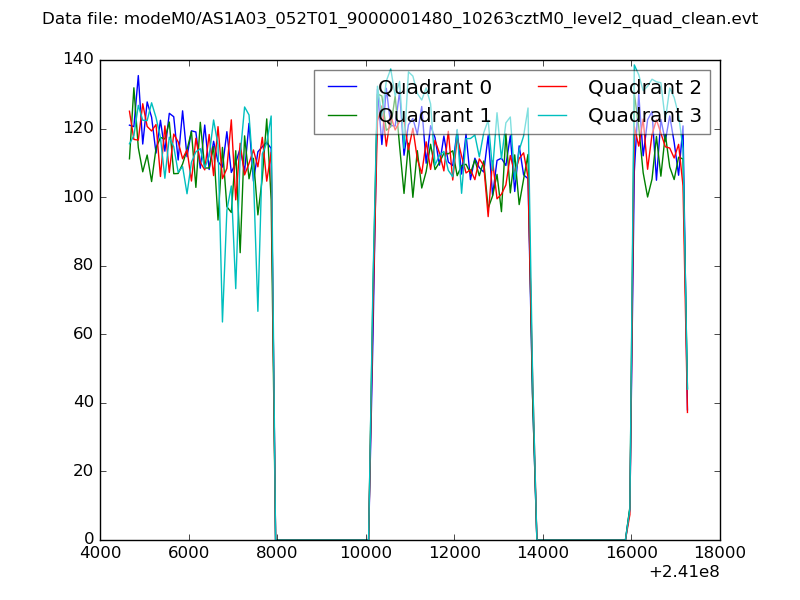
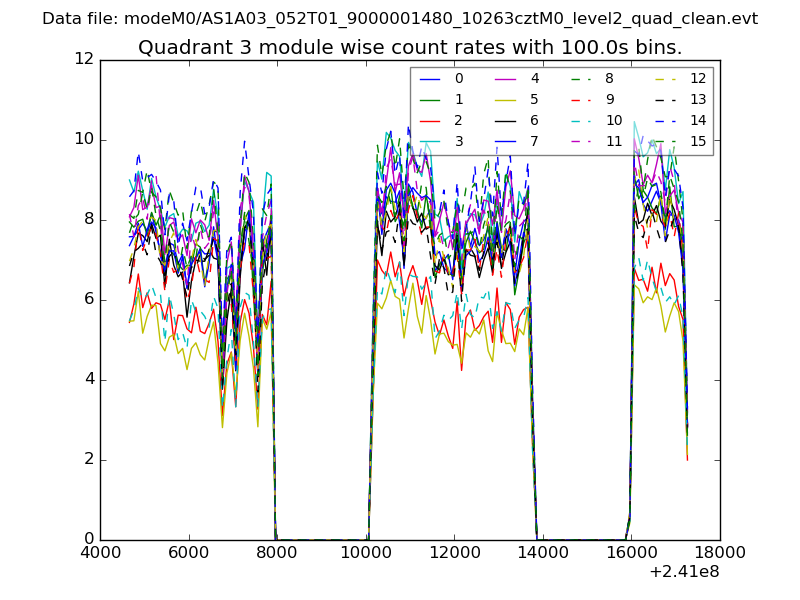
| Quadrant-wise count rates Data is divided into 100 sec bins |
 |
|
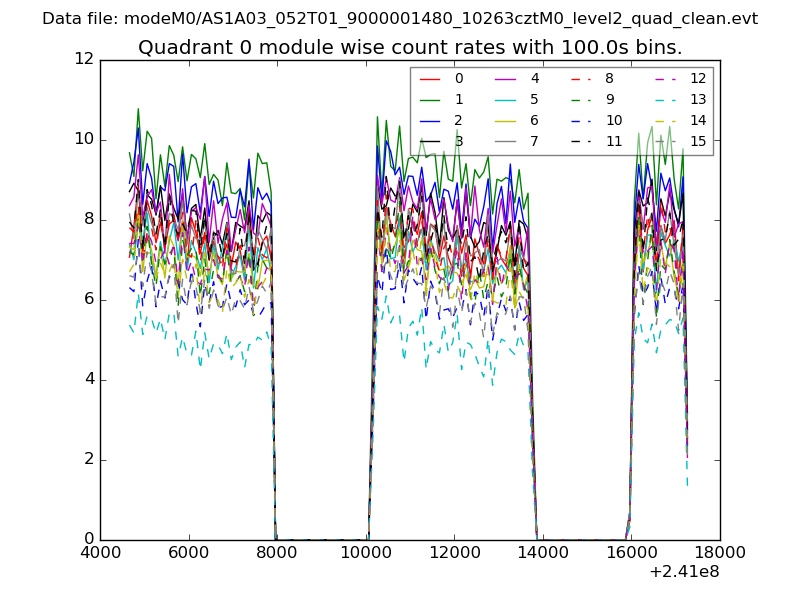
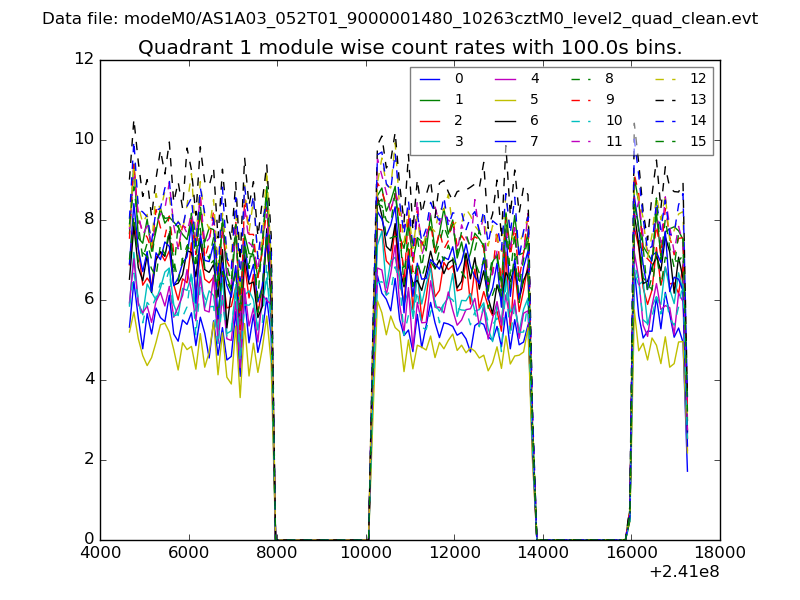
| Module-wise count rates for Quadrant A Data is divided into 100 sec bins |
 |
 |
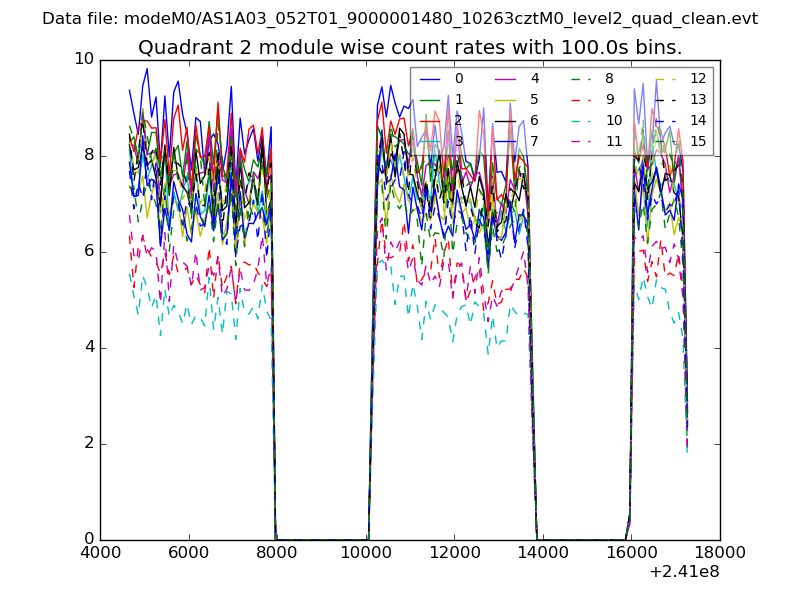
| Module-wise count rates for Quadrant B Data is divided into 100 sec bins |
 |
 |
| Module-wise count rates for Quadrant C Data is divided into 100 sec bins |
 |
 |
| Module-wise count rates for Quadrant D Data is divided into 100 sec bins |
 |
 |
| Parameter | Plot |
|---|---|
| CZT HV Monitor | 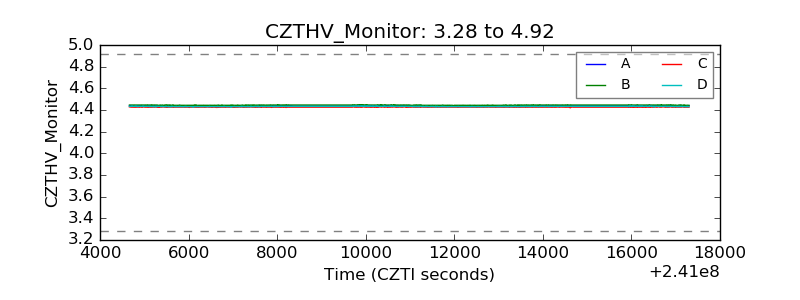 |
| D_VDD | 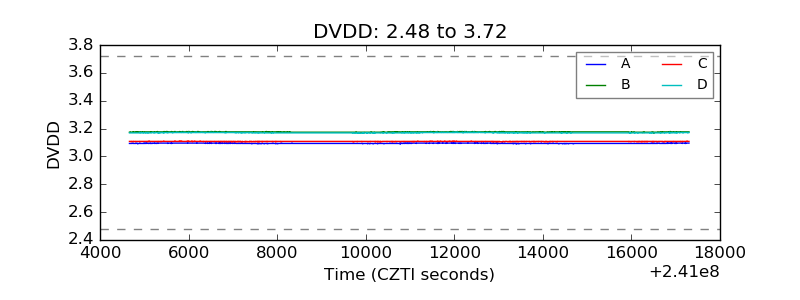 |
| Temperature 1 | 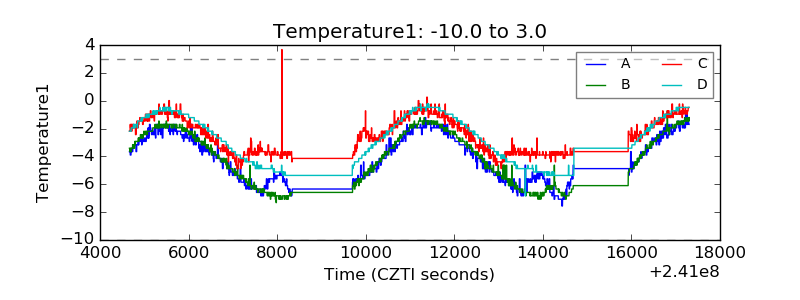 |
| Veto HV Monitor | 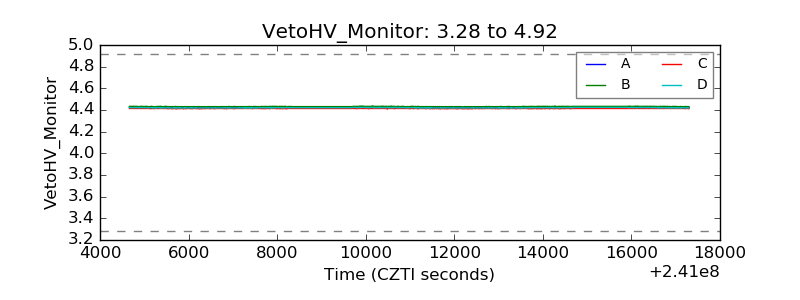 |
| Veto LLD | 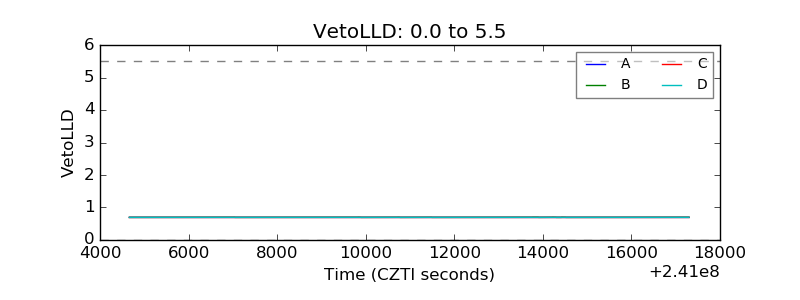 |
| Alpha Counter | 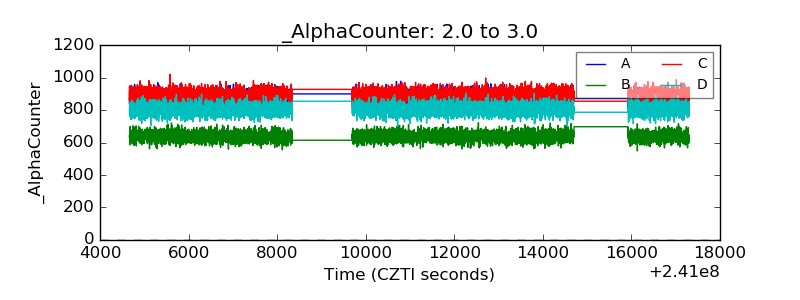 |
| _CPM_Rate | 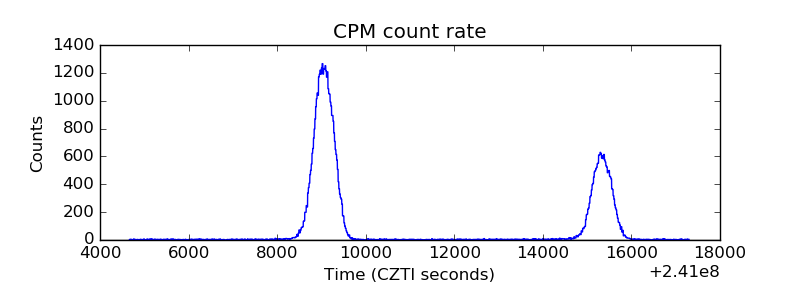 |
| CZT Counter | 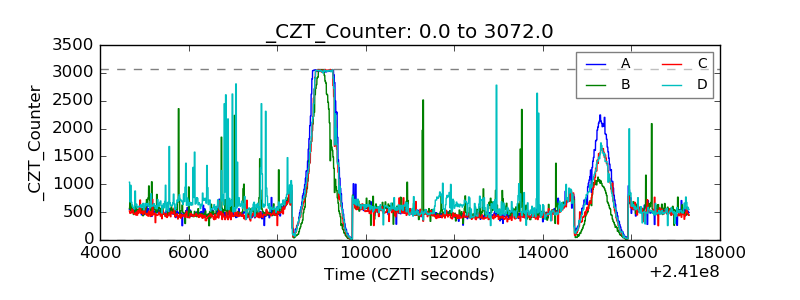 |
| +2.5 Volts monitor |  |
| +5 Volts monitor |  |
| _ROLL_ROT | 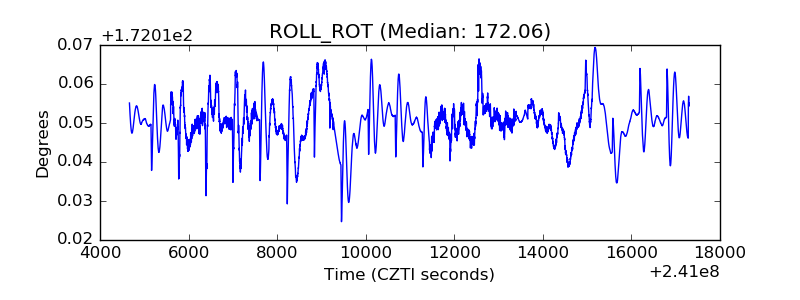 |
| _Roll_DEC | 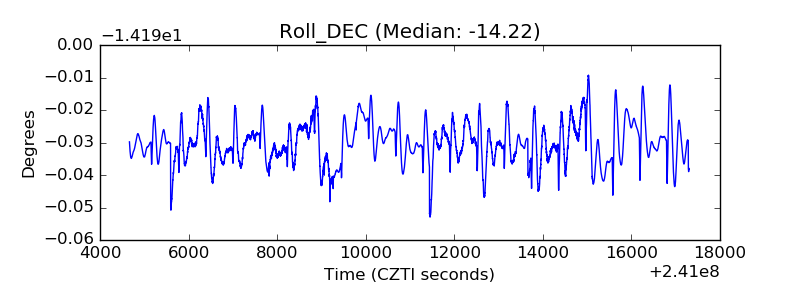 |
| _Roll_RA | 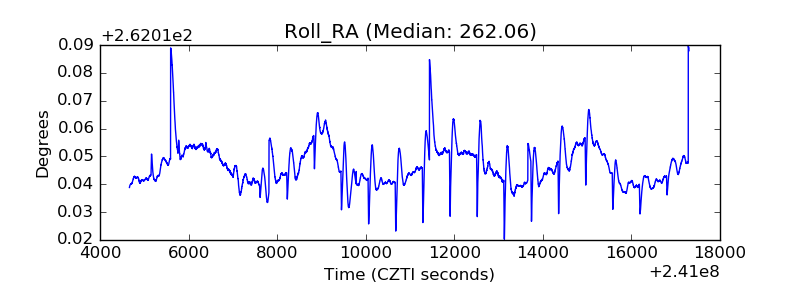 |
| Veto Counter | 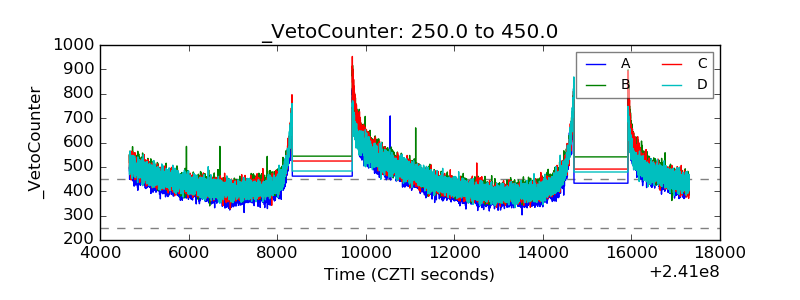 |