| Param | Original file | Final file |
|---|---|---|
| Filename | modeM0/AS1A03_052T01_9000001480_10264cztM0_level2.evt | modeM0/AS1A03_052T01_9000001480_10264cztM0_level2_quad_clean.evt |
| Size (bytes) | 469,990,080 | 103,806,720 |
| Size | 448.2 MB | 99.0 MB |
| Events in quadrant A | 3,254,315 | 684,310 |
| Events in quadrant B | 3,655,160 | 685,667 |
| Events in quadrant C | 3,087,542 | 666,535 |
| Events in quadrant D | 3,779,960 | 639,052 |
| Mode SS | |||
|---|---|---|---|
| Quadrant | BADHDUFLAG | Total packets | Discarded packets |
| A | 0 | 138 | 0 |
| B | 0 | 138 | 0 |
| C | 0 | 138 | 0 |
| D | 0 | 138 | 0 |
| Mode M0 | |||
|---|---|---|---|
| Quadrant | BADHDUFLAG | Total packets | Discarded packets |
| A | 0 | 13928 | 2 |
| B | 0 | 15035 | 1 |
| C | 0 | 13774 | 1 |
| D | 0 | 15408 | 1 |
| Mode M9 | |||
|---|---|---|---|
| Quadrant | BADHDUFLAG | Total packets | Discarded packets |
| A | 0 | 9 | 0 |
| B | 0 | 9 | 0 |
| C | 0 | 9 | 0 |
| D | 0 | 9 | 0 |
| Quadrant | Total seconds | Saturated seconds | Saturation percentage |
|---|---|---|---|
| A | 6712 | 117 | 1.743147% |
| B | 6712 | 136 | 2.026222% |
| C | 6712 | 73 | 1.087604% |
| D | 6712 | 154 | 2.294398% |
Noise dominated data is calculated using 1-second bins in cleaned event files. If a bin has >2000 counts, and if more than 50% of those come from <1% of pixels, then it is considered to be noise-dominated and hence unusable.
| Quadrant | # 1 sec bins | Bins with >0 counts | Bins with >2000 counts | High rate bins dominated by noise | Noise dominated (total time) | Noise dominated (detector-on time) | Marked lightcurve |
|---|---|---|---|---|---|---|---|
| A | 7677 | 6712 | 1 | 1 | 0.01% | 0.01% | 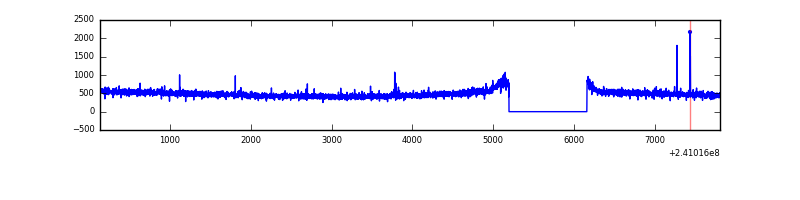 |
| B | 7677 | 6712 | 17 | 17 | 0.22% | 0.25% | 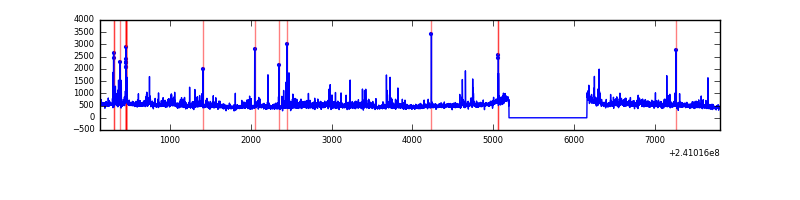 |
| C | 7677 | 6713 | 0 | 0 | 0.00% | 0.00% | 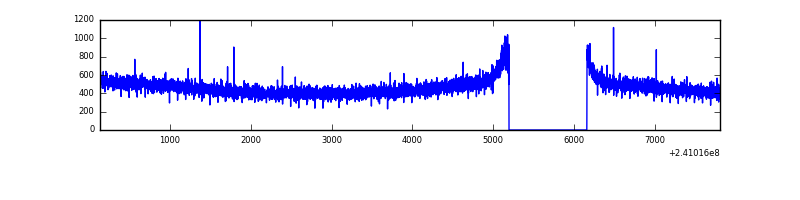 |
| D | 7677 | 6712 | 52 | 52 | 0.68% | 0.77% | 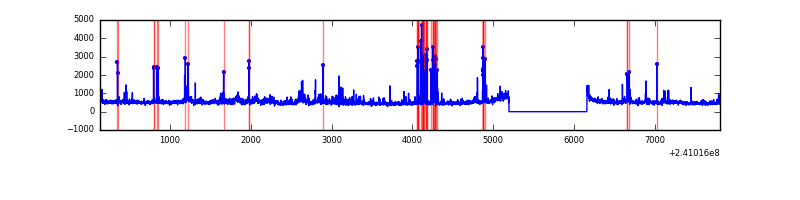 |
Top three noisy pixels from each quadrant. If the there are fewer than three noisy pixels in the level2.evt file, extra rows are filled as -1
| Pixel properties | Quadrant properties | ||||||
|---|---|---|---|---|---|---|---|
| Quadrant | DetID | PixID | Counts | Sigma | Mean | Median | Sigma |
| A | 8 | 15 | 34672 | 200.19 | 830 | 813 | 169.1 |
| A | 8 | 5 | 13017 | 72.15 | 830 | 813 | 169.1 |
| A | 15 | 174 | 8128 | 43.25 | 830 | 813 | 169.1 |
| B | 4 | 239 | 133273 | 840.03 | 822 | 804 | 157.7 |
| B | 11 | 51 | 105363 | 663.04 | 822 | 804 | 157.7 |
| B | 0 | 214 | 89946 | 565.28 | 822 | 804 | 157.7 |
| C | 13 | 61 | 6022 | 28.72 | 790 | 793 | 182.1 |
| C | 14 | 67 | 4231 | 18.88 | 790 | 793 | 182.1 |
| C | 8 | 222 | 2729 | 10.63 | 790 | 793 | 182.1 |
| D | 1 | 52 | 192331 | 1011.03 | 794 | 773 | 189.5 |
| D | 2 | 16 | 167963 | 882.42 | 794 | 773 | 189.5 |
| D | 12 | 233 | 155922 | 818.87 | 794 | 773 | 189.5 |
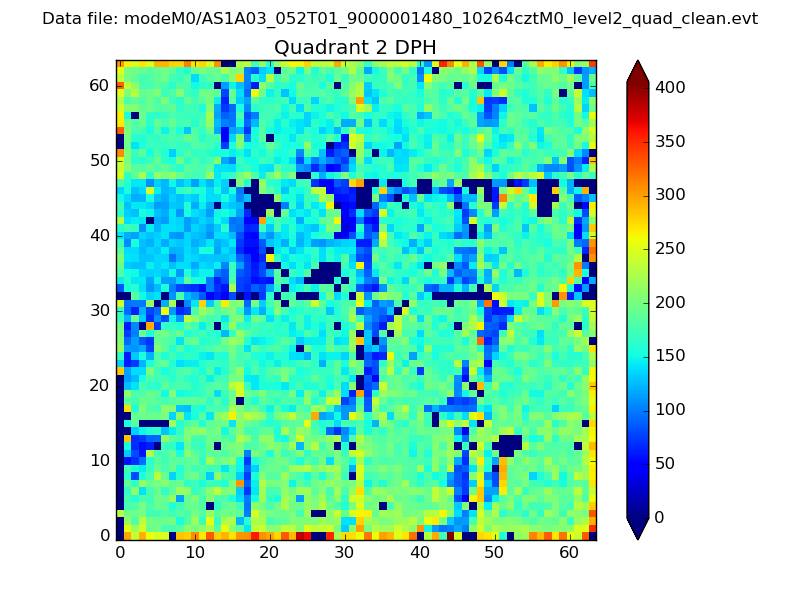
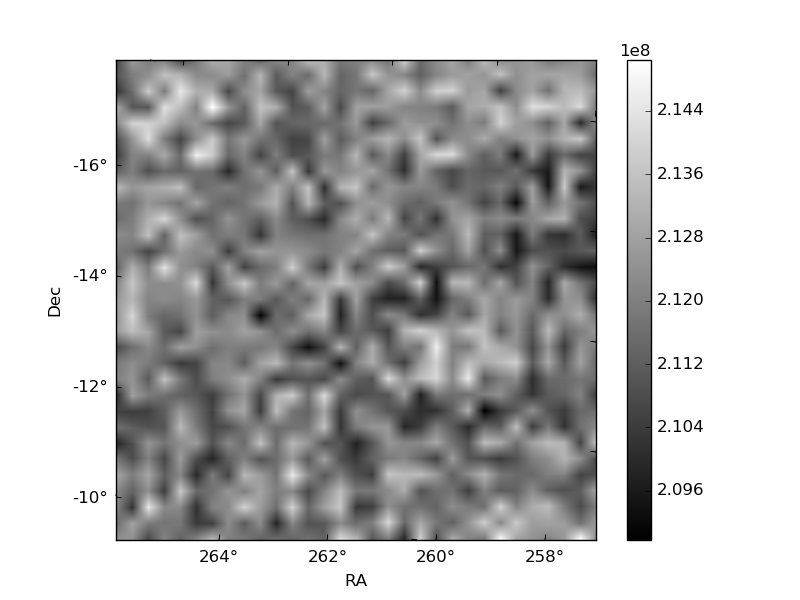
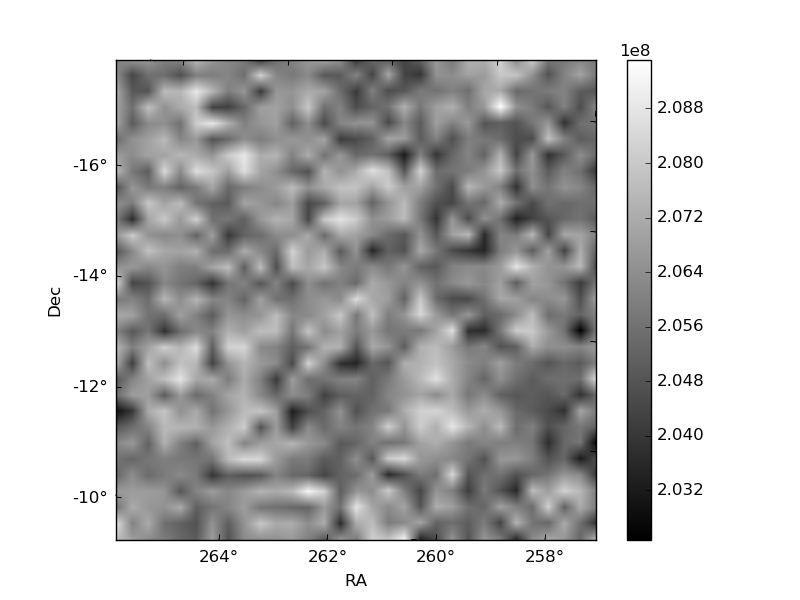
Histogram calculated using DETX and DETY for each event in the final _common_clean file
| Quadrant A | 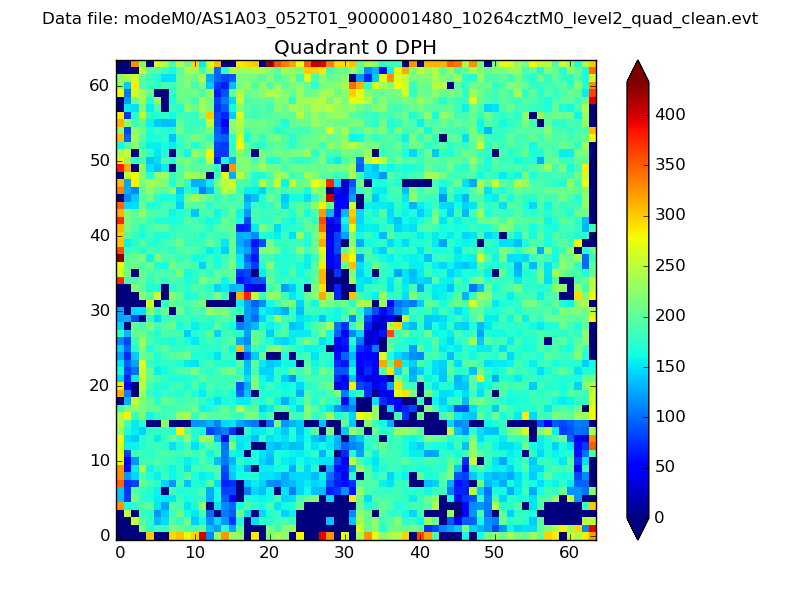 |
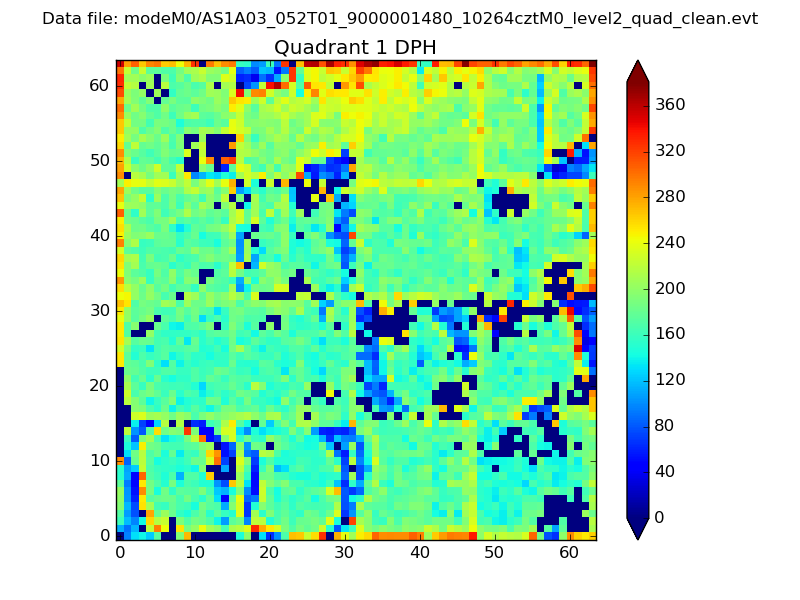 |
Quadrant B |
|---|---|---|---|
| Quadrant D | 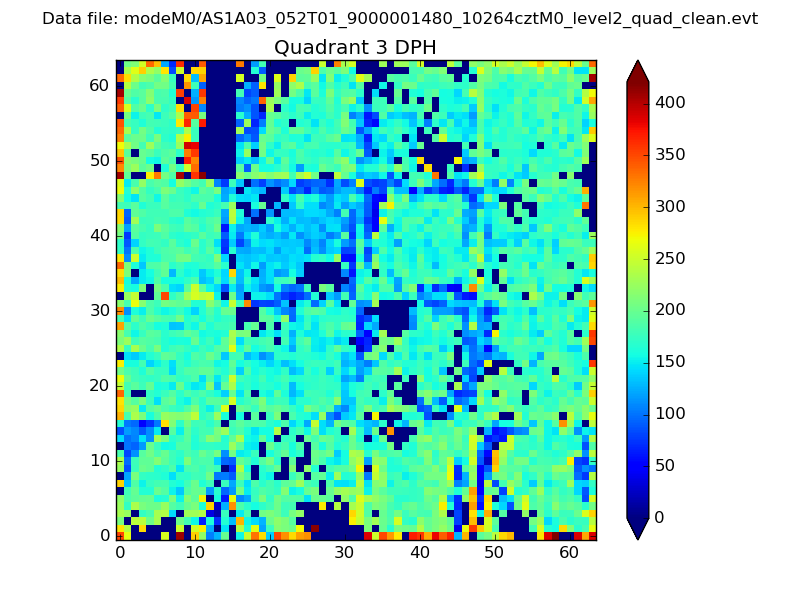 |
 |
Quadrant C |
| Plot type | Count rate plots | Images |
|---|---|---|
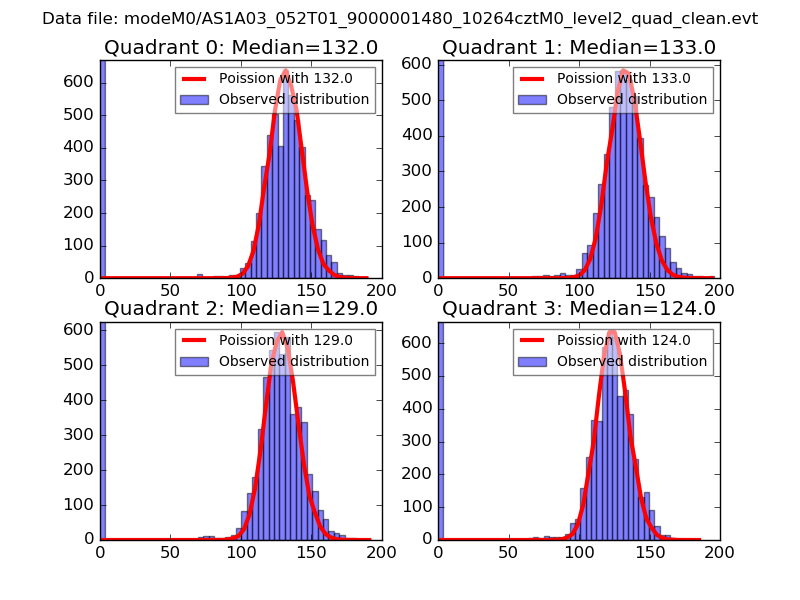
| Comparison with Poisson distribution Blue bars denote a histogram of data divided into 1 sec bins. Red curve is a Poisson curve with rate = median count rate of data. |
 |
 |
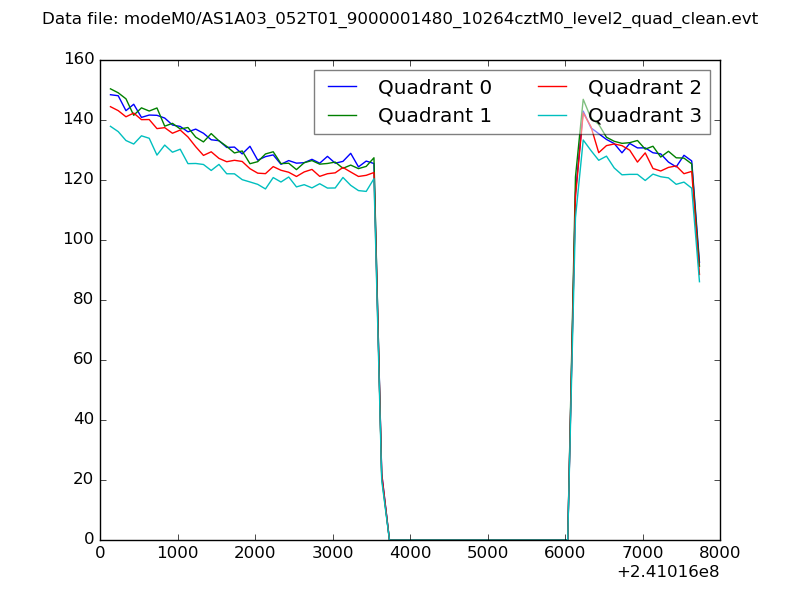
| Quadrant-wise count rates Data is divided into 100 sec bins |
 |
|
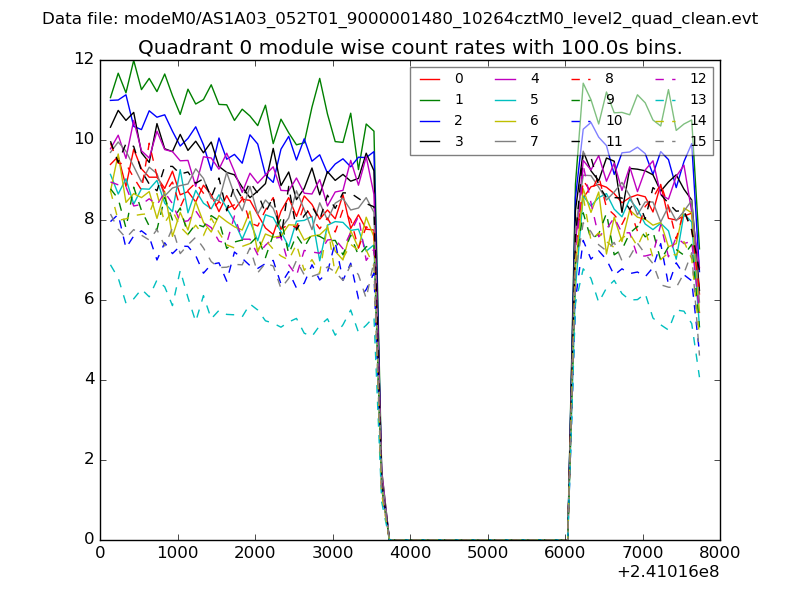
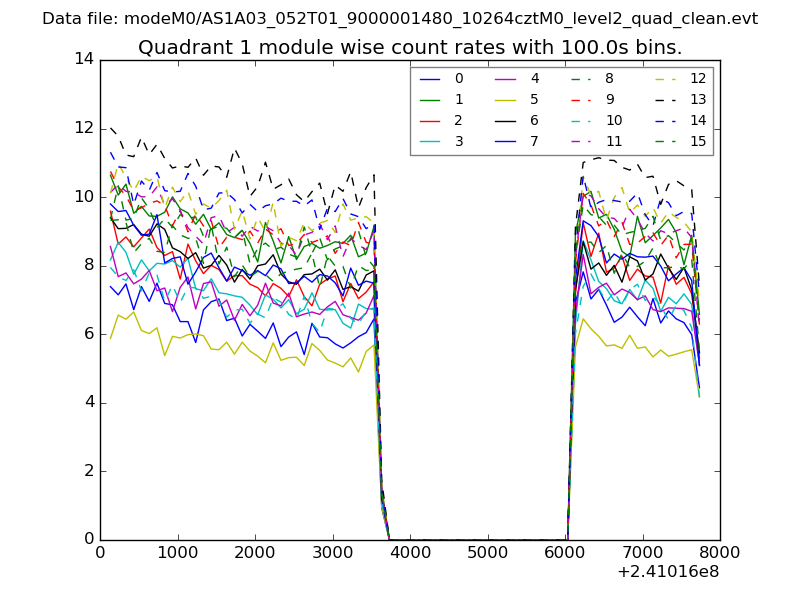
| Module-wise count rates for Quadrant A Data is divided into 100 sec bins |
 |
 |
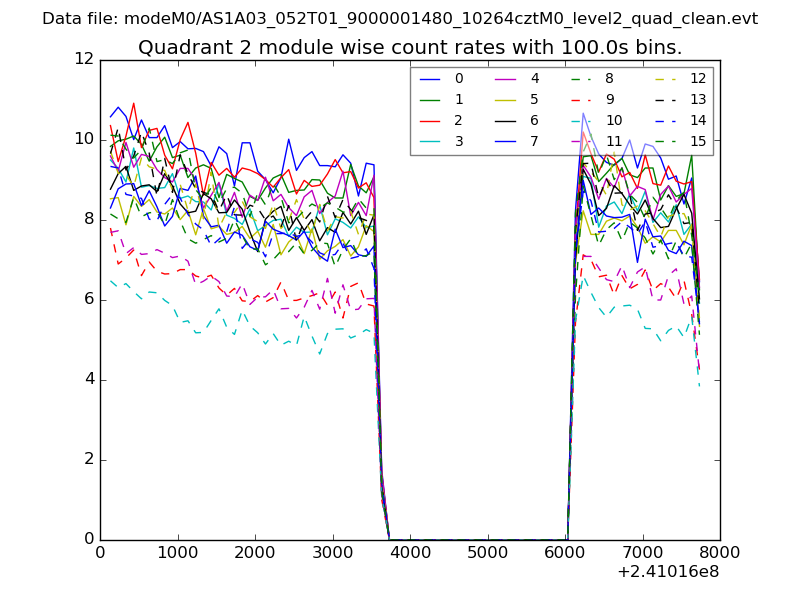
| Module-wise count rates for Quadrant B Data is divided into 100 sec bins |
 |
 |
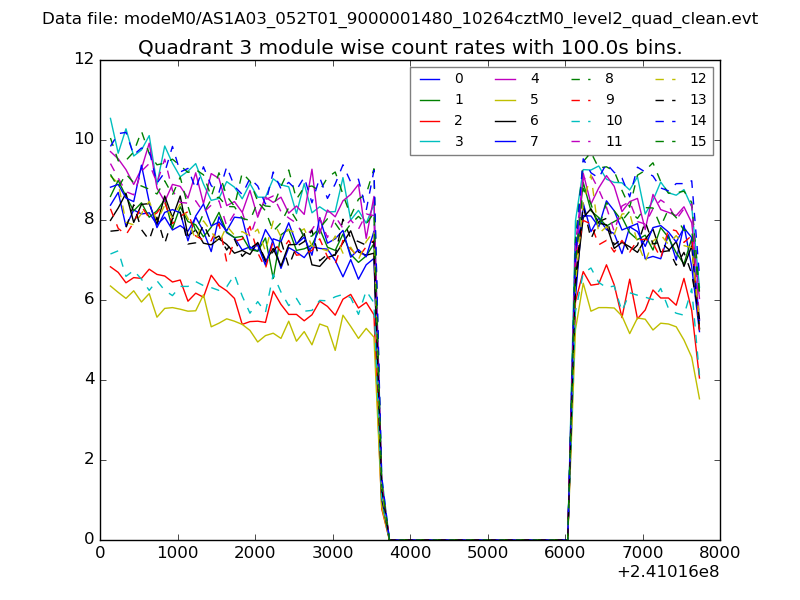
| Module-wise count rates for Quadrant C Data is divided into 100 sec bins |
 |
 |
| Module-wise count rates for Quadrant D Data is divided into 100 sec bins |
 |
 |
| Parameter | Plot |
|---|---|
| CZT HV Monitor |  |
| D_VDD | 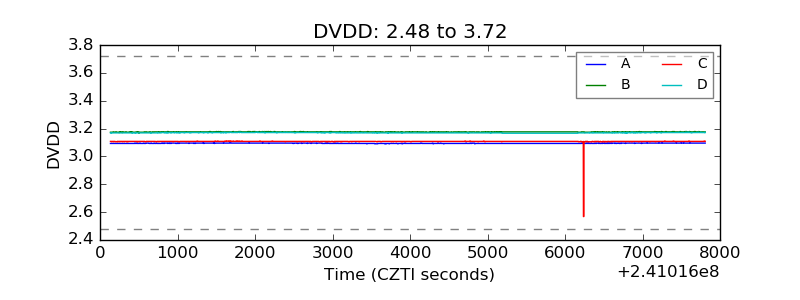 |
| Temperature 1 | 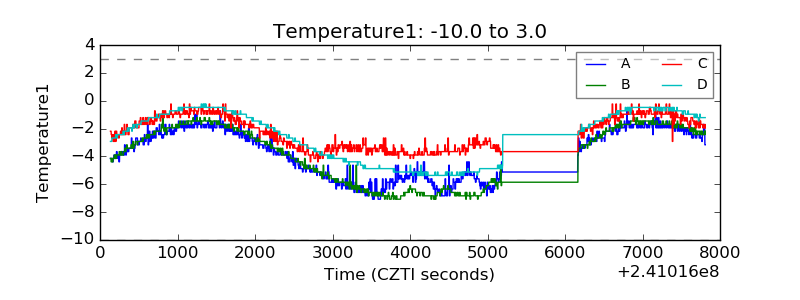 |
| Veto HV Monitor | 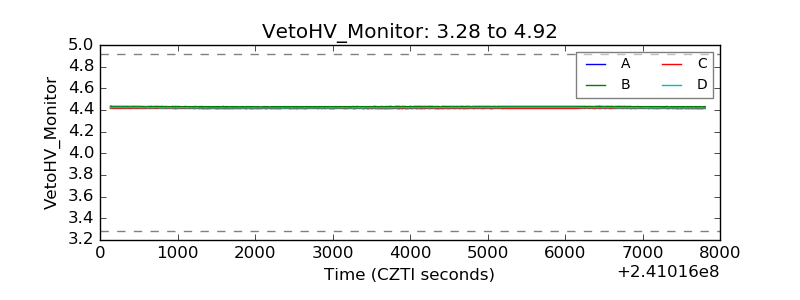 |
| Veto LLD | 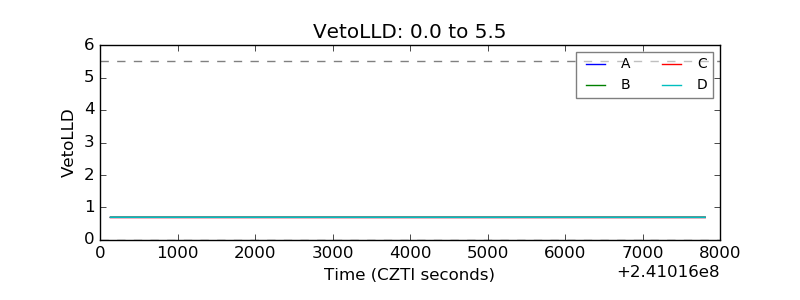 |
| Alpha Counter | 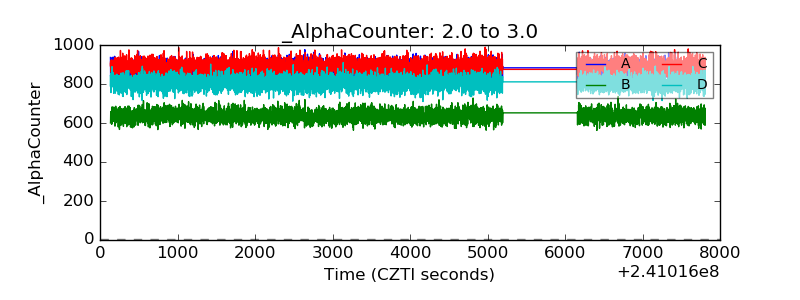 |
| _CPM_Rate | 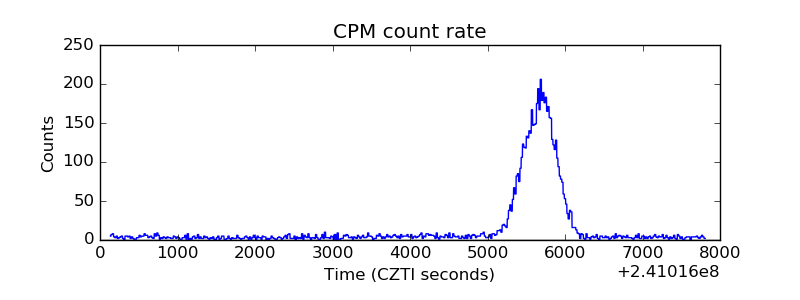 |
| CZT Counter | 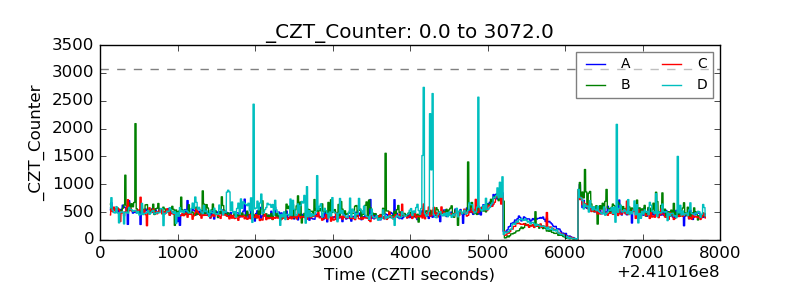 |
| +2.5 Volts monitor |  |
| +5 Volts monitor |  |
| _ROLL_ROT | 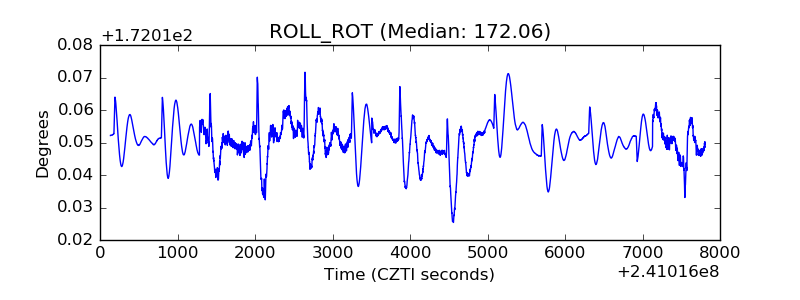 |
| _Roll_DEC | 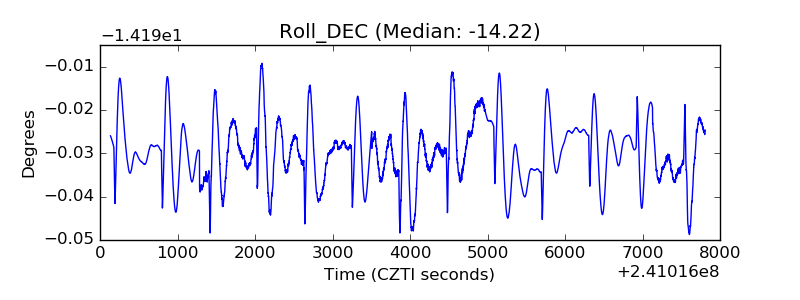 |
| _Roll_RA | 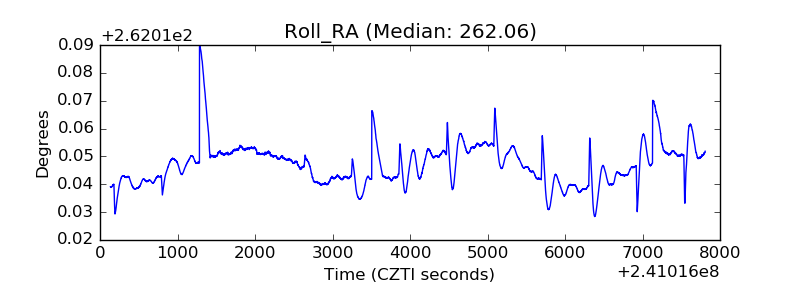 |
| Veto Counter | 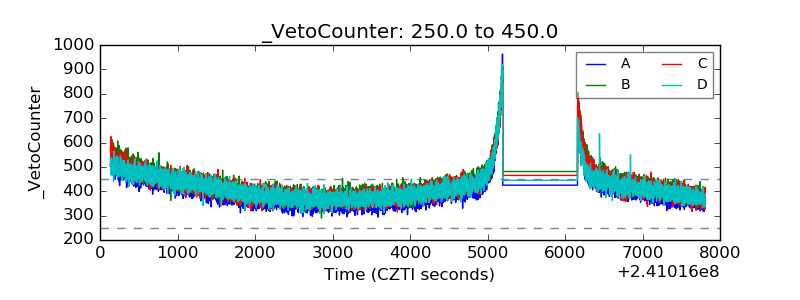 |