| Param | Original file | Final file |
|---|---|---|
| Filename | modeM0/AS1A03_052T01_9000001480_10268cztM0_level2.evt | modeM0/AS1A03_052T01_9000001480_10268cztM0_level2_quad_clean.evt |
| Size (bytes) | 526,224,960 | 99,895,680 |
| Size | 501.8 MB | 95.3 MB |
| Events in quadrant A | 3,630,708 | 639,925 |
| Events in quadrant B | 3,815,392 | 645,999 |
| Events in quadrant C | 3,340,670 | 630,322 |
| Events in quadrant D | 4,651,484 | 597,701 |
| Mode SS | |||
|---|---|---|---|
| Quadrant | BADHDUFLAG | Total packets | Discarded packets |
| A | 0 | 150 | 2 |
| B | 0 | 150 | 0 |
| C | 0 | 150 | 0 |
| D | 0 | 150 | 0 |
| Mode M0 | |||
|---|---|---|---|
| Quadrant | BADHDUFLAG | Total packets | Discarded packets |
| A | 0 | 15480 | 27 |
| B | 0 | 16141 | 20 |
| C | 0 | 15187 | 20 |
| D | 0 | 18953 | 38 |
| Mode M9 | |||
|---|---|---|---|
| Quadrant | BADHDUFLAG | Total packets | Discarded packets |
| A | 0 | 4 | 0 |
| B | 0 | 4 | 0 |
| C | 0 | 4 | 0 |
| D | 0 | 5 | 0 |
| Quadrant | Total seconds | Saturated seconds | Saturation percentage |
|---|---|---|---|
| A | 7342 | 45 | 0.612912% |
| B | 7347 | 97 | 1.320267% |
| C | 7346 | 21 | 0.285870% |
| D | 7340 | 144 | 1.961853% |
Noise dominated data is calculated using 1-second bins in cleaned event files. If a bin has >2000 counts, and if more than 50% of those come from <1% of pixels, then it is considered to be noise-dominated and hence unusable.
| Quadrant | # 1 sec bins | Bins with >0 counts | Bins with >2000 counts | High rate bins dominated by noise | Noise dominated (total time) | Noise dominated (detector-on time) | Marked lightcurve |
|---|---|---|---|---|---|---|---|
| A | 7564 | 7355 | 1 | 1 | 0.01% | 0.01% |  |
| B | 7564 | 7355 | 23 | 23 | 0.30% | 0.31% | 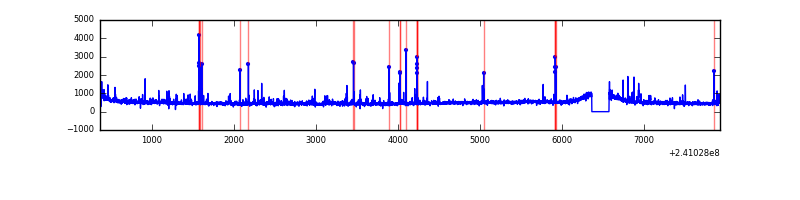 |
| C | 7564 | 7355 | 0 | 0 | 0.00% | 0.00% | 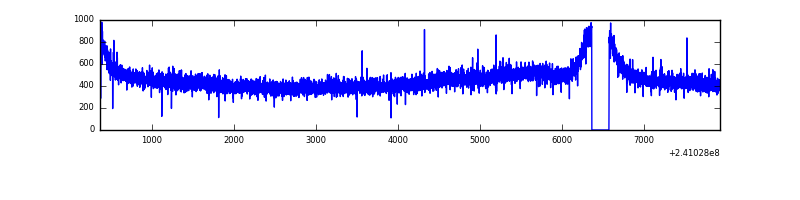 |
| D | 7564 | 7355 | 110 | 110 | 1.45% | 1.50% | 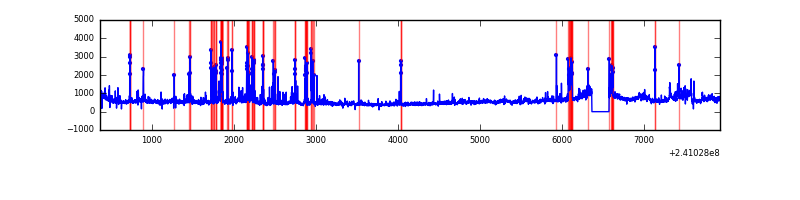 |
Top three noisy pixels from each quadrant. If the there are fewer than three noisy pixels in the level2.evt file, extra rows are filled as -1
| Pixel properties | Quadrant properties | ||||||
|---|---|---|---|---|---|---|---|
| Quadrant | DetID | PixID | Counts | Sigma | Mean | Median | Sigma |
| A | 8 | 15 | 169252 | 921.05 | 891 | 872 | 182.8 |
| A | 3 | 1 | 14718 | 75.74 | 891 | 872 | 182.8 |
| A | 8 | 5 | 10773 | 54.16 | 891 | 872 | 182.8 |
| B | 4 | 239 | 166388 | 962.07 | 889 | 868 | 172.0 |
| B | 11 | 51 | 73014 | 419.34 | 889 | 868 | 172.0 |
| B | 0 | 214 | 46457 | 264.98 | 889 | 868 | 172.0 |
| C | 13 | 61 | 6472 | 28.09 | 856 | 859 | 199.8 |
| C | 14 | 67 | 3537 | 13.4 | 856 | 859 | 199.8 |
| C | 3 | 202 | 2210 | 6.76 | 856 | 859 | 199.8 |
| D | 8 | 195 | 474432 | 2296.54 | 849 | 825 | 206.2 |
| D | 1 | 52 | 287500 | 1390.1 | 849 | 825 | 206.2 |
| D | 2 | 16 | 249582 | 1206.23 | 849 | 825 | 206.2 |
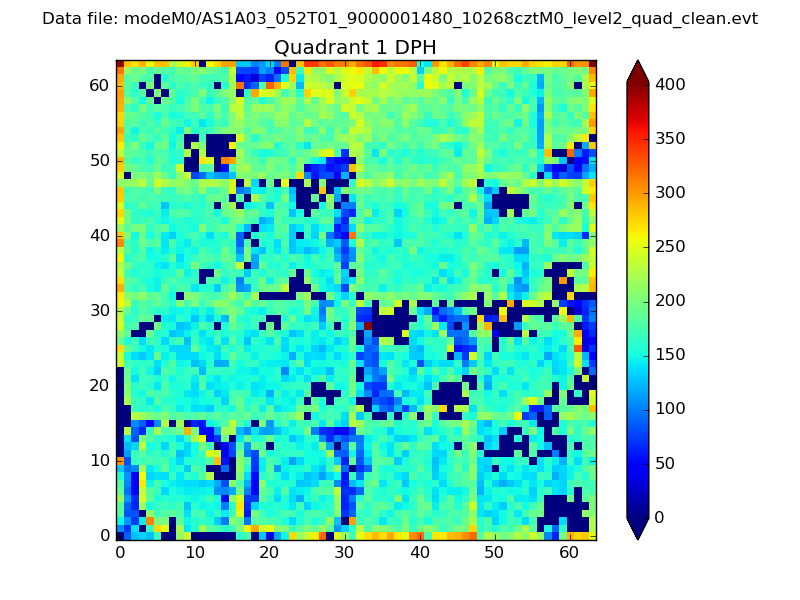
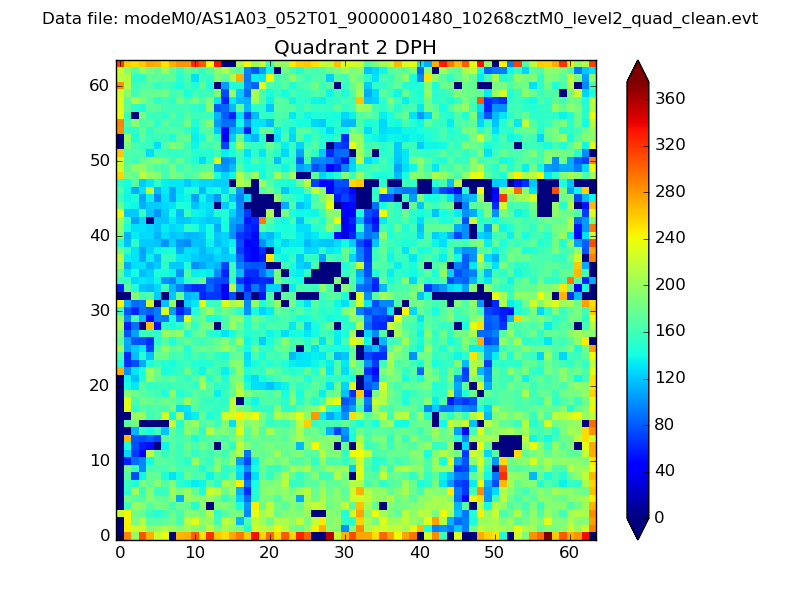
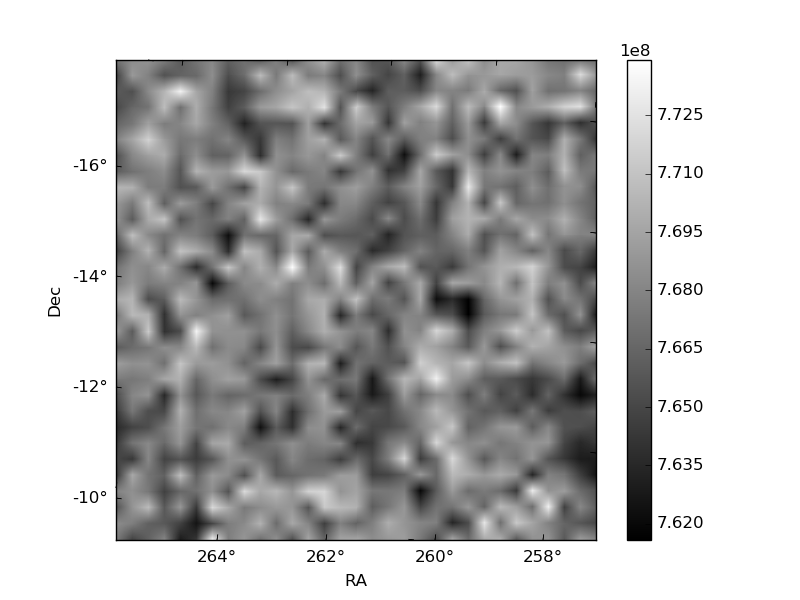
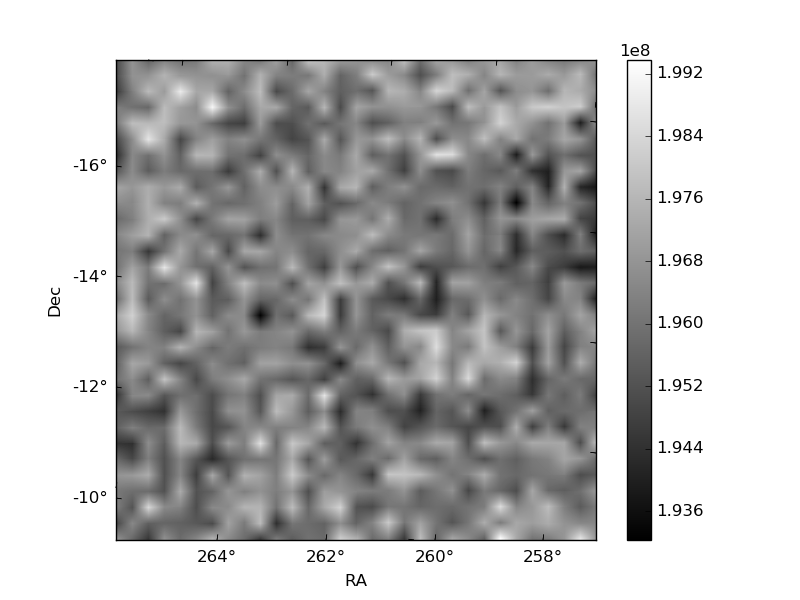
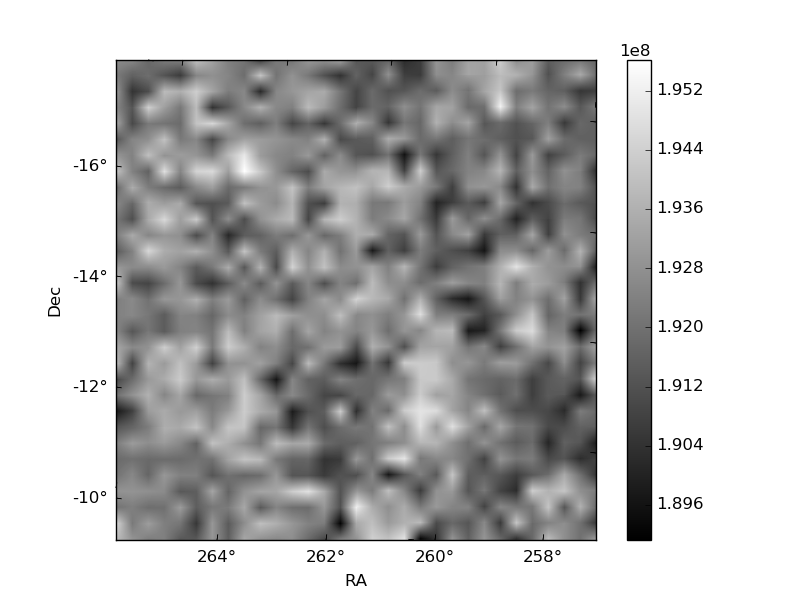
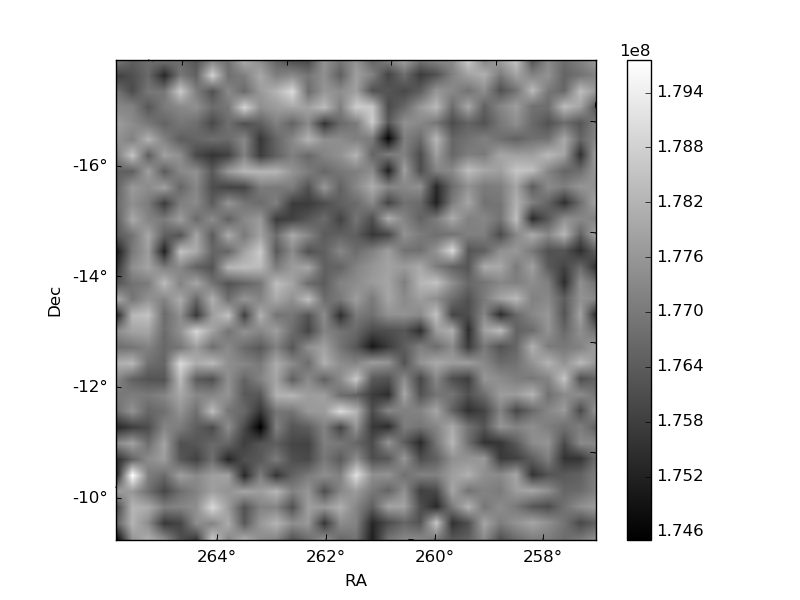
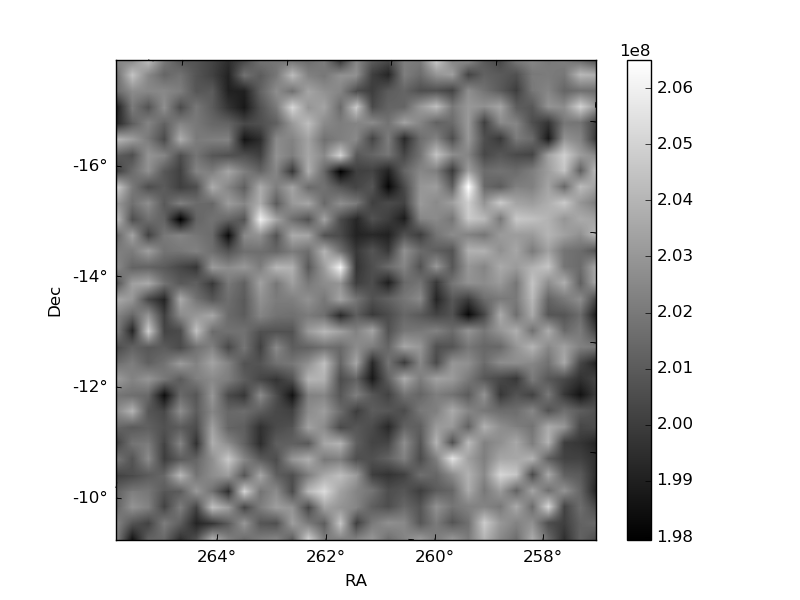
Histogram calculated using DETX and DETY for each event in the final _common_clean file
| Quadrant A | 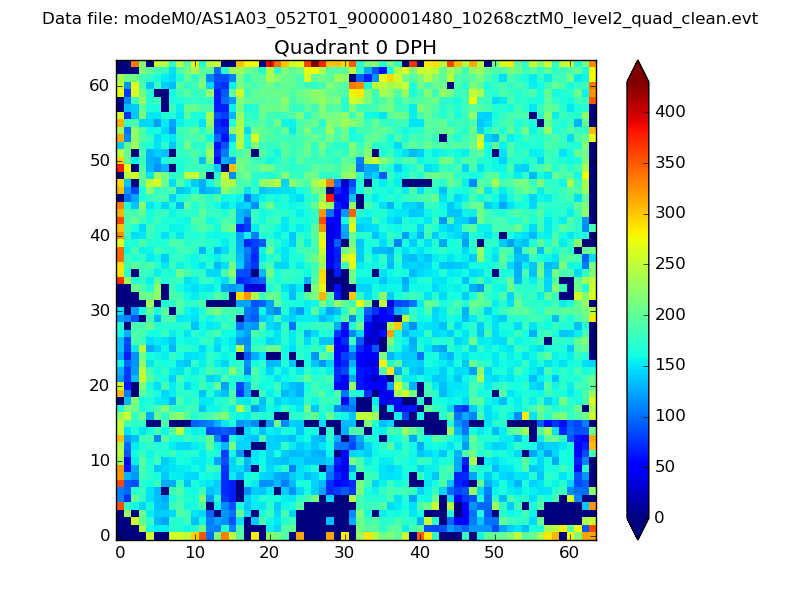 |
 |
Quadrant B |
|---|---|---|---|
| Quadrant D | 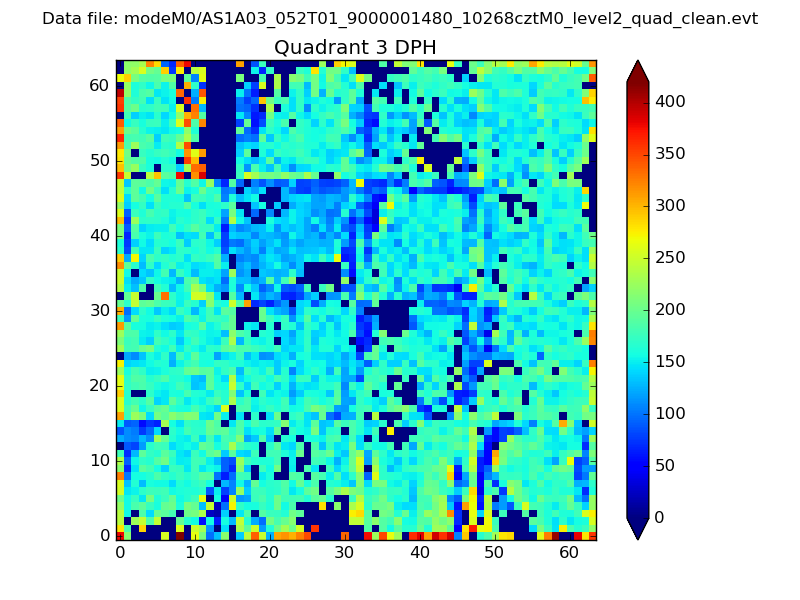 |
 |
Quadrant C |
| Plot type | Count rate plots | Images |
|---|---|---|
| Comparison with Poisson distribution Blue bars denote a histogram of data divided into 1 sec bins. Red curve is a Poisson curve with rate = median count rate of data. |
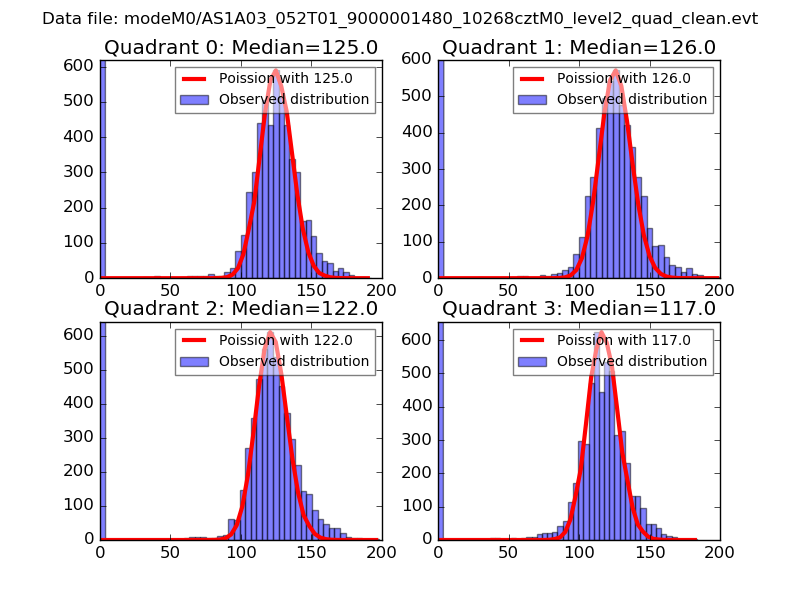 |
 |
| Quadrant-wise count rates Data is divided into 100 sec bins |
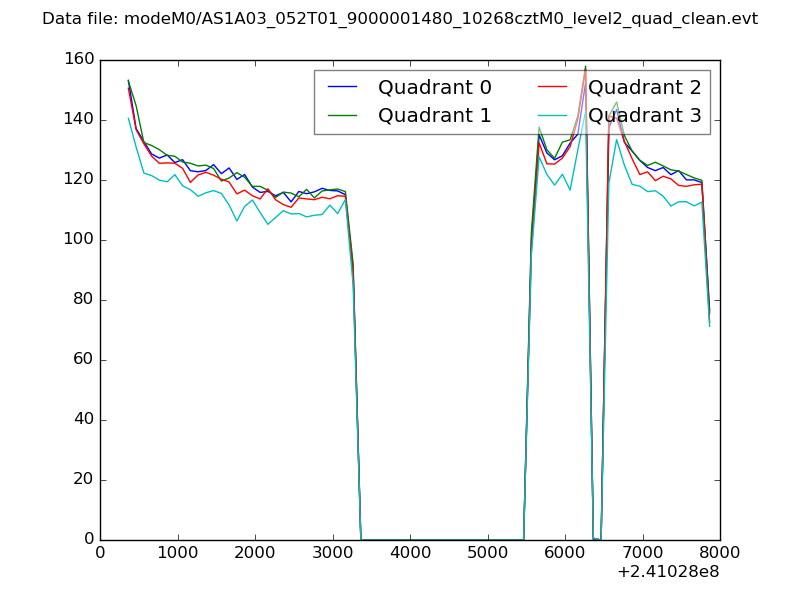 |
|
| Module-wise count rates for Quadrant A Data is divided into 100 sec bins |
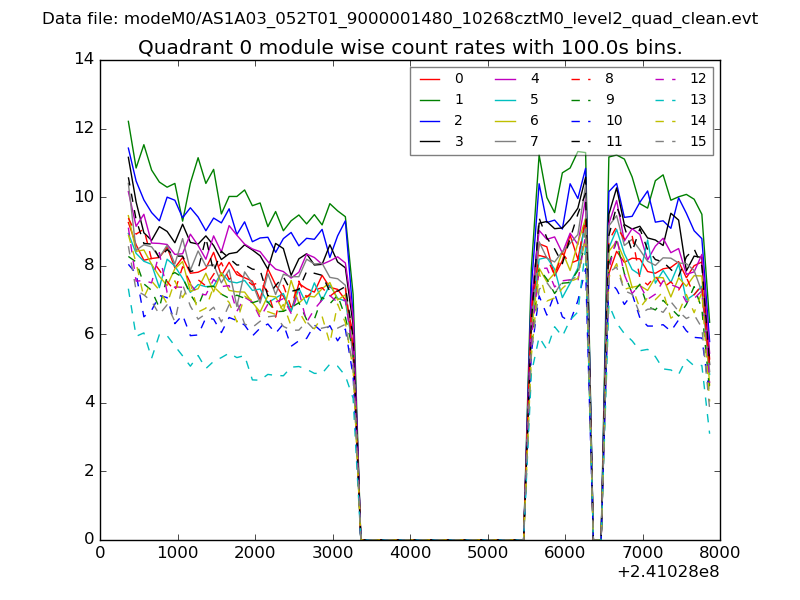 |
 |
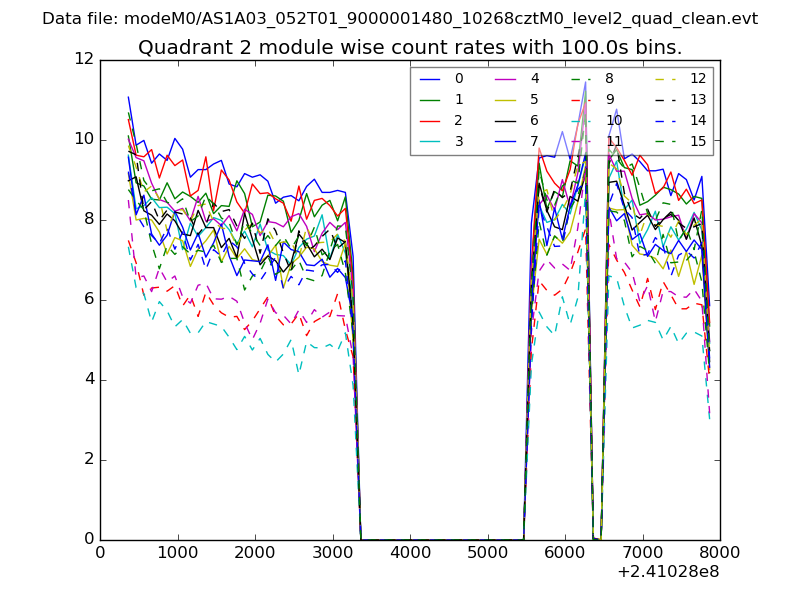
| Module-wise count rates for Quadrant B Data is divided into 100 sec bins |
 |
 |
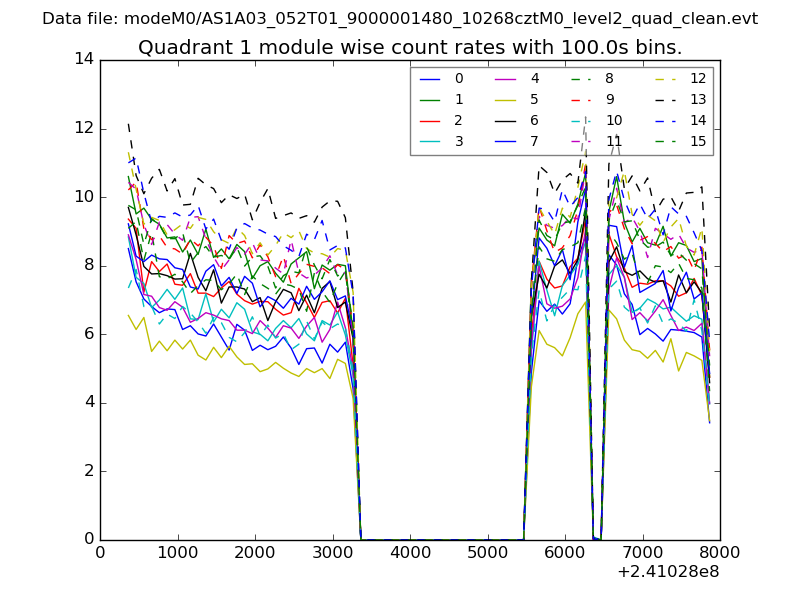
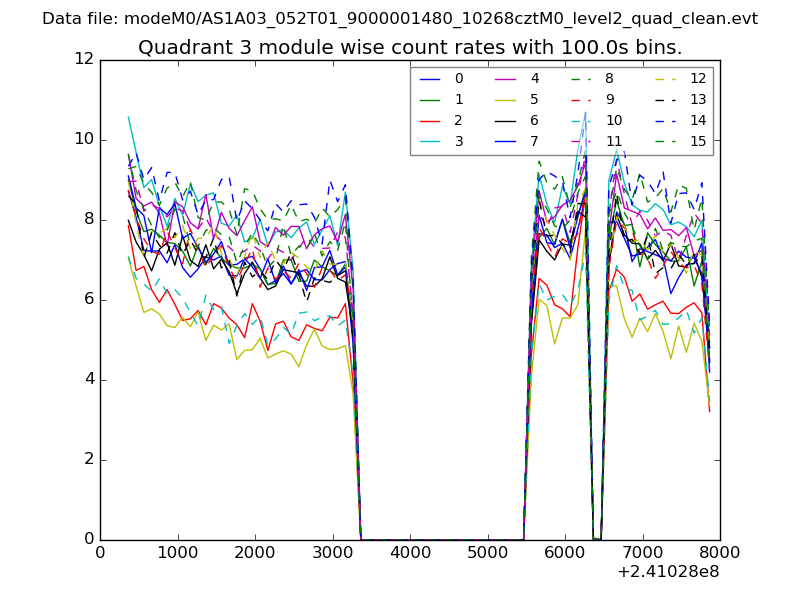
| Module-wise count rates for Quadrant C Data is divided into 100 sec bins |
 |
 |
| Module-wise count rates for Quadrant D Data is divided into 100 sec bins |
 |
 |
| Parameter | Plot |
|---|---|
| CZT HV Monitor | 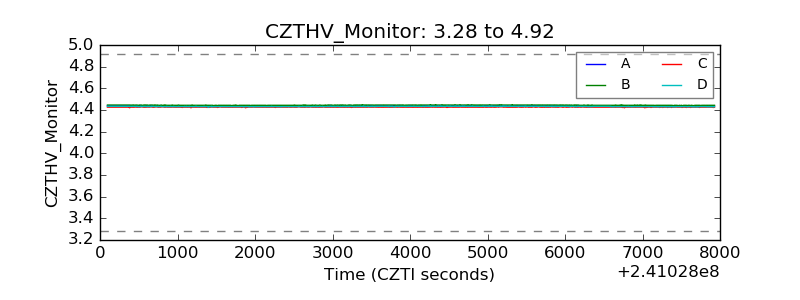 |
| D_VDD | 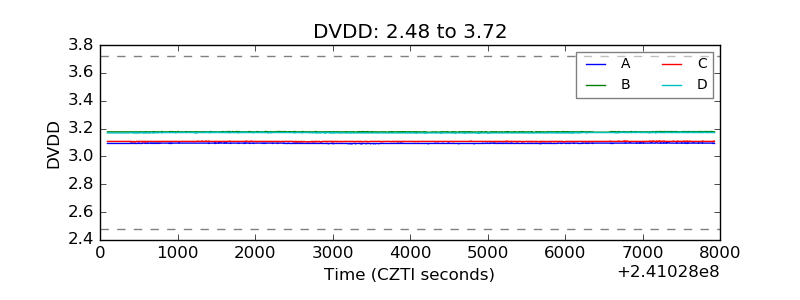 |
| Temperature 1 | 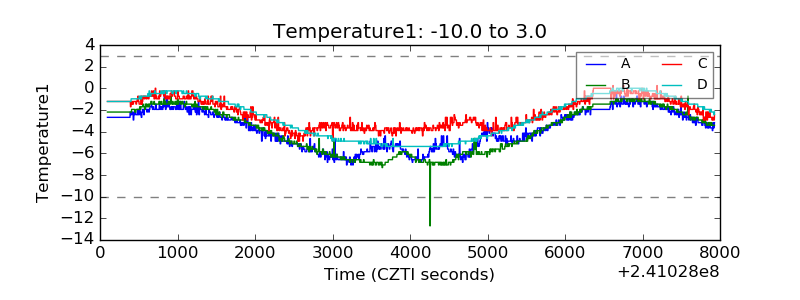 |
| Veto HV Monitor | 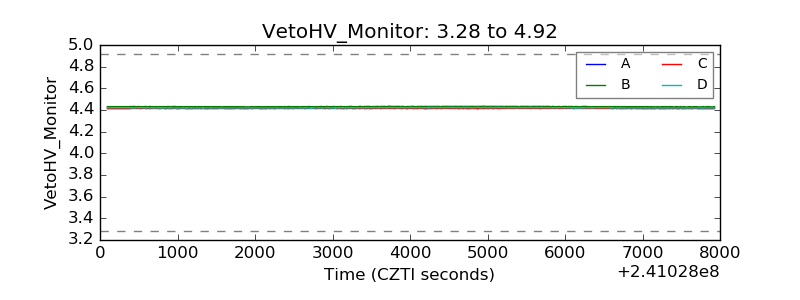 |
| Veto LLD | 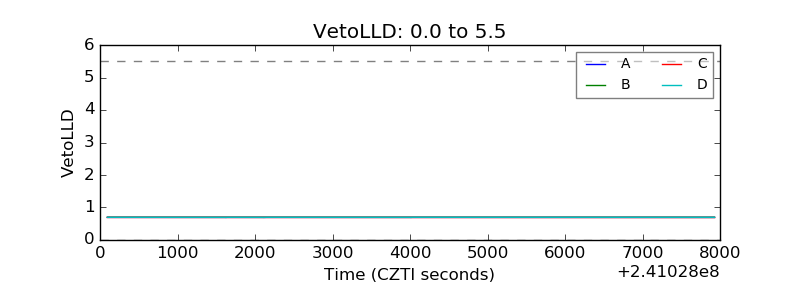 |
| Alpha Counter | 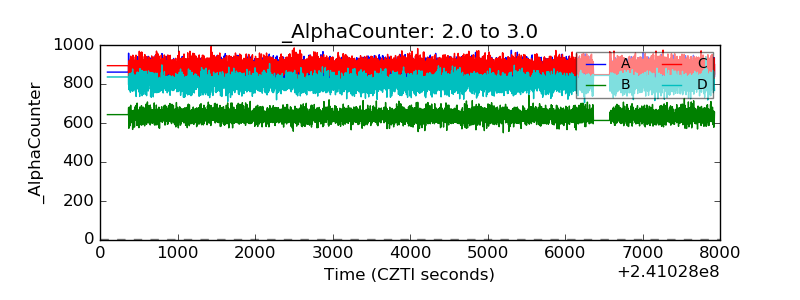 |
| _CPM_Rate | 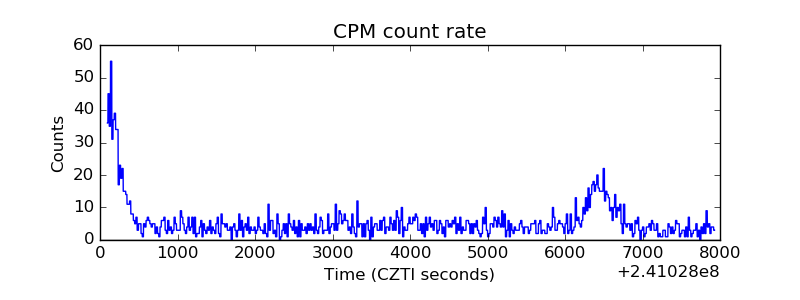 |
| CZT Counter | 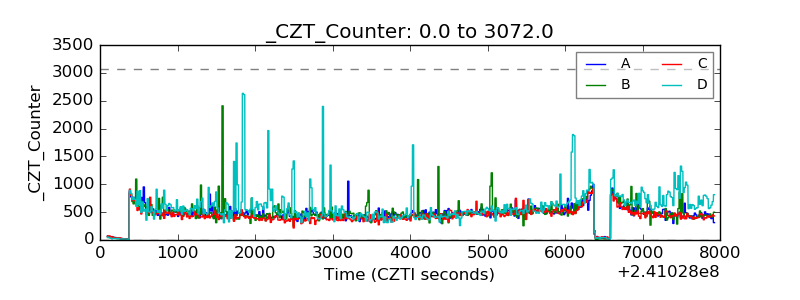 |
| +2.5 Volts monitor |  |
| +5 Volts monitor |  |
| _ROLL_ROT | 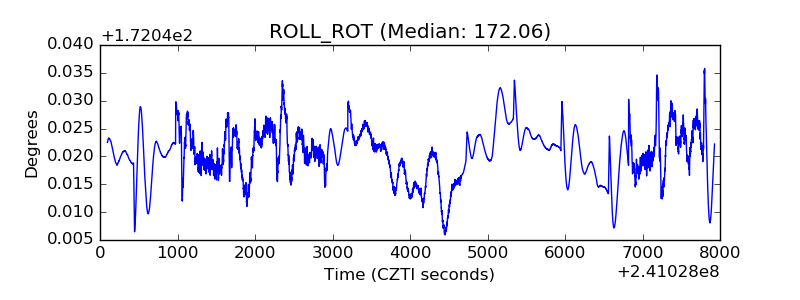 |
| _Roll_DEC | 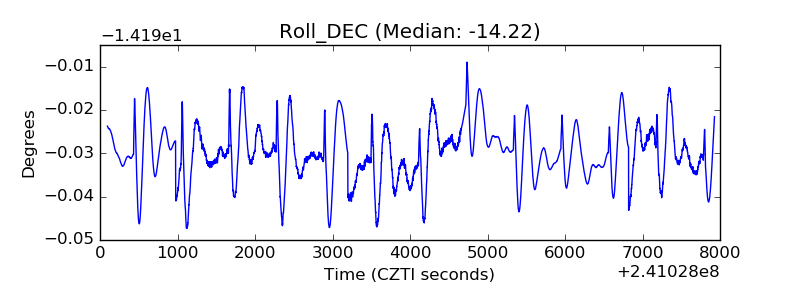 |
| _Roll_RA | 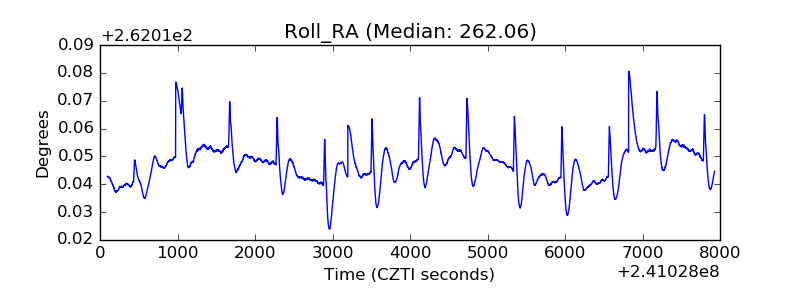 |
| Veto Counter | 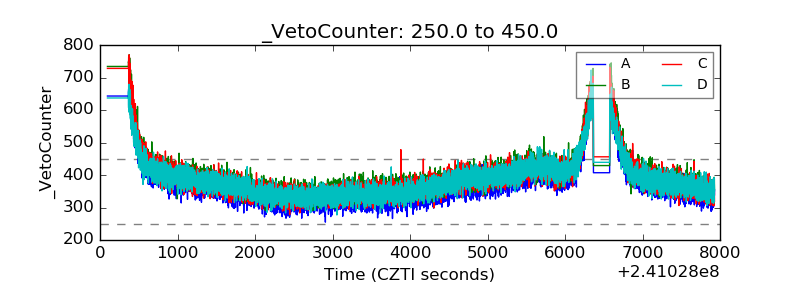 |