| Param | Original file | Final file |
|---|---|---|
| Filename | modeM0/AS1A03_069T03_9000001478cztM0_level2.fits | modeM0/AS1A03_069T03_9000001478cztM0_level2_quad_clean.evt |
| Size (bytes) | 129,277,440 | 112,308,480 |
| Size | 123.3 MB | 107.1 MB |
| Events in quadrant A | 795,710 | 656,636 |
| Events in quadrant B | 759,454 | 647,960 |
| Events in quadrant C | 768,208 | 610,616 |
| Events in quadrant D | 672,066 | 565,575 |
| Mode M0 | |||
|---|---|---|---|
| Quadrant | BADHDUFLAG | Total packets | Discarded packets |
| A | 0 | 27771 | 0 |
| B | 0 | 29604 | 0 |
| C | 0 | 27405 | 0 |
| D | 0 | 33388 | 0 |
| Mode SS | |||
|---|---|---|---|
| Quadrant | BADHDUFLAG | Total packets | Discarded packets |
| A | 0 | 270 | 0 |
| B | 0 | 270 | 0 |
| C | 0 | 270 | 0 |
| D | 0 | 270 | 0 |
| Mode M9 | |||
|---|---|---|---|
| Quadrant | BADHDUFLAG | Total packets | Discarded packets |
| A | 0 | 27 | 0 |
| B | 0 | 27 | 0 |
| C | 0 | 27 | 0 |
| D | 0 | 27 | 0 |
| Quadrant | Total seconds | Saturated seconds | Saturation percentage |
|---|---|---|---|
| A | 13316 | 227 | 1.704716% |
| B | 13313 | 303 | 2.275971% |
| C | 13312 | 136 | 1.021635% |
| D | 13317 | 264 | 1.982428% |
Noise dominated data is calculated using 1-second bins in cleaned event files. If a bin has >2000 counts, and if more than 50% of those come from <1% of pixels, then it is considered to be noise-dominated and hence unusable.
| Quadrant | # 1 sec bins | Bins with >0 counts | Bins with >2000 counts | High rate bins dominated by noise | Noise dominated (total time) | Noise dominated (detector-on time) | Marked lightcurve |
|---|---|---|---|---|---|---|---|
| A | 15260 | 13318 | 0 | 0 | 0.00% | 0.00% | 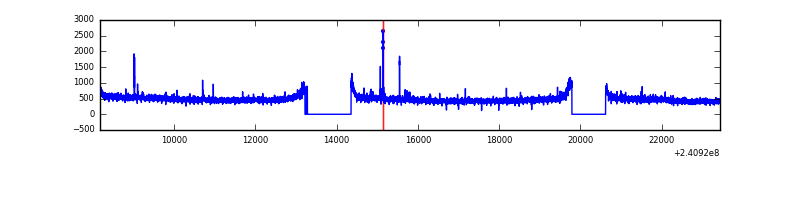 |
| B | 15260 | 13317 | 0 | 0 | 0.00% | 0.00% | 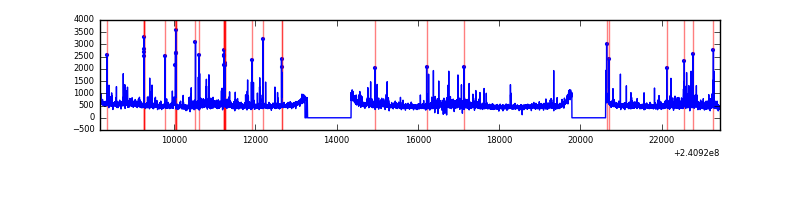 |
| C | 15260 | 13318 | 0 | 0 | 0.00% | 0.00% |  |
| D | 15260 | 13318 | 0 | 0 | 0.00% | 0.00% | 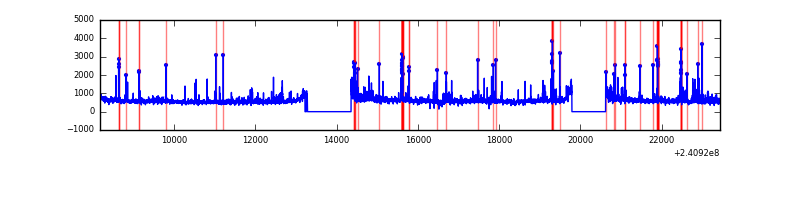 |
Top three noisy pixels from each quadrant. If the there are fewer than three noisy pixels in the level2.evt file, extra rows are filled as -1
| Pixel properties | Quadrant properties | ||||||
|---|---|---|---|---|---|---|---|
| Quadrant | DetID | PixID | Counts | Sigma | Mean | Median | Sigma |
| A | 0 | 29 | 735 | 10.34 | 206 | 195 | 52.2 |
| A | 7 | 110 | 669 | 9.08 | 206 | 195 | 52.2 |
| A | 9 | 19 | 600 | 7.76 | 206 | 195 | 52.2 |
| B | 2 | 9 | 667 | 11.41 | 200 | 191 | 41.7 |
| B | 14 | 254 | 536 | 8.27 | 200 | 191 | 41.7 |
| B | 12 | 226 | 516 | 7.79 | 200 | 191 | 41.7 |
| C | 12 | 241 | 572 | 7.11 | 203 | 190 | 53.7 |
| C | 3 | 158 | 554 | 6.77 | 203 | 190 | 53.7 |
| C | 1 | 65 | 528 | 6.29 | 203 | 190 | 53.7 |
| D | 6 | 231 | 508 | 6.21 | 191 | 174 | 53.8 |
| D | 3 | 14 | 497 | 6.01 | 191 | 174 | 53.8 |
| D | 7 | 3 | 494 | 5.95 | 191 | 174 | 53.8 |
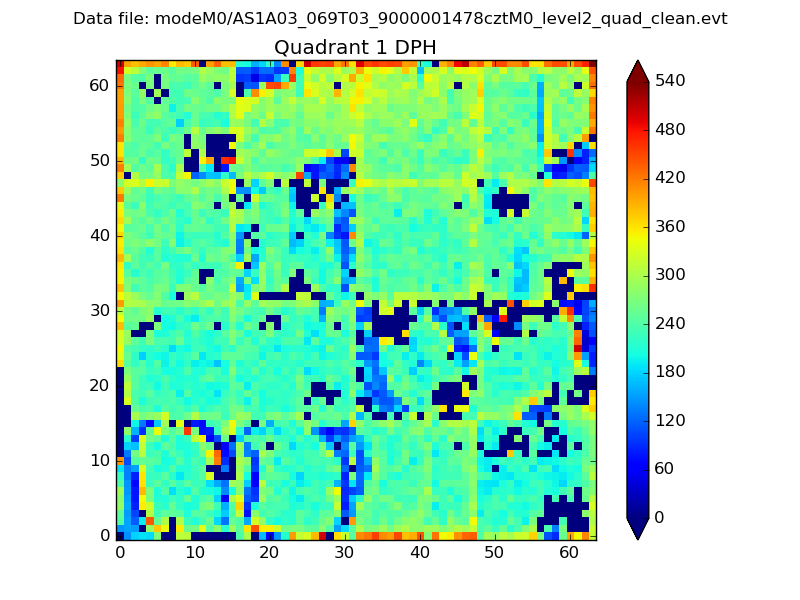
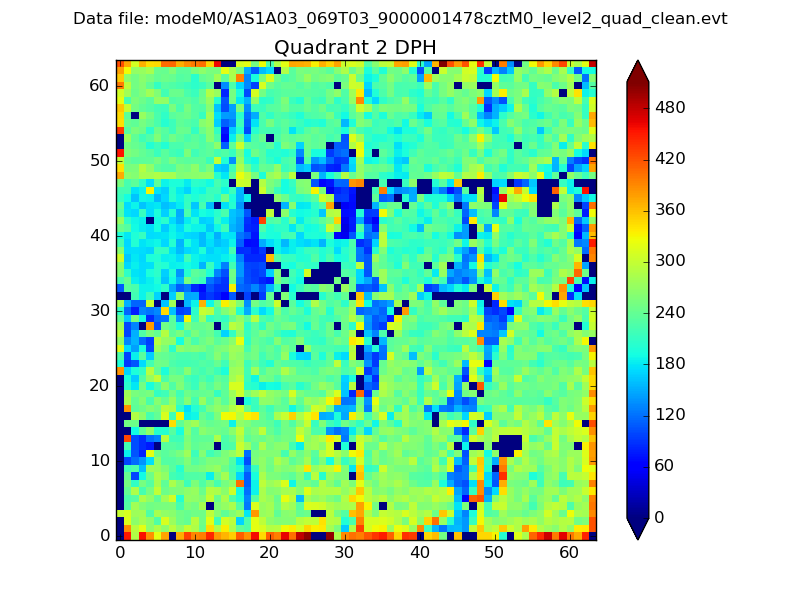
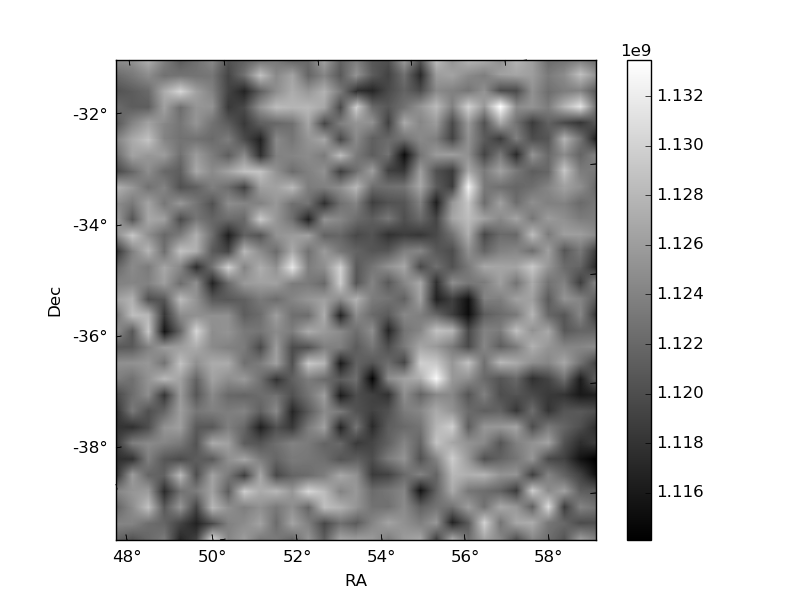
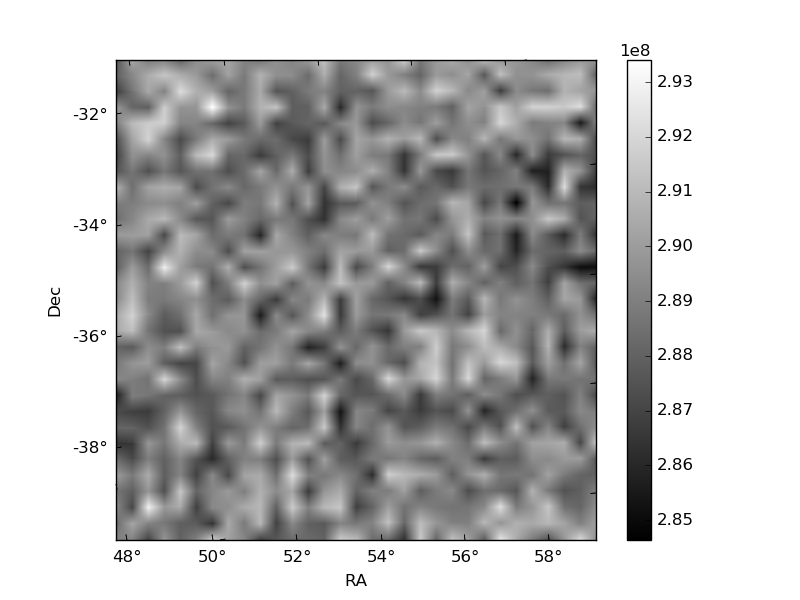
Histogram calculated using DETX and DETY for each event in the final _common_clean file
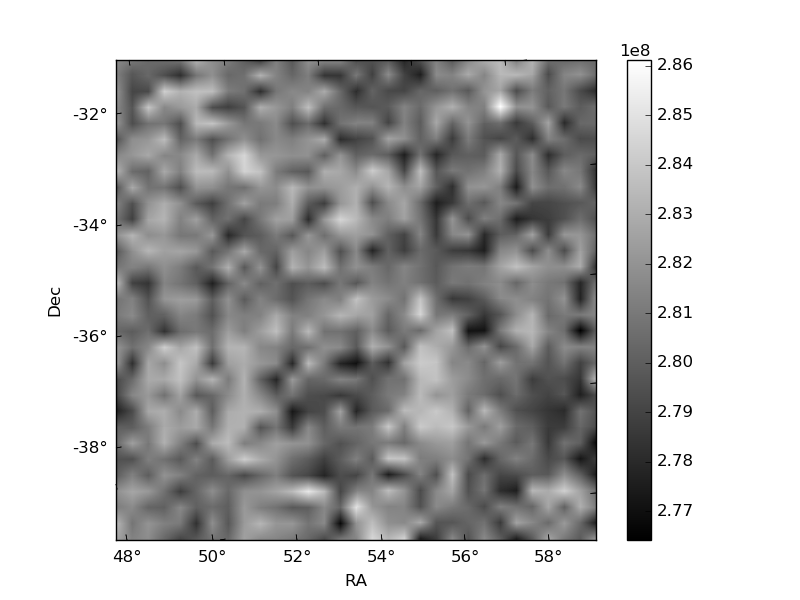
| Quadrant A | 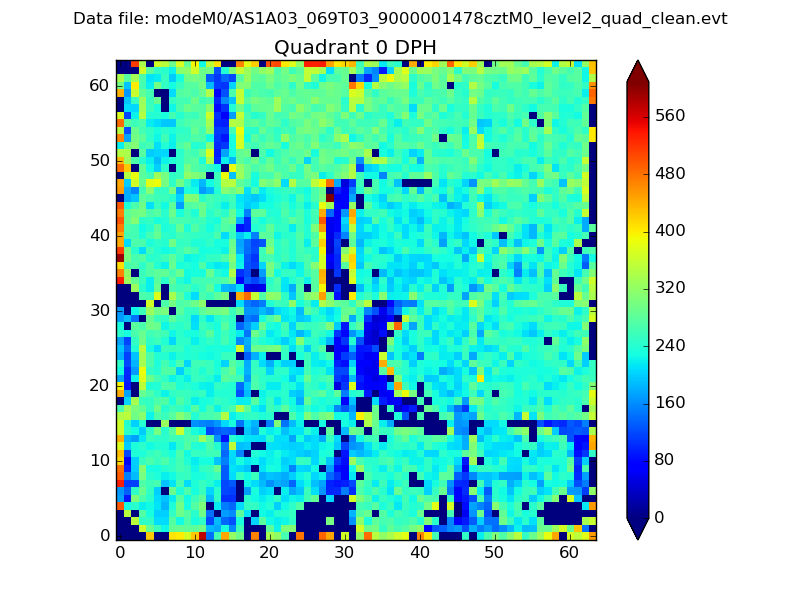 |
 |
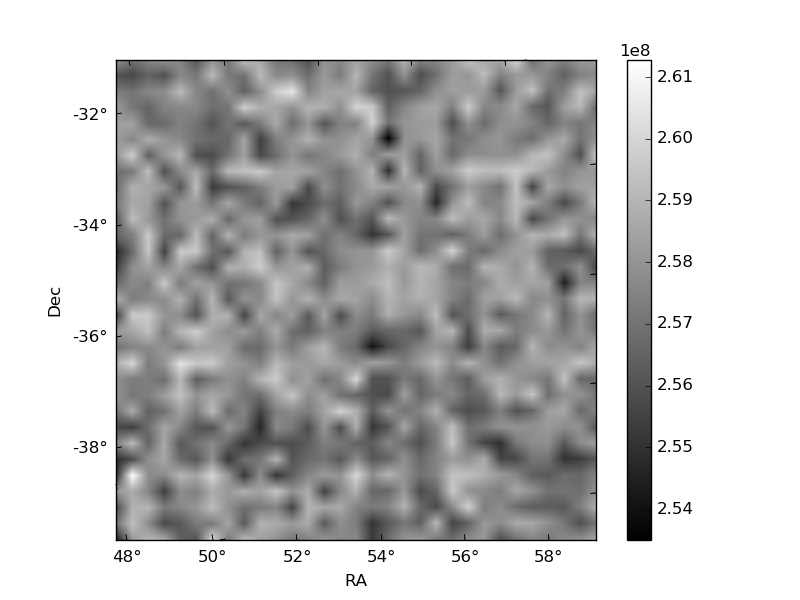
Quadrant B |
|---|---|---|---|
| Quadrant D | 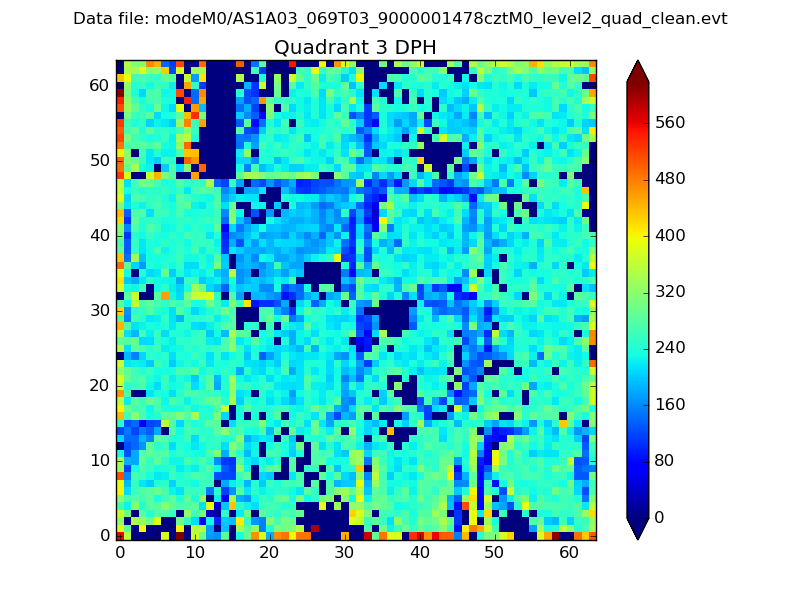 |
 |
Quadrant C |
| Plot type | Count rate plots | Images |
|---|---|---|
| Comparison with Poisson distribution Blue bars denote a histogram of data divided into 1 sec bins. Red curve is a Poisson curve with rate = median count rate of data. |
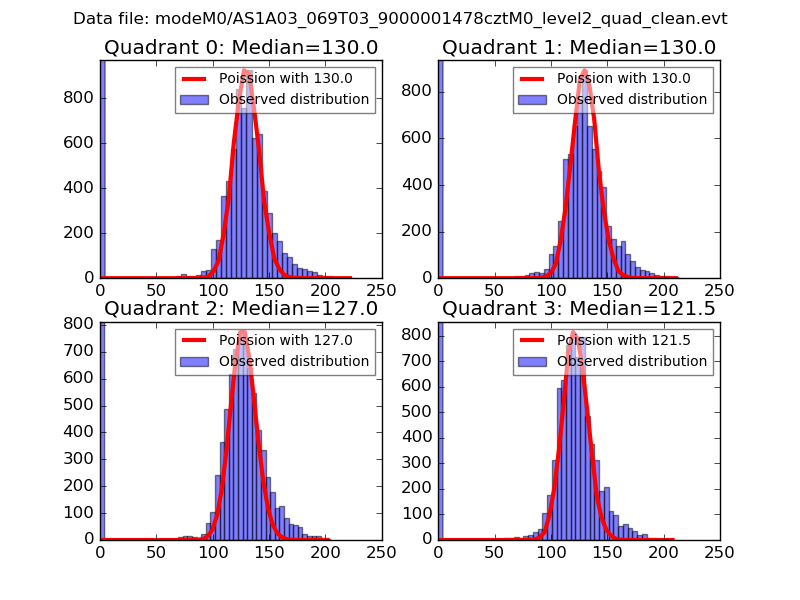 |
 |
| Quadrant-wise count rates Data is divided into 100 sec bins |
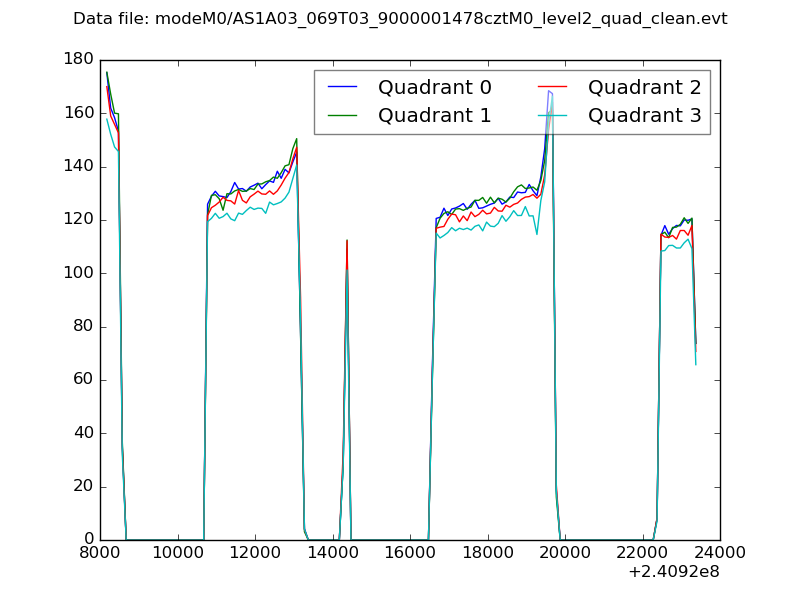 |
|
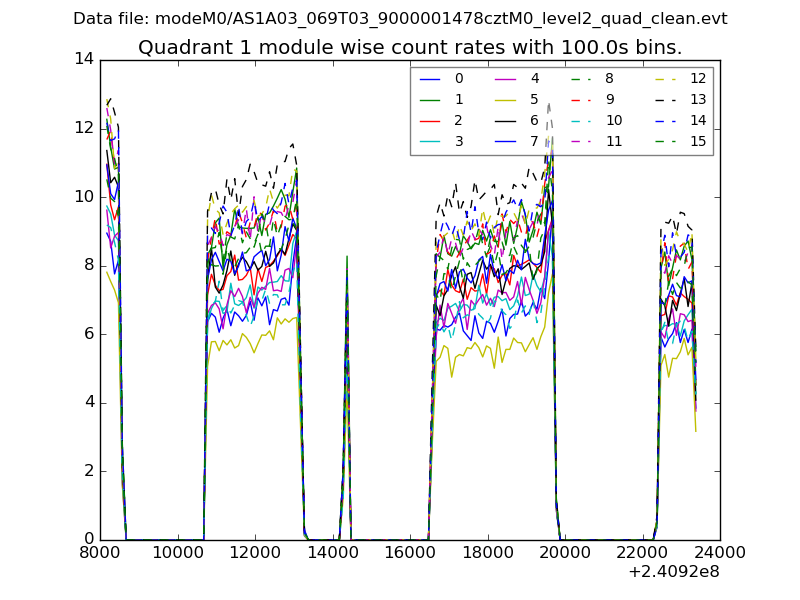
| Module-wise count rates for Quadrant A Data is divided into 100 sec bins |
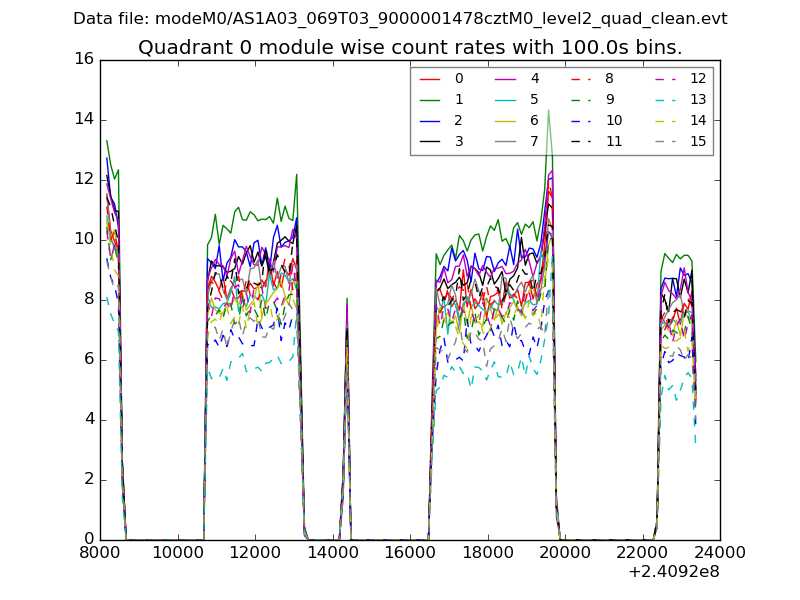 |
 |
| Module-wise count rates for Quadrant B Data is divided into 100 sec bins |
 |
 |
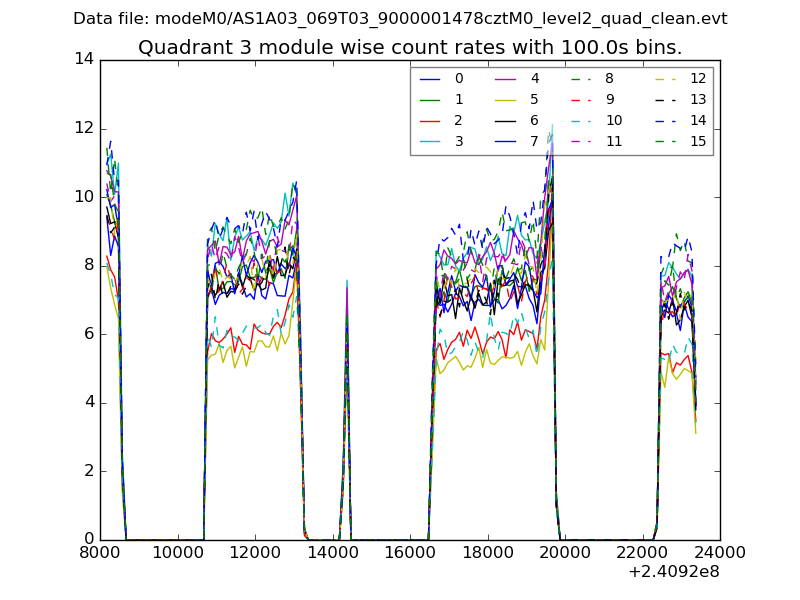
| Module-wise count rates for Quadrant C Data is divided into 100 sec bins |
 |
 |
| Module-wise count rates for Quadrant D Data is divided into 100 sec bins |
 |
 |
| Parameter | Plot |
|---|---|
| CZT HV Monitor |  |
| D_VDD | 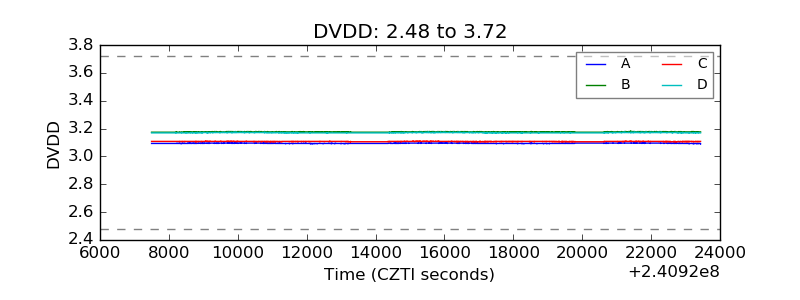 |
| Temperature 1 | 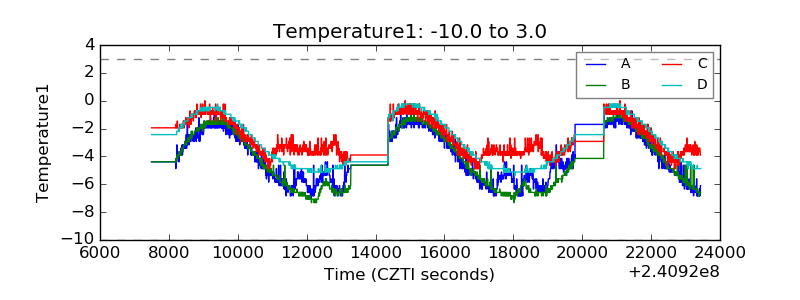 |
| Veto HV Monitor | 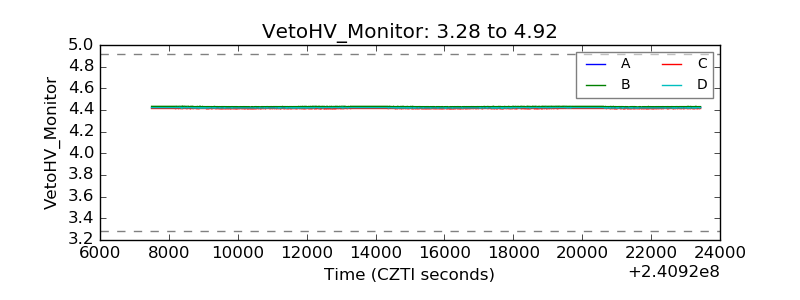 |
| Veto LLD | 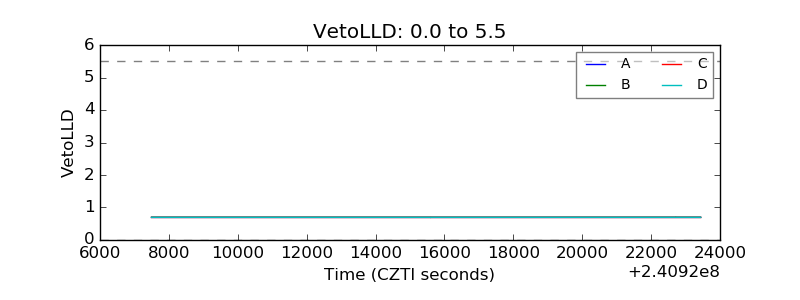 |
| Alpha Counter | 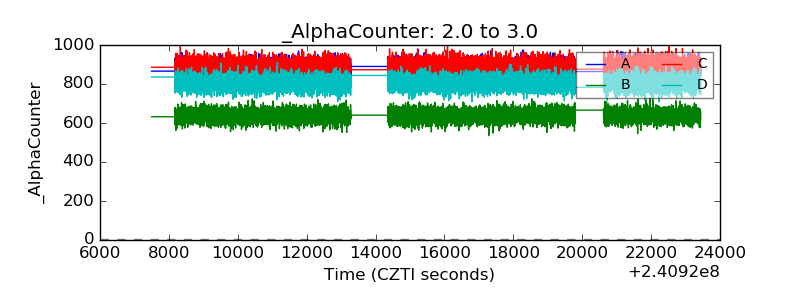 |
| _CPM_Rate | 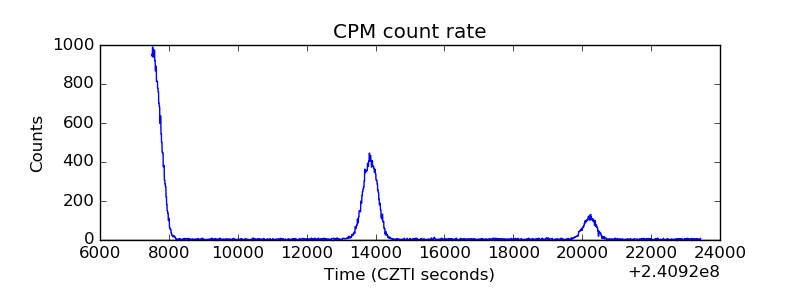 |
| CZT Counter |  |
| +2.5 Volts monitor |  |
| +5 Volts monitor | 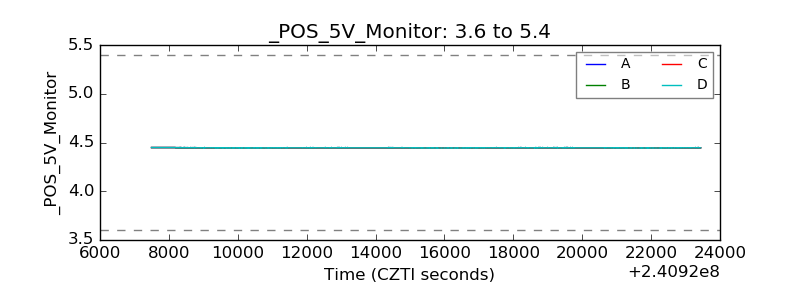 |
| _ROLL_ROT | 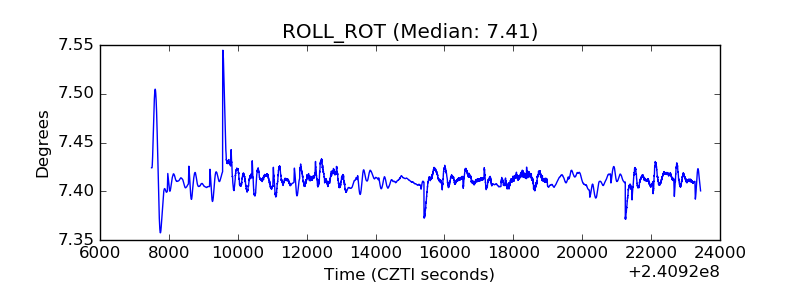 |
| _Roll_DEC | 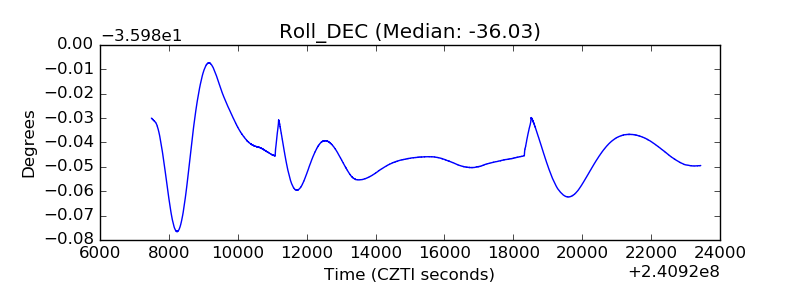 |
| _Roll_RA | 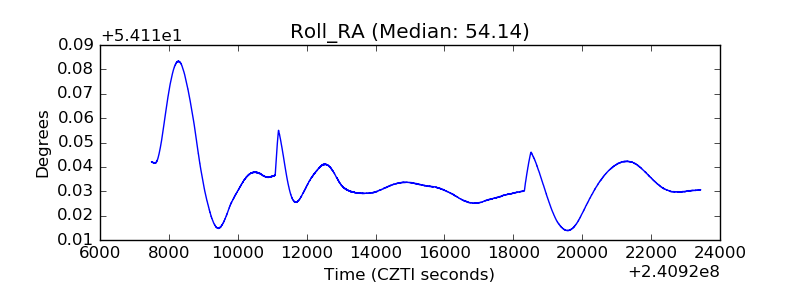 |
| Veto Counter | 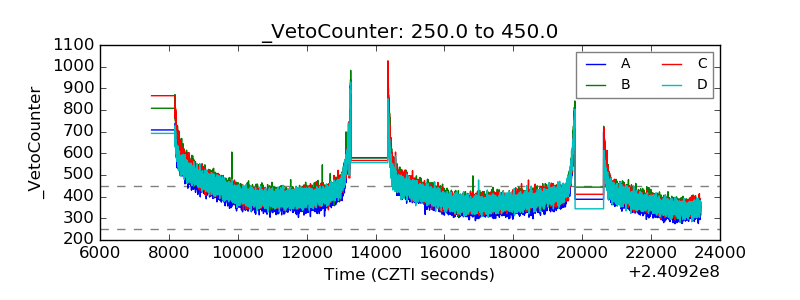 |