| Param | Original file | Final file |
|---|---|---|
| Filename | modeM0/AS1A03_069T03_9000001478_10248cztM0_level2.evt | modeM0/AS1A03_069T03_9000001478_10248cztM0_level2_quad_clean.evt |
| Size (bytes) | 124,061,760 | 12,916,800 |
| Size | 118.3 MB | 12.3 MB |
| Events in quadrant A | 887,446 | 68,632 |
| Events in quadrant B | 931,030 | 70,091 |
| Events in quadrant C | 813,176 | 67,478 |
| Events in quadrant D | 1,011,893 | 63,818 |
| Mode M0 | |||
|---|---|---|---|
| Quadrant | BADHDUFLAG | Total packets | Discarded packets |
| A | 0 | 3510 | 2 |
| B | 0 | 3725 | 1 |
| C | 0 | 3352 | 1 |
| D | 0 | 4105 | 1 |
| Mode SS | |||
|---|---|---|---|
| Quadrant | BADHDUFLAG | Total packets | Discarded packets |
| A | 0 | 34 | 0 |
| B | 0 | 34 | 0 |
| C | 0 | 34 | 0 |
| D | 0 | 34 | 0 |
| Mode M9 | |||
|---|---|---|---|
| Quadrant | BADHDUFLAG | Total packets | Discarded packets |
| A | 0 | 7 | 0 |
| B | 0 | 7 | 0 |
| C | 0 | 7 | 0 |
| D | 0 | 7 | 0 |
| Quadrant | Total seconds | Saturated seconds | Saturation percentage |
|---|---|---|---|
| A | 1629 | 2 | 0.122775% |
| B | 1629 | 9 | 0.552486% |
| C | 1629 | 1 | 0.061387% |
| D | 1629 | 9 | 0.552486% |
Noise dominated data is calculated using 1-second bins in cleaned event files. If a bin has >2000 counts, and if more than 50% of those come from <1% of pixels, then it is considered to be noise-dominated and hence unusable.
| Quadrant | # 1 sec bins | Bins with >0 counts | Bins with >2000 counts | High rate bins dominated by noise | Noise dominated (total time) | Noise dominated (detector-on time) | Marked lightcurve |
|---|---|---|---|---|---|---|---|
| A | 1629 | 1629 | 0 | 0 | 0.00% | 0.00% |  |
| B | 1629 | 1629 | 6 | 6 | 0.37% | 0.37% |  |
| C | 1629 | 1629 | 0 | 0 | 0.00% | 0.00% |  |
| D | 1629 | 1629 | 7 | 7 | 0.43% | 0.43% |  |
Top three noisy pixels from each quadrant. If the there are fewer than three noisy pixels in the level2.evt file, extra rows are filled as -1
| Pixel properties | Quadrant properties | ||||||
|---|---|---|---|---|---|---|---|
| Quadrant | DetID | PixID | Counts | Sigma | Mean | Median | Sigma |
| A | 8 | 15 | 34442 | 757.89 | 218 | 214 | 45.2 |
| A | 15 | 174 | 12338 | 268.45 | 218 | 214 | 45.2 |
| A | 0 | 226 | 2112 | 42.03 | 218 | 214 | 45.2 |
| B | 10 | 247 | 26515 | 622.26 | 215 | 210 | 42.3 |
| B | 0 | 214 | 24427 | 572.87 | 215 | 210 | 42.3 |
| B | 4 | 81 | 19325 | 452.18 | 215 | 210 | 42.3 |
| C | 13 | 61 | 1588 | 28.19 | 207 | 209 | 48.9 |
| C | 14 | 67 | 1437 | 25.1 | 207 | 209 | 48.9 |
| C | 0 | 207 | 1077 | 17.74 | 207 | 209 | 48.9 |
| D | 8 | 195 | 136216 | 2638.93 | 210 | 204 | 51.5 |
| D | 1 | 52 | 23683 | 455.54 | 210 | 204 | 51.5 |
| D | 13 | 104 | 11783 | 224.66 | 210 | 204 | 51.5 |
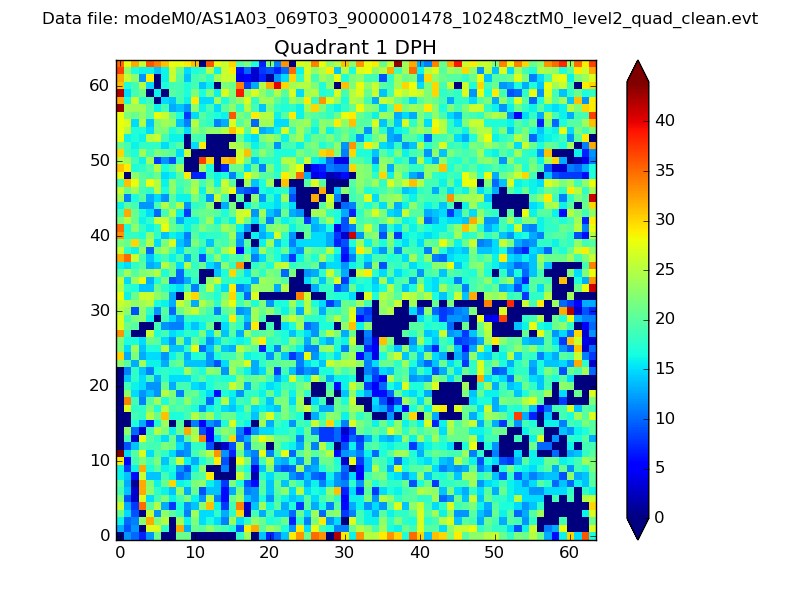
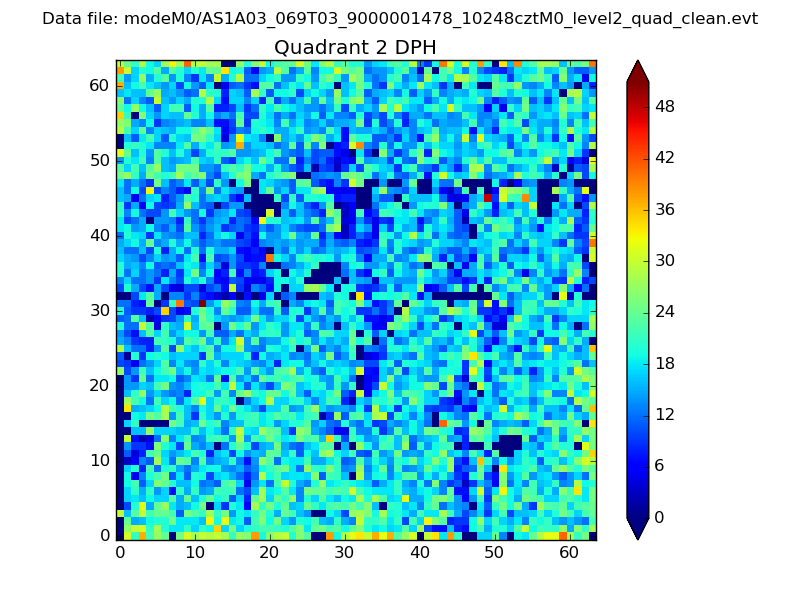
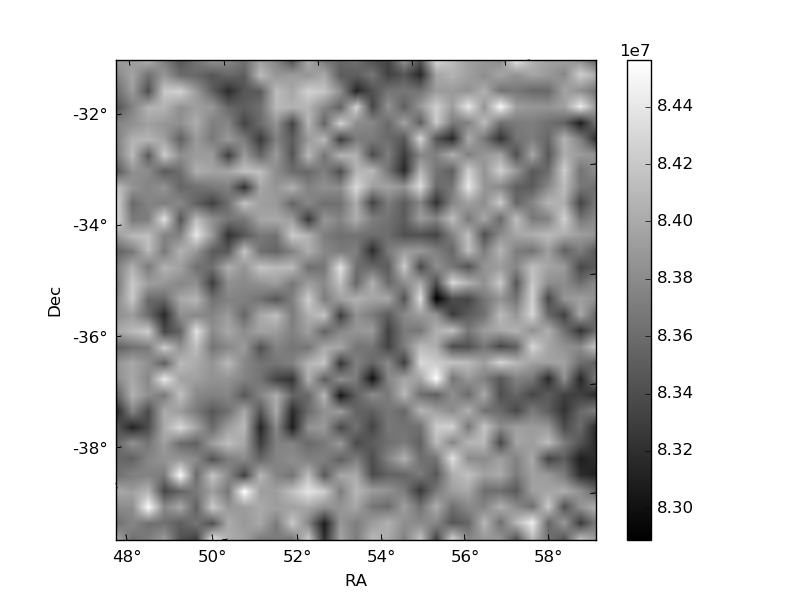
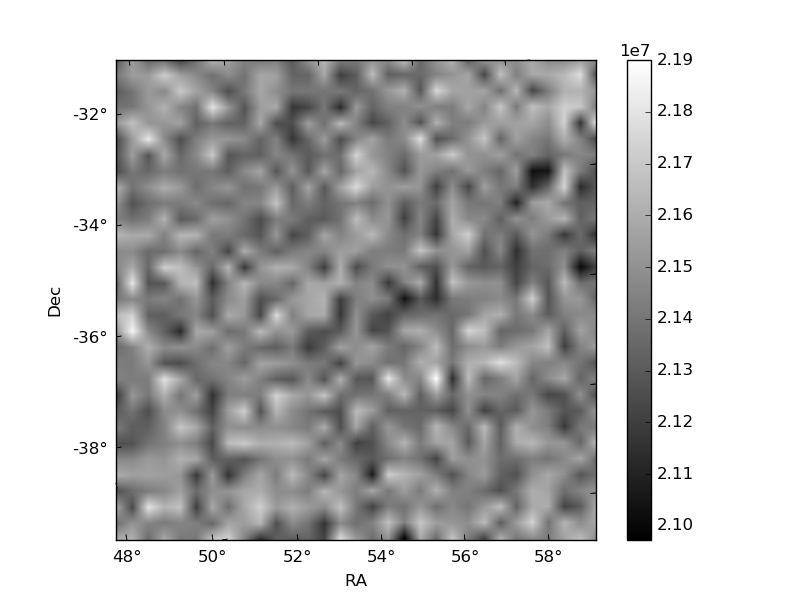
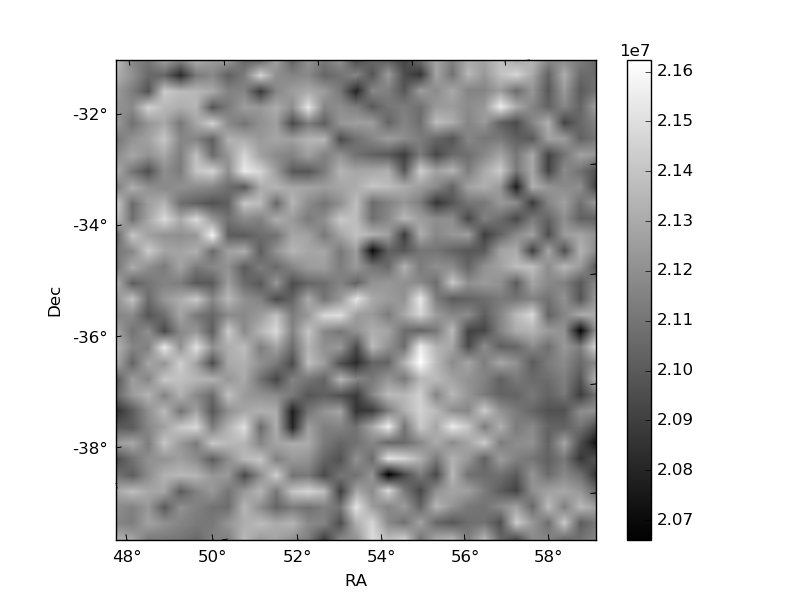
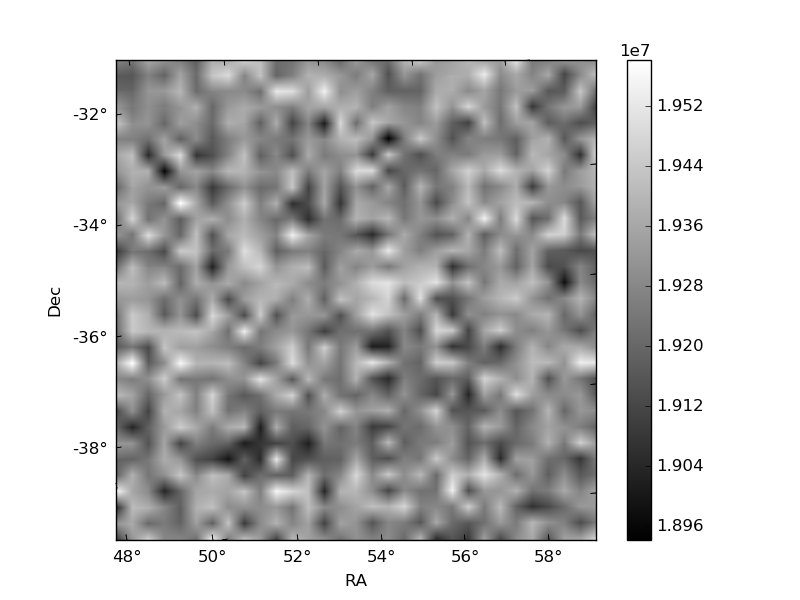
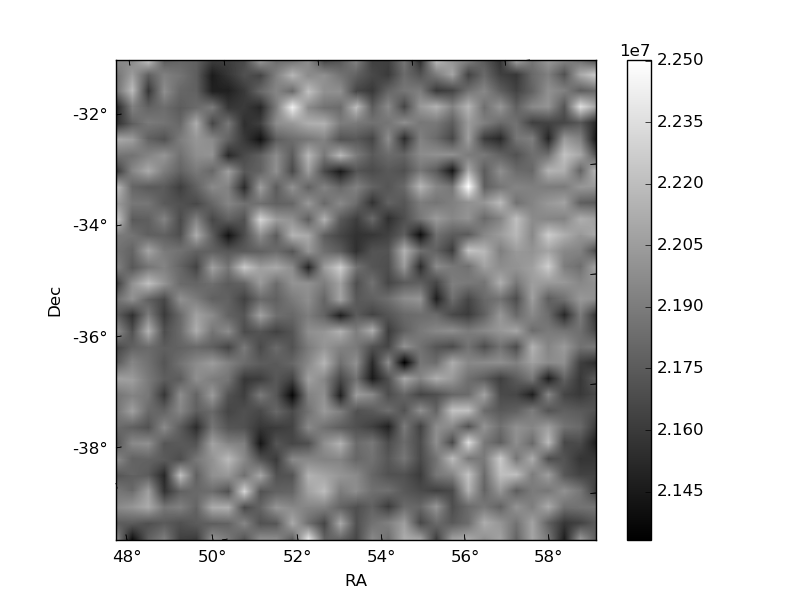
Histogram calculated using DETX and DETY for each event in the final _common_clean file
| Quadrant A |  |
 |
Quadrant B |
|---|---|---|---|
| Quadrant D | 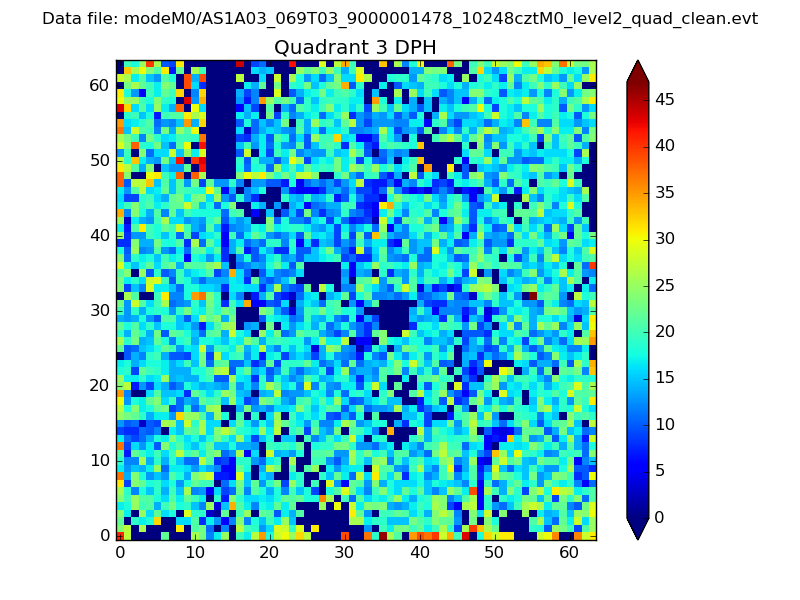 |
 |
Quadrant C |
| Plot type | Count rate plots | Images |
|---|---|---|
| Comparison with Poisson distribution Blue bars denote a histogram of data divided into 1 sec bins. Red curve is a Poisson curve with rate = median count rate of data. |
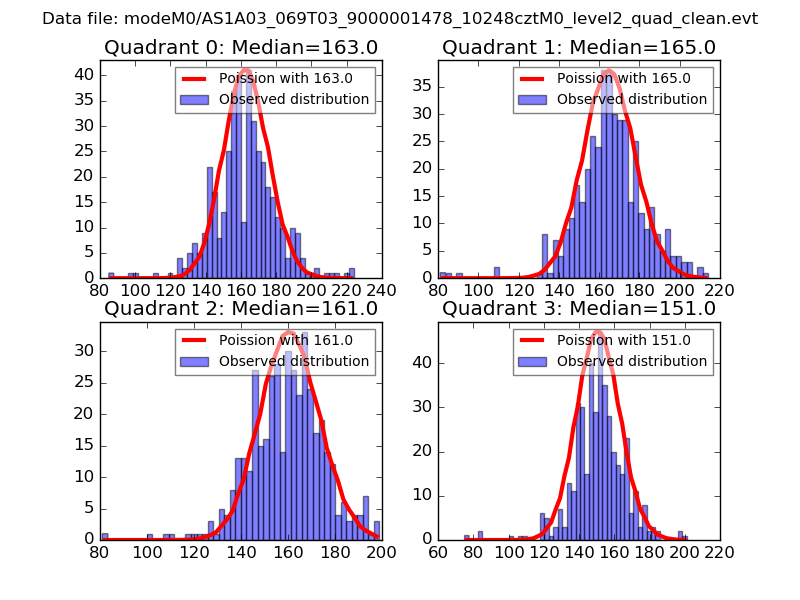 |
 |
| Quadrant-wise count rates Data is divided into 100 sec bins |
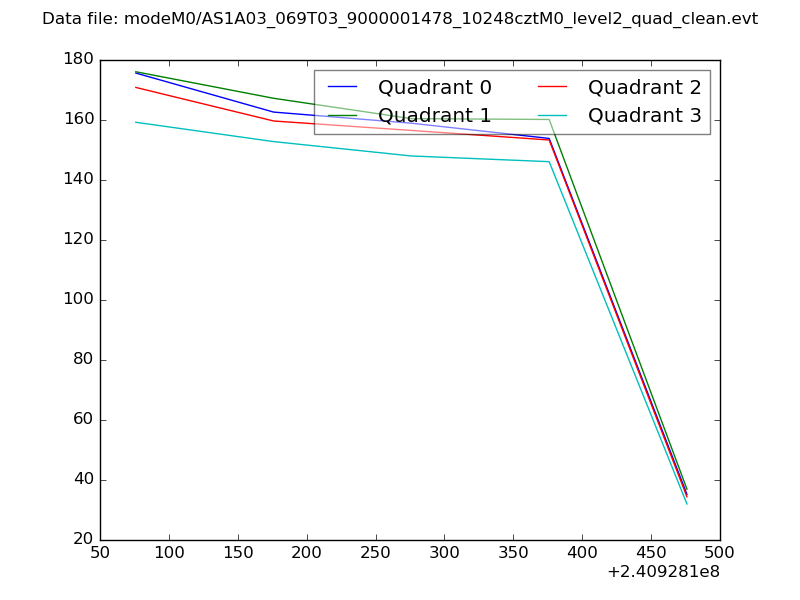 |
|
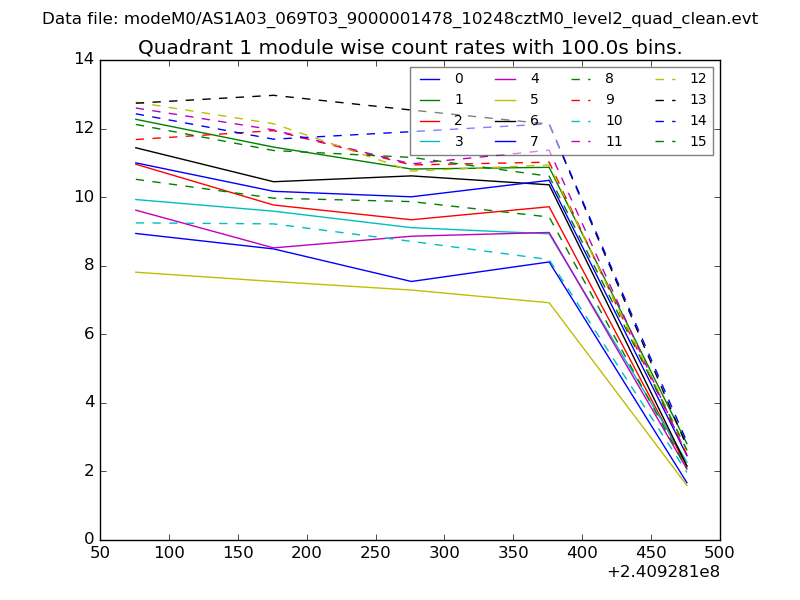
| Module-wise count rates for Quadrant A Data is divided into 100 sec bins |
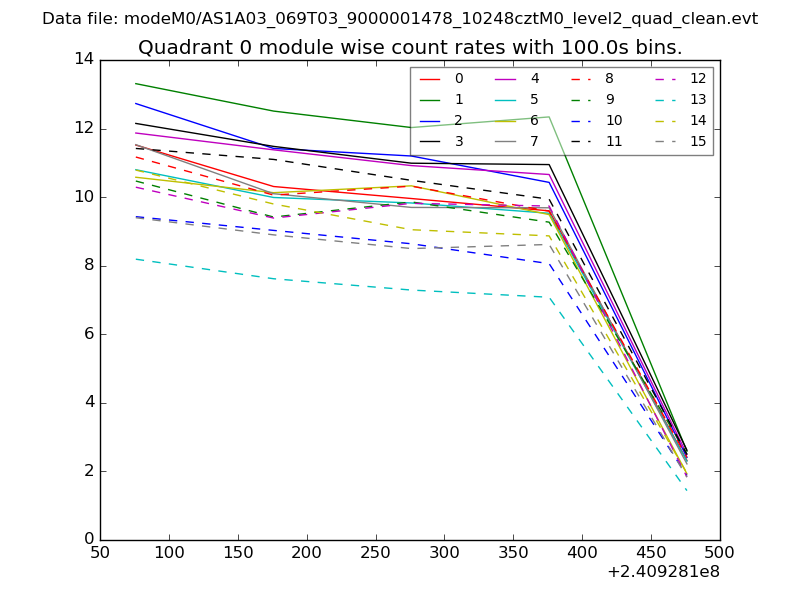 |
 |
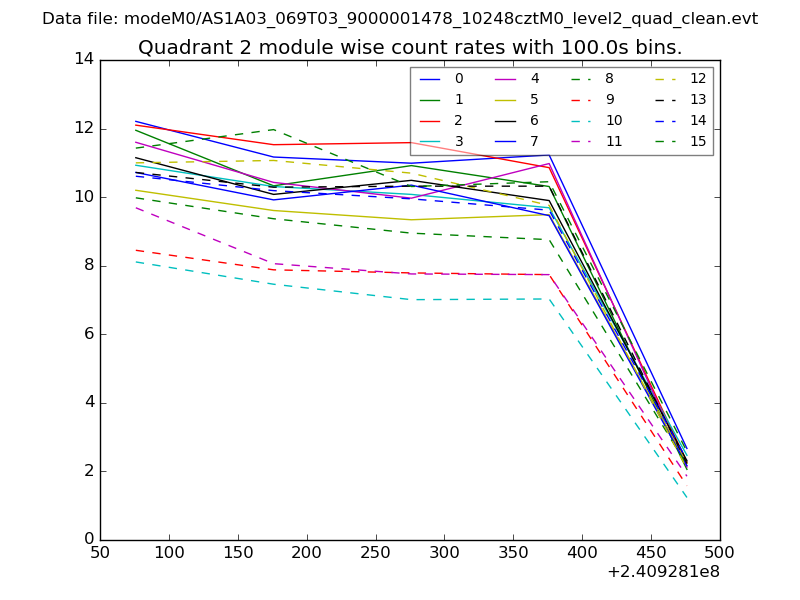
| Module-wise count rates for Quadrant B Data is divided into 100 sec bins |
 |
 |
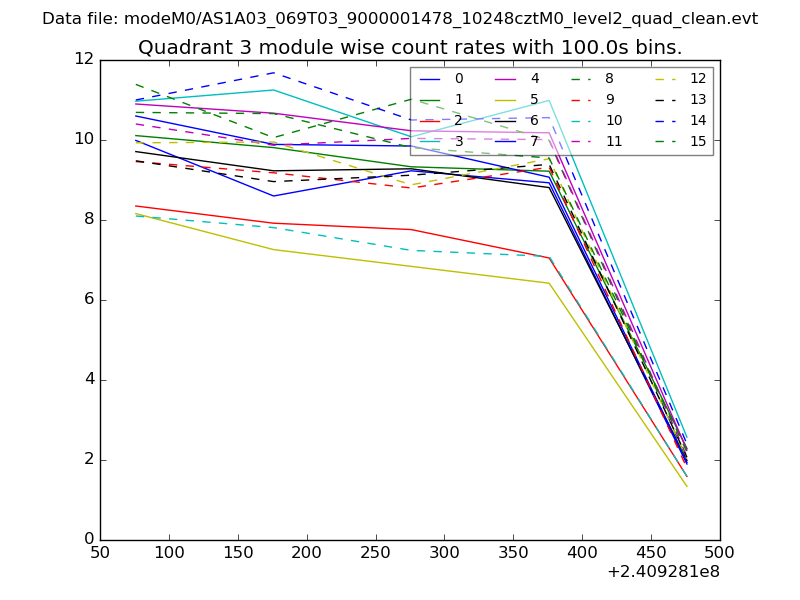
| Module-wise count rates for Quadrant C Data is divided into 100 sec bins |
 |
 |
| Module-wise count rates for Quadrant D Data is divided into 100 sec bins |
 |
 |
| Parameter | Plot |
|---|---|
| CZT HV Monitor | 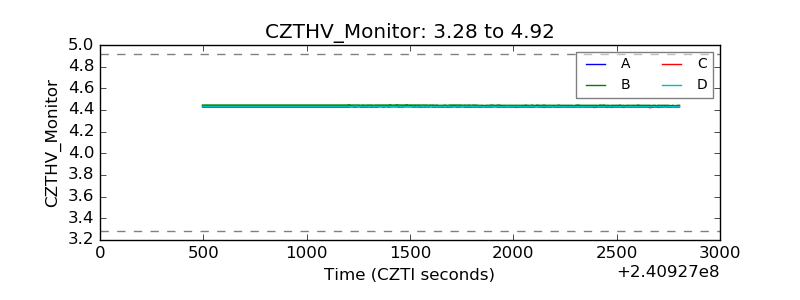 |
| D_VDD | 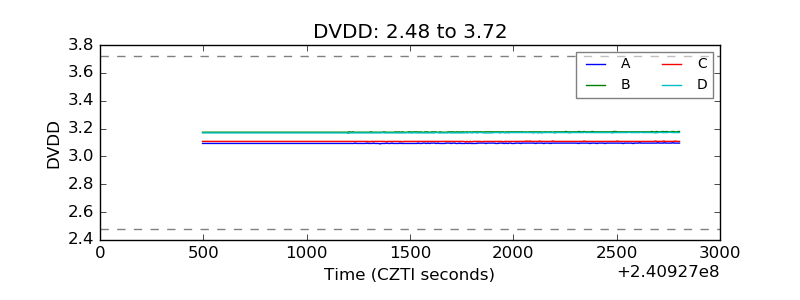 |
| Temperature 1 | 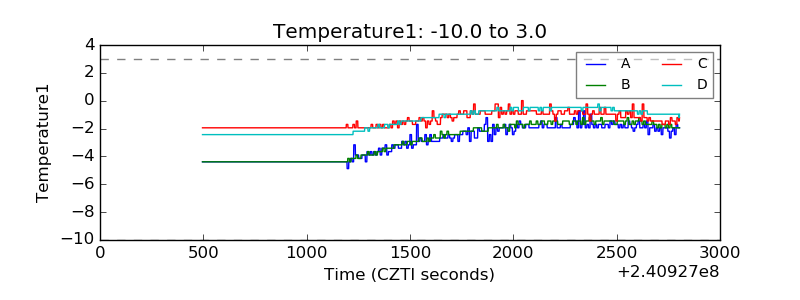 |
| Veto HV Monitor | 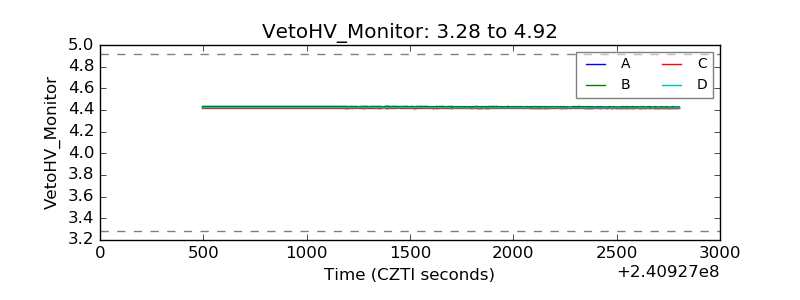 |
| Veto LLD |  |
| Alpha Counter | 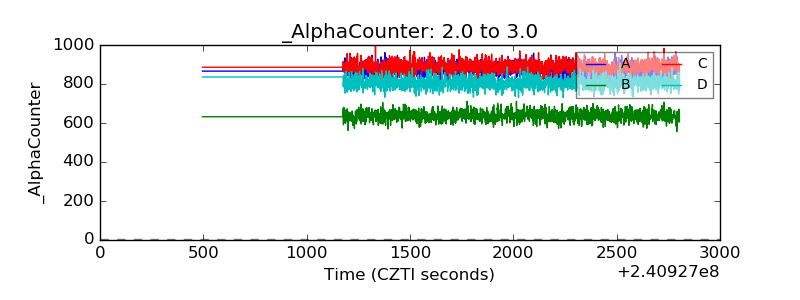 |
| _CPM_Rate | 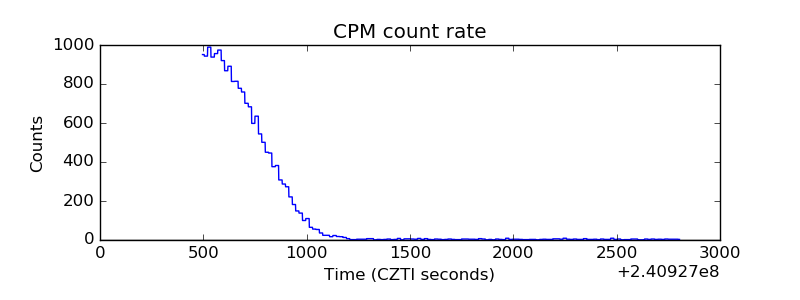 |
| CZT Counter | 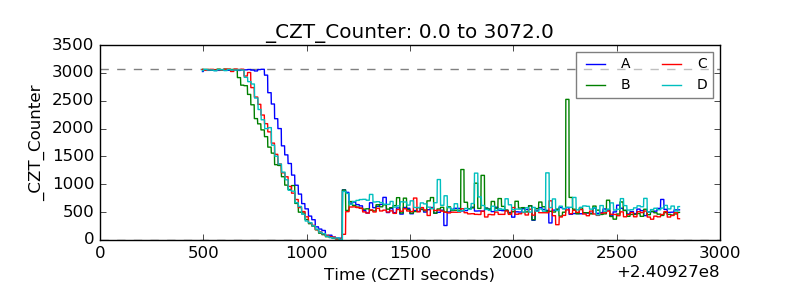 |
| +2.5 Volts monitor |  |
| +5 Volts monitor |  |
| _ROLL_ROT | 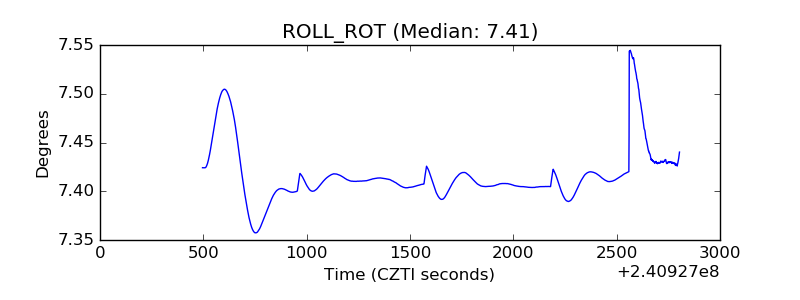 |
| _Roll_DEC | 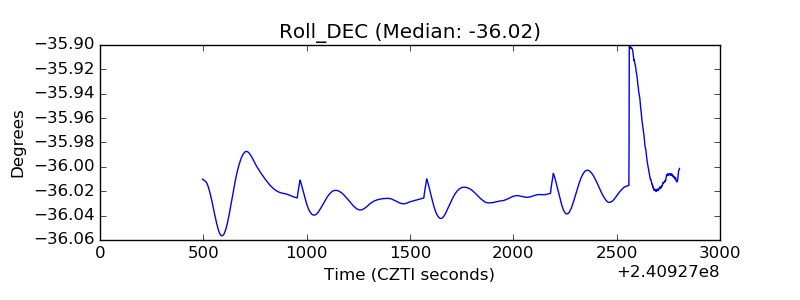 |
| _Roll_RA | 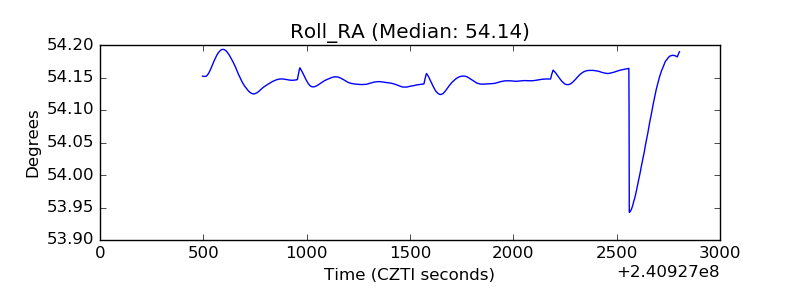 |
| Veto Counter | 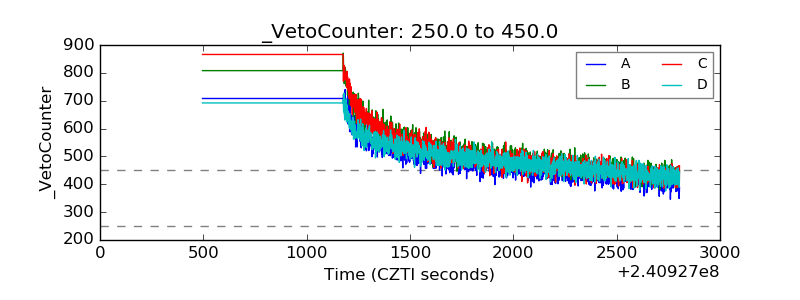 |