| Param | Original file | Final file |
|---|---|---|
| Filename | modeM0/AS1A03_069T03_9000001478_10249cztM0_level2.evt | modeM0/AS1A03_069T03_9000001478_10249cztM0_level2_quad_clean.evt |
| Size (bytes) | 479,093,760 | 66,568,320 |
| Size | 456.9 MB | 63.5 MB |
| Events in quadrant A | 3,309,677 | 396,904 |
| Events in quadrant B | 3,603,290 | 398,703 |
| Events in quadrant C | 3,125,055 | 390,957 |
| Events in quadrant D | 4,027,252 | 372,818 |
| Mode M0 | |||
|---|---|---|---|
| Quadrant | BADHDUFLAG | Total packets | Discarded packets |
| A | 0 | 13768 | 2 |
| B | 0 | 14719 | 1 |
| C | 0 | 13480 | 1 |
| D | 0 | 16209 | 1 |
| Mode SS | |||
|---|---|---|---|
| Quadrant | BADHDUFLAG | Total packets | Discarded packets |
| A | 0 | 134 | 0 |
| B | 0 | 134 | 0 |
| C | 0 | 134 | 0 |
| D | 0 | 134 | 0 |
| Mode M9 | |||
|---|---|---|---|
| Quadrant | BADHDUFLAG | Total packets | Discarded packets |
| A | 0 | 11 | 0 |
| B | 0 | 11 | 0 |
| C | 0 | 11 | 0 |
| D | 0 | 11 | 0 |
| Quadrant | Total seconds | Saturated seconds | Saturation percentage |
|---|---|---|---|
| A | 6535 | 142 | 2.172915% |
| B | 6535 | 181 | 2.769702% |
| C | 6535 | 89 | 1.361897% |
| D | 6535 | 146 | 2.234124% |
Noise dominated data is calculated using 1-second bins in cleaned event files. If a bin has >2000 counts, and if more than 50% of those come from <1% of pixels, then it is considered to be noise-dominated and hence unusable.
| Quadrant | # 1 sec bins | Bins with >0 counts | Bins with >2000 counts | High rate bins dominated by noise | Noise dominated (total time) | Noise dominated (detector-on time) | Marked lightcurve |
|---|---|---|---|---|---|---|---|
| A | 7645 | 6536 | 3 | 3 | 0.04% | 0.05% | 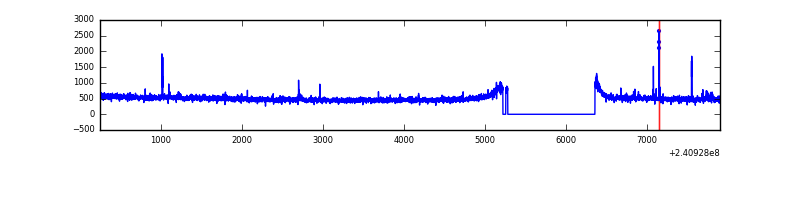 |
| B | 7645 | 6536 | 24 | 24 | 0.31% | 0.37% |  |
| C | 7645 | 6536 | 0 | 0 | 0.00% | 0.00% | 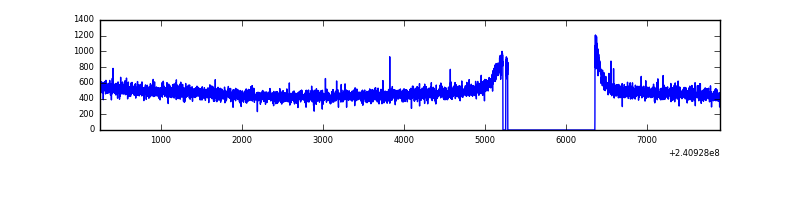 |
| D | 7645 | 6536 | 31 | 31 | 0.41% | 0.47% | 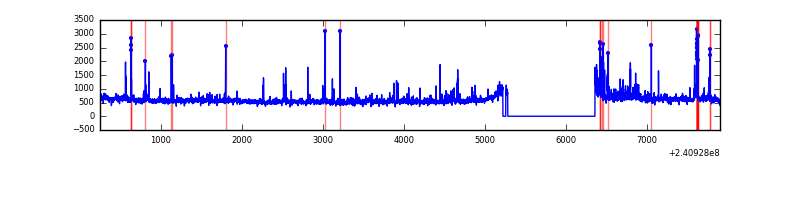 |
Top three noisy pixels from each quadrant. If the there are fewer than three noisy pixels in the level2.evt file, extra rows are filled as -1
| Pixel properties | Quadrant properties | ||||||
|---|---|---|---|---|---|---|---|
| Quadrant | DetID | PixID | Counts | Sigma | Mean | Median | Sigma |
| A | 8 | 15 | 68286 | 405.77 | 827 | 811 | 166.3 |
| A | 15 | 174 | 35736 | 210.03 | 827 | 811 | 166.3 |
| A | 3 | 1 | 15074 | 85.77 | 827 | 811 | 166.3 |
| B | 11 | 51 | 124244 | 790.51 | 821 | 803 | 156.2 |
| B | 10 | 247 | 92740 | 588.76 | 821 | 803 | 156.2 |
| B | 0 | 214 | 73572 | 466.01 | 821 | 803 | 156.2 |
| C | 0 | 207 | 10903 | 55.13 | 798 | 801 | 183.2 |
| C | 13 | 61 | 6035 | 28.57 | 798 | 801 | 183.2 |
| C | 14 | 67 | 3089 | 12.49 | 798 | 801 | 183.2 |
| D | 8 | 195 | 639417 | 3339.2 | 798 | 775 | 191.3 |
| D | 1 | 52 | 80125 | 414.89 | 798 | 775 | 191.3 |
| D | 13 | 122 | 67988 | 351.43 | 798 | 775 | 191.3 |
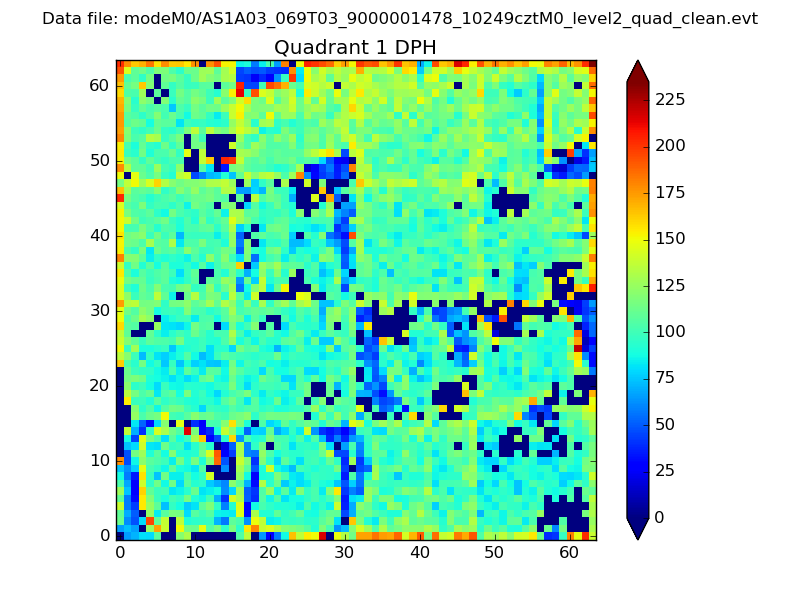
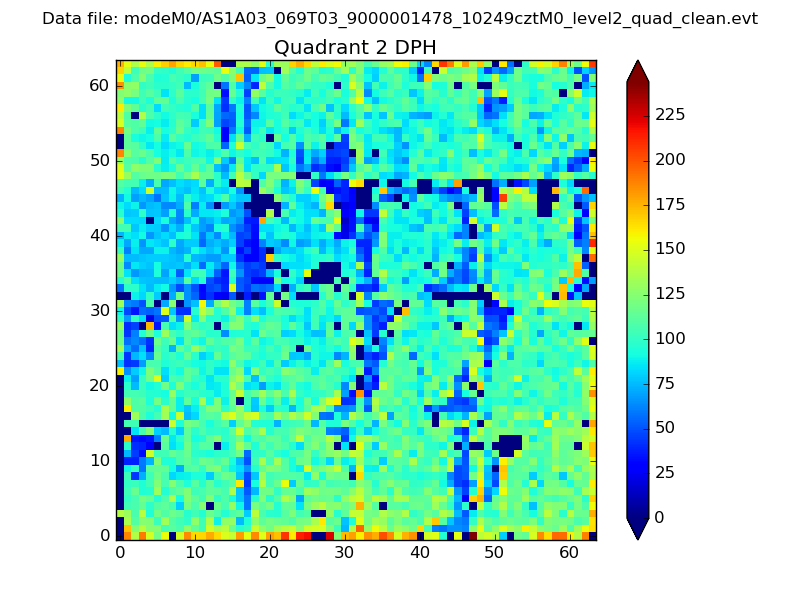
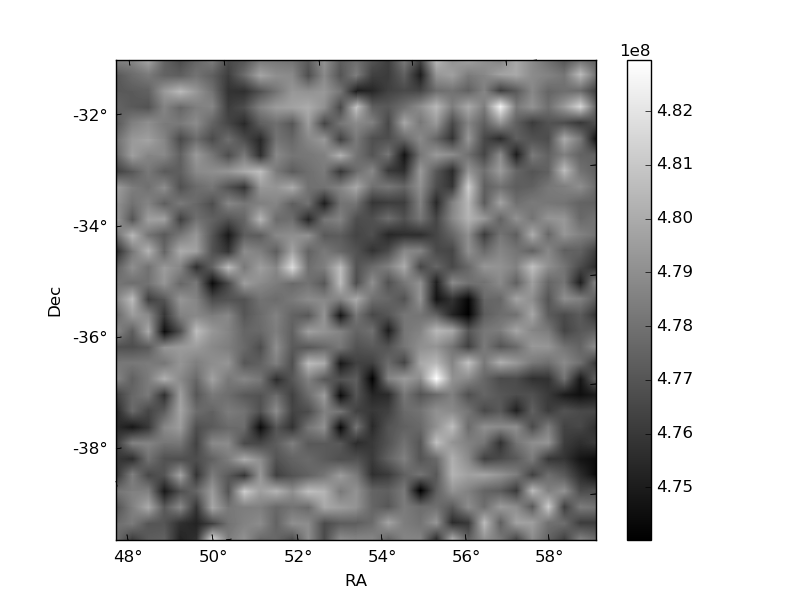
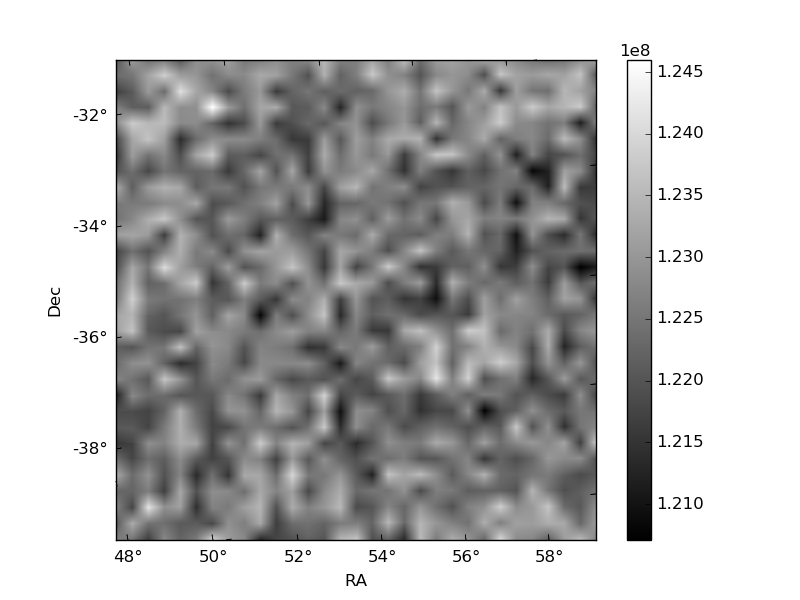
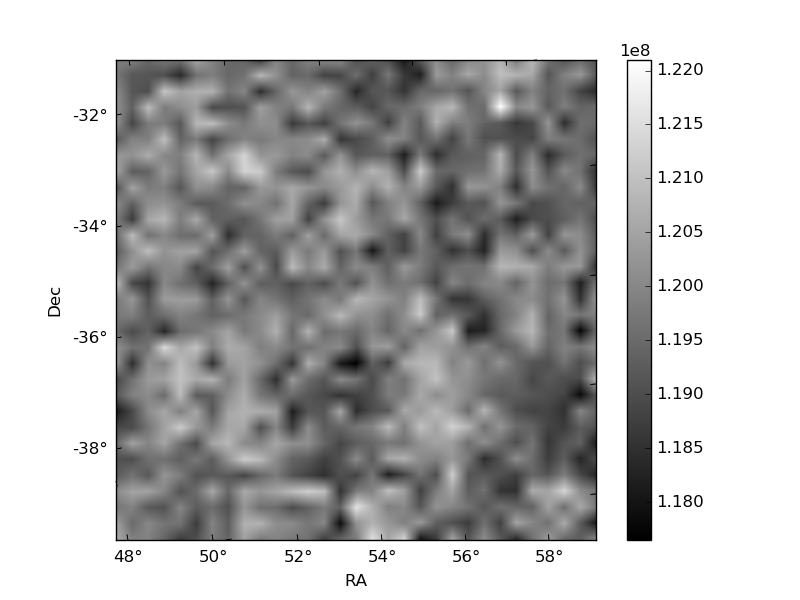
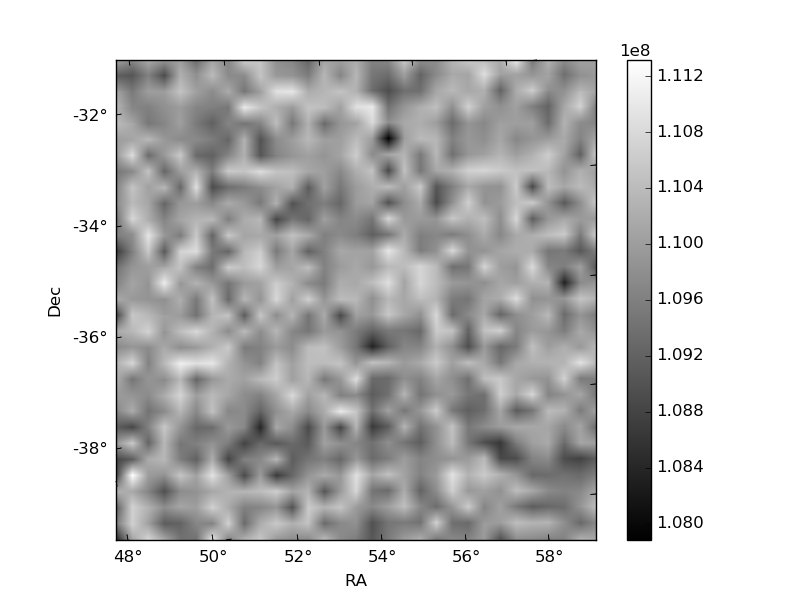
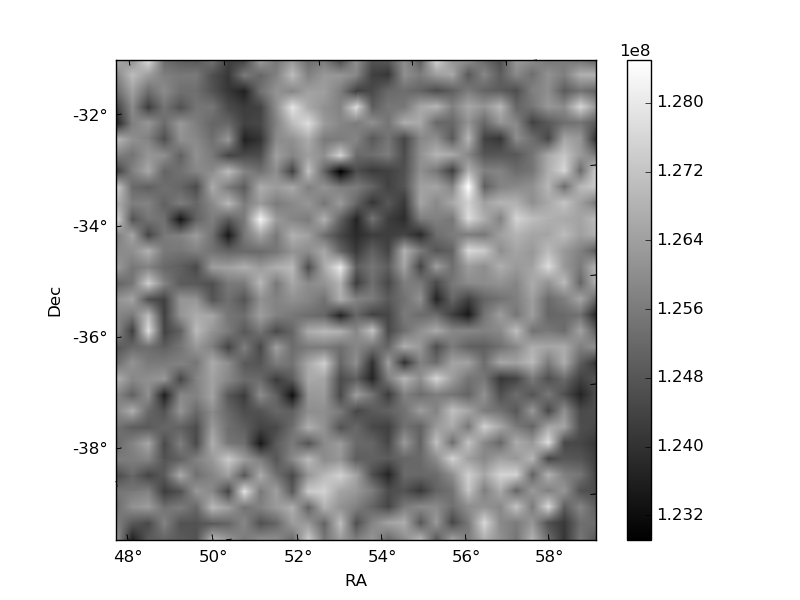
Histogram calculated using DETX and DETY for each event in the final _common_clean file
| Quadrant A | 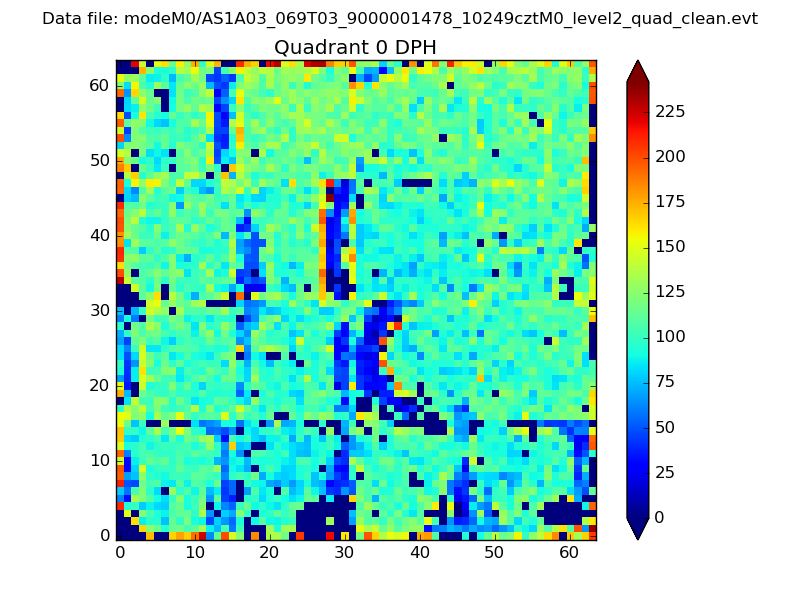 |
 |
Quadrant B |
|---|---|---|---|
| Quadrant D | 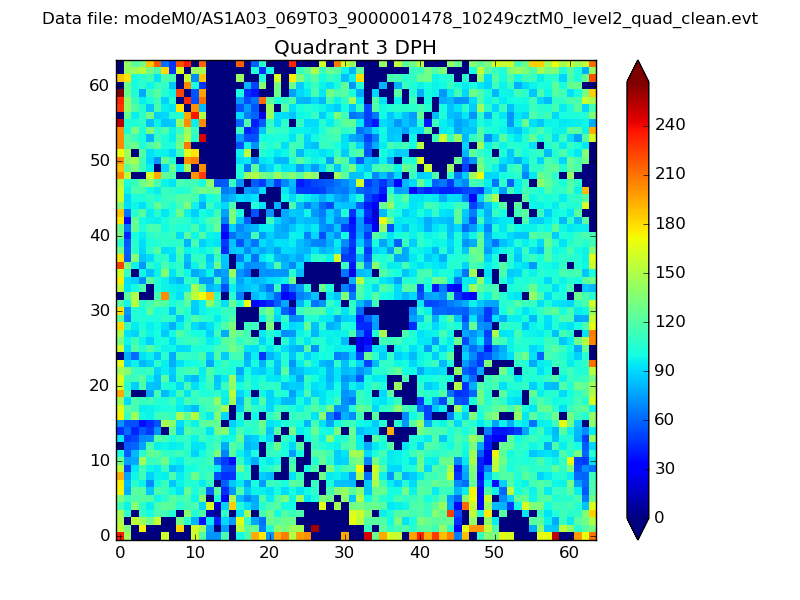 |
 |
Quadrant C |
| Plot type | Count rate plots | Images |
|---|---|---|
| Comparison with Poisson distribution Blue bars denote a histogram of data divided into 1 sec bins. Red curve is a Poisson curve with rate = median count rate of data. |
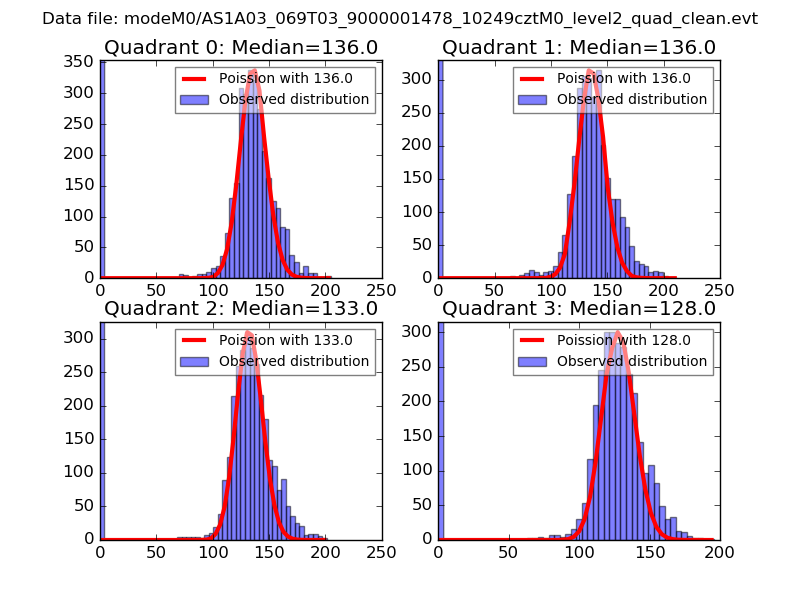 |
 |
| Quadrant-wise count rates Data is divided into 100 sec bins |
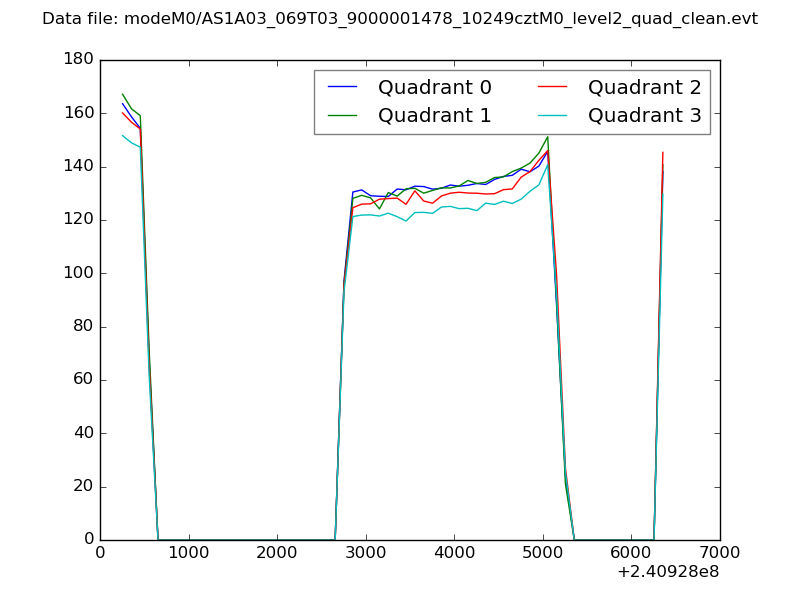 |
|
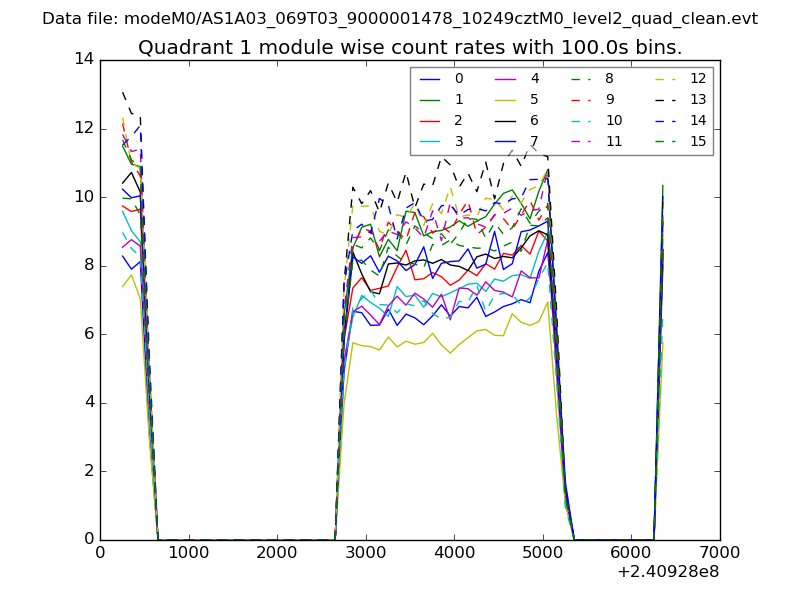
| Module-wise count rates for Quadrant A Data is divided into 100 sec bins |
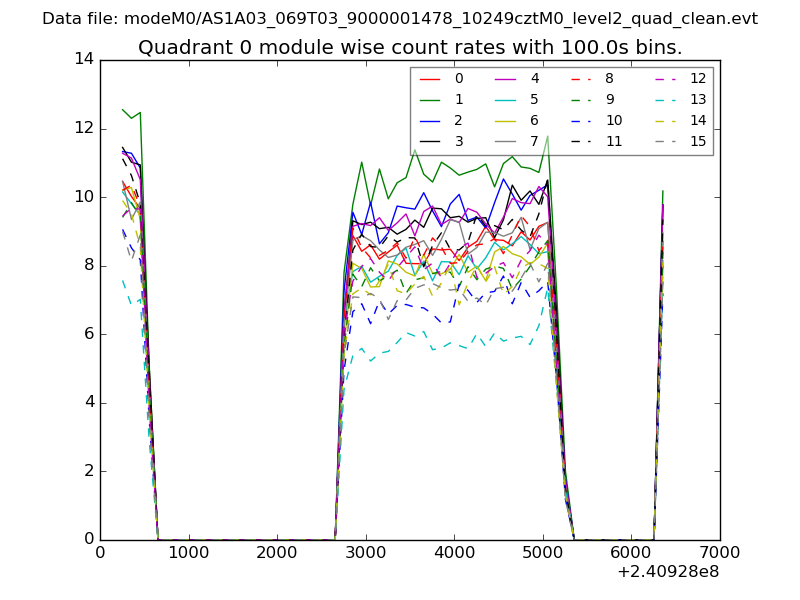 |
 |
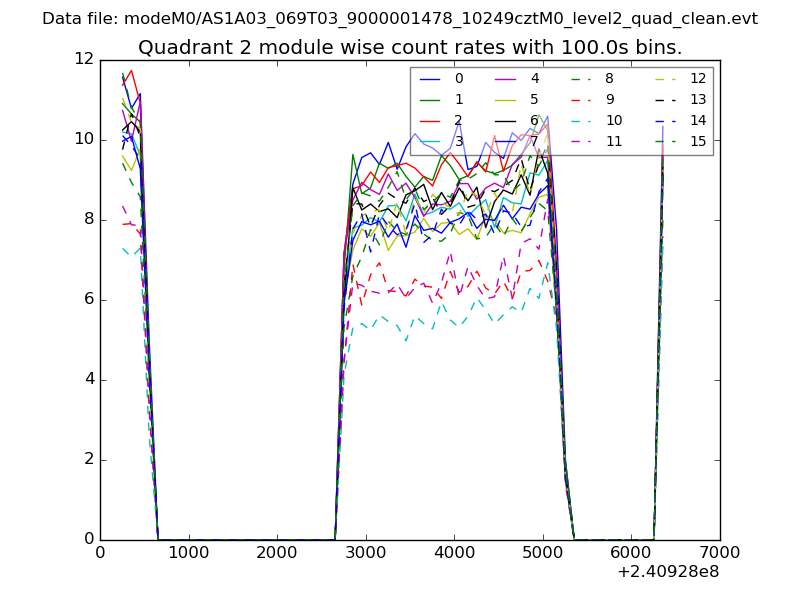
| Module-wise count rates for Quadrant B Data is divided into 100 sec bins |
 |
 |
| Module-wise count rates for Quadrant C Data is divided into 100 sec bins |
 |
 |
| Module-wise count rates for Quadrant D Data is divided into 100 sec bins |
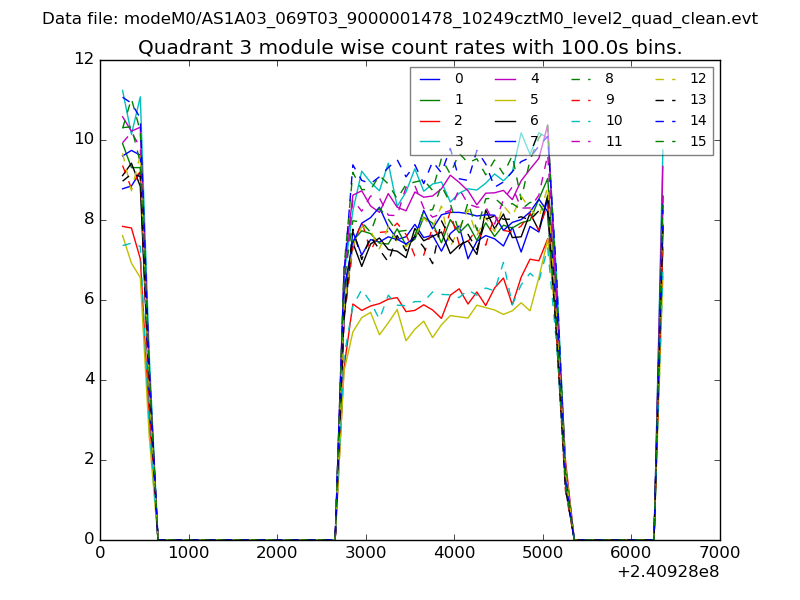 |
 |
| Parameter | Plot |
|---|---|
| CZT HV Monitor | 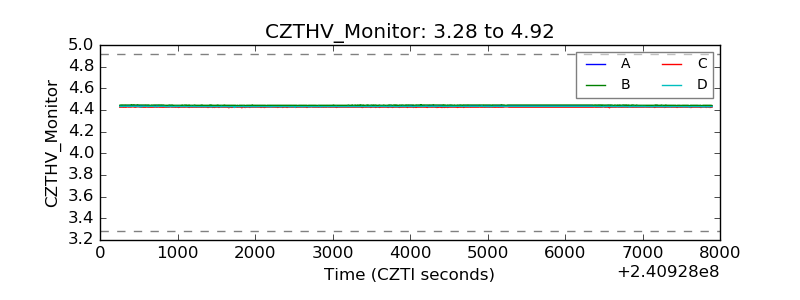 |
| D_VDD | 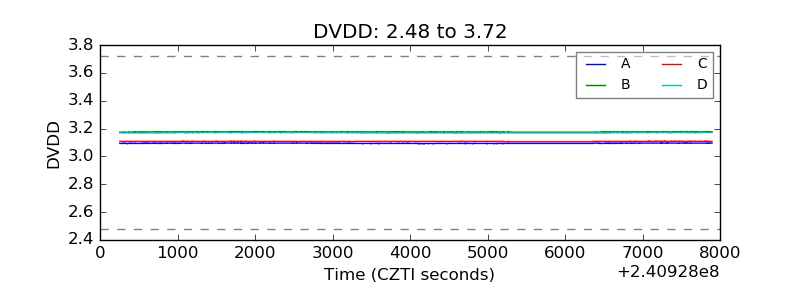 |
| Temperature 1 | 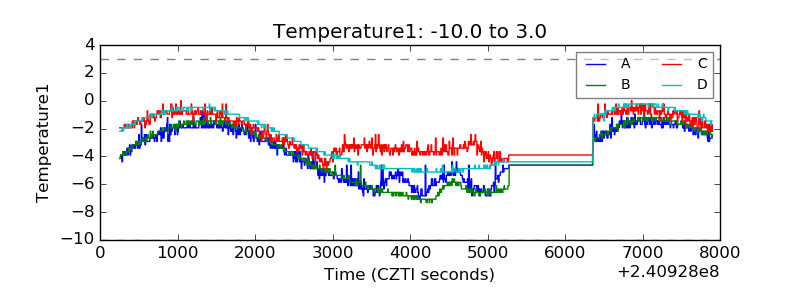 |
| Veto HV Monitor | 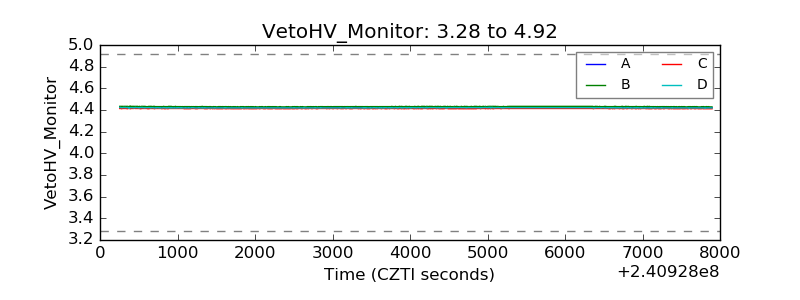 |
| Veto LLD |  |
| Alpha Counter | 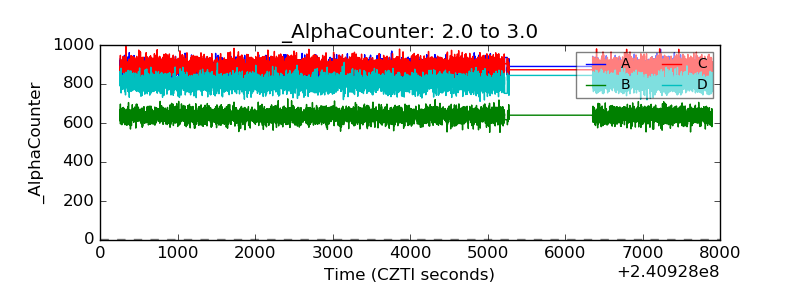 |
| _CPM_Rate | 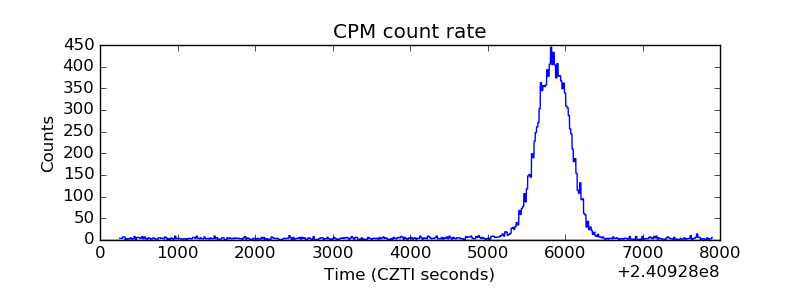 |
| CZT Counter | 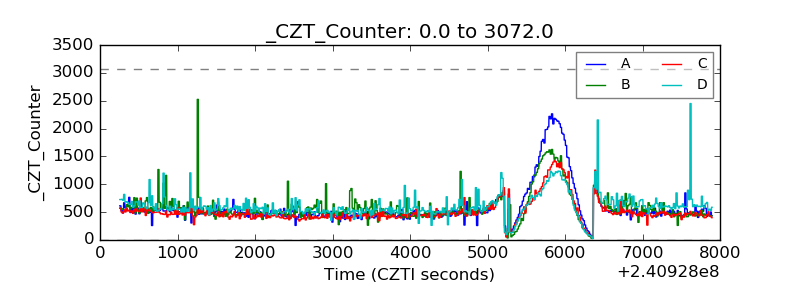 |
| +2.5 Volts monitor |  |
| +5 Volts monitor |  |
| _ROLL_ROT | 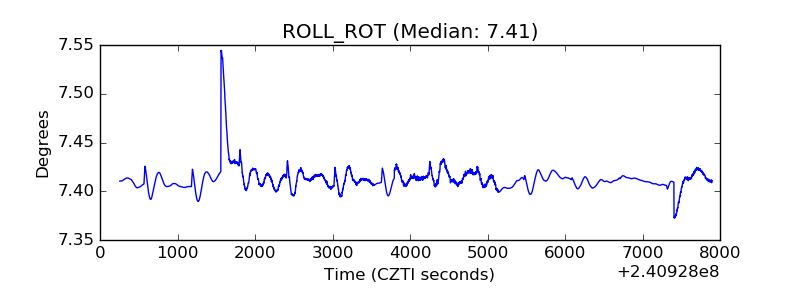 |
| _Roll_DEC | 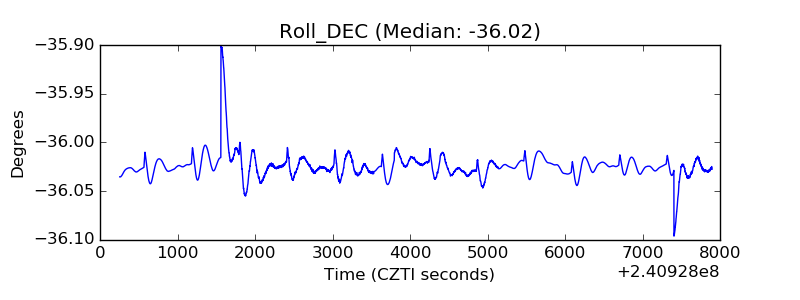 |
| _Roll_RA | 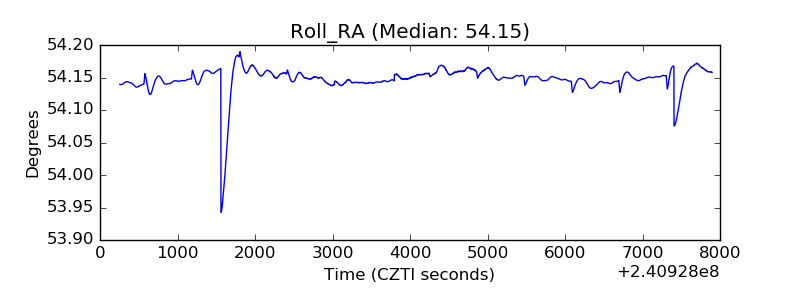 |
| Veto Counter | 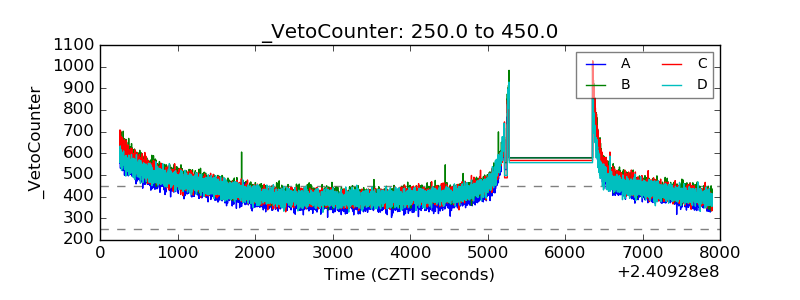 |