| Param | Original file | Final file |
|---|---|---|
| Filename | modeM0/AS1A03_069T03_9000001478_10250cztM0_level2.evt | modeM0/AS1A03_069T03_9000001478_10250cztM0_level2_quad_clean.evt |
| Size (bytes) | 477,694,080 | 68,515,200 |
| Size | 455.6 MB | 65.3 MB |
| Events in quadrant A | 3,189,777 | 411,413 |
| Events in quadrant B | 3,432,173 | 410,003 |
| Events in quadrant C | 3,078,002 | 400,343 |
| Events in quadrant D | 4,312,924 | 386,490 |
| Mode M0 | |||
|---|---|---|---|
| Quadrant | BADHDUFLAG | Total packets | Discarded packets |
| A | 0 | 13899 | 12 |
| B | 0 | 14460 | 22 |
| C | 0 | 13730 | 23 |
| D | 0 | 17464 | 20 |
| Mode SS | |||
|---|---|---|---|
| Quadrant | BADHDUFLAG | Total packets | Discarded packets |
| A | 0 | 134 | 0 |
| B | 0 | 134 | 0 |
| C | 0 | 134 | 0 |
| D | 0 | 134 | 0 |
| Mode M9 | |||
|---|---|---|---|
| Quadrant | BADHDUFLAG | Total packets | Discarded packets |
| A | 0 | 9 | 0 |
| B | 0 | 9 | 0 |
| C | 0 | 9 | 0 |
| D | 0 | 9 | 0 |
| Quadrant | Total seconds | Saturated seconds | Saturation percentage |
|---|---|---|---|
| A | 6696 | 92 | 1.373955% |
| B | 6692 | 117 | 1.748356% |
| C | 6691 | 46 | 0.687491% |
| D | 6694 | 122 | 1.822528% |
Noise dominated data is calculated using 1-second bins in cleaned event files. If a bin has >2000 counts, and if more than 50% of those come from <1% of pixels, then it is considered to be noise-dominated and hence unusable.
| Quadrant | # 1 sec bins | Bins with >0 counts | Bins with >2000 counts | High rate bins dominated by noise | Noise dominated (total time) | Noise dominated (detector-on time) | Marked lightcurve |
|---|---|---|---|---|---|---|---|
| A | 7531 | 6701 | 3 | 3 | 0.04% | 0.04% | 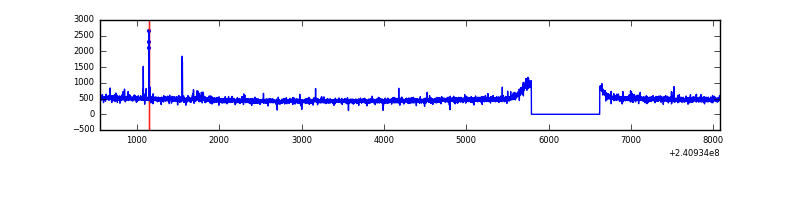 |
| B | 7531 | 6701 | 5 | 5 | 0.07% | 0.07% | 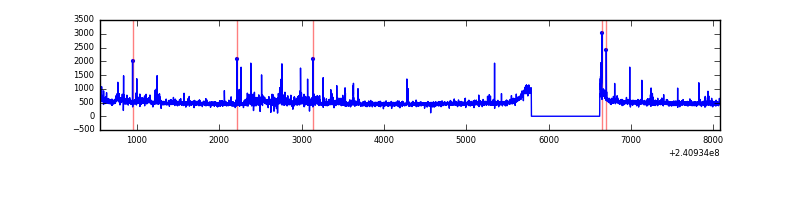 |
| C | 7531 | 6701 | 0 | 0 | 0.00% | 0.00% | 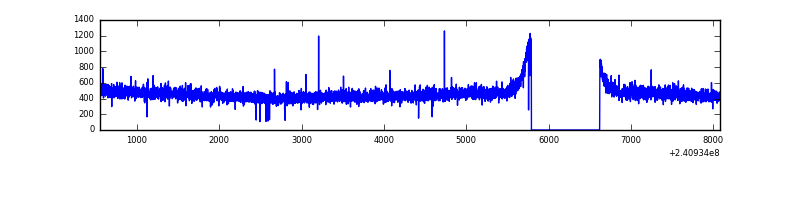 |
| D | 7531 | 6701 | 45 | 45 | 0.60% | 0.67% | 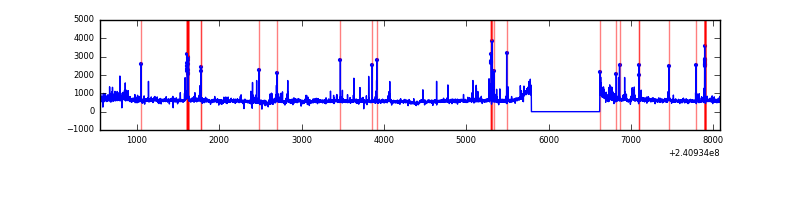 |
Top three noisy pixels from each quadrant. If the there are fewer than three noisy pixels in the level2.evt file, extra rows are filled as -1
| Pixel properties | Quadrant properties | ||||||
|---|---|---|---|---|---|---|---|
| Quadrant | DetID | PixID | Counts | Sigma | Mean | Median | Sigma |
| A | 15 | 174 | 24563 | 145.49 | 813 | 796 | 163.4 |
| A | 3 | 1 | 22481 | 132.75 | 813 | 796 | 163.4 |
| A | 8 | 15 | 9469 | 53.09 | 813 | 796 | 163.4 |
| B | 11 | 51 | 113888 | 732.57 | 808 | 790 | 154.4 |
| B | 4 | 239 | 50729 | 323.47 | 808 | 790 | 154.4 |
| B | 0 | 214 | 47413 | 301.99 | 808 | 790 | 154.4 |
| C | 0 | 207 | 15004 | 78.43 | 783 | 788 | 181.3 |
| C | 14 | 67 | 7073 | 34.67 | 783 | 788 | 181.3 |
| C | 13 | 61 | 5929 | 28.36 | 783 | 788 | 181.3 |
| D | 8 | 195 | 835665 | 4458.93 | 781 | 759 | 187.2 |
| D | 1 | 52 | 223152 | 1187.72 | 781 | 759 | 187.2 |
| D | 7 | 71 | 124261 | 659.58 | 781 | 759 | 187.2 |
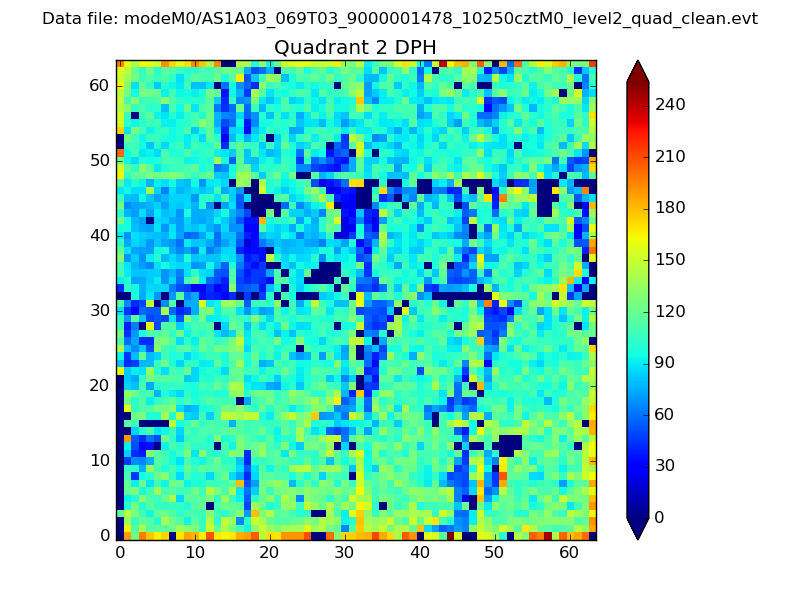
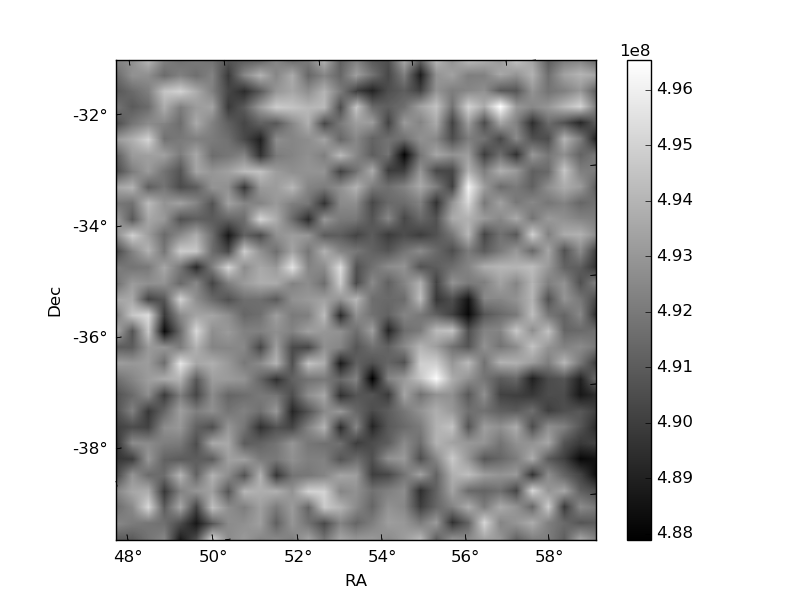
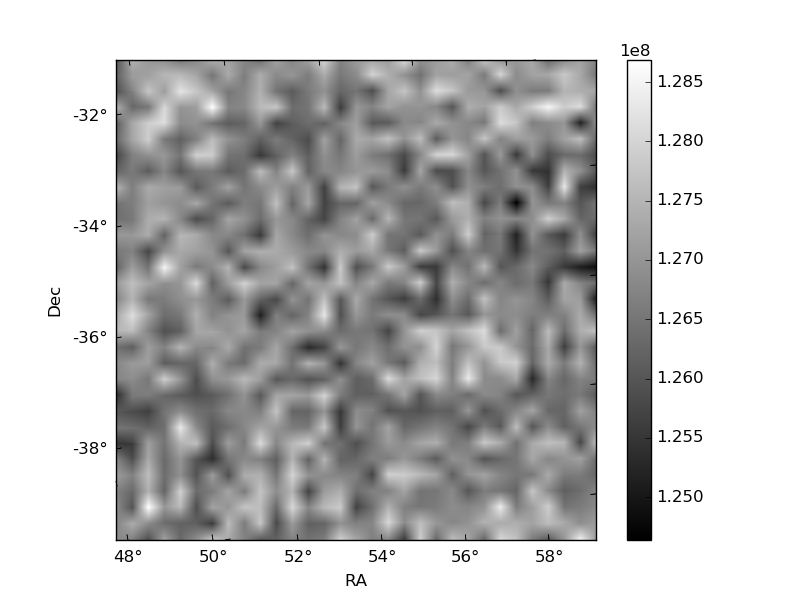
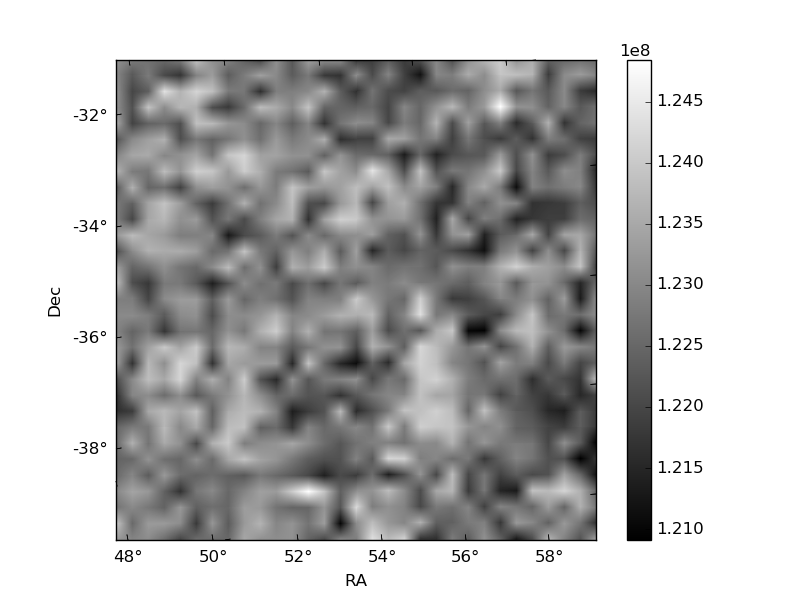
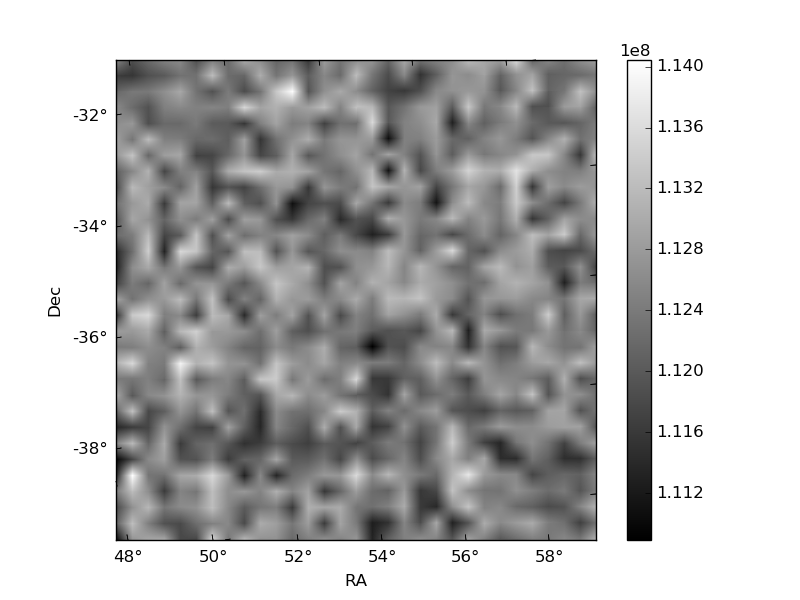
Histogram calculated using DETX and DETY for each event in the final _common_clean file
| Quadrant A | 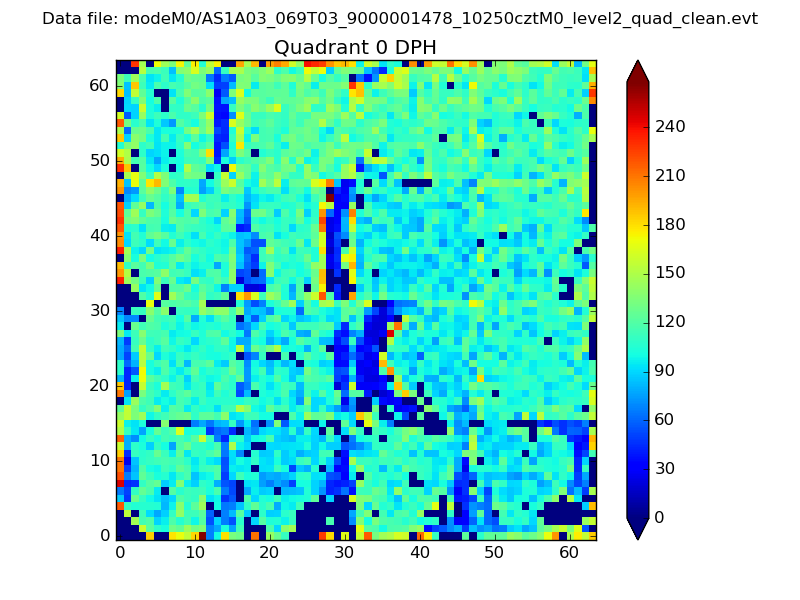 |
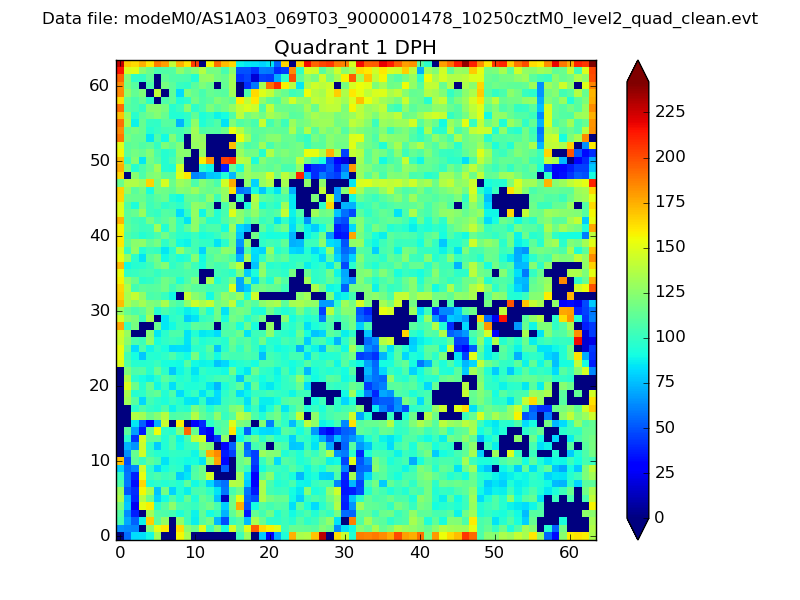 |
Quadrant B |
|---|---|---|---|
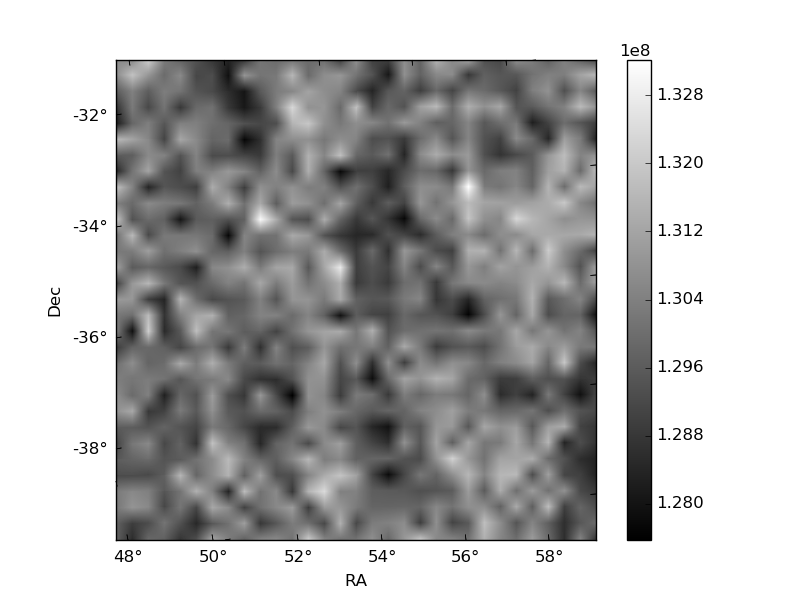
| Quadrant D | 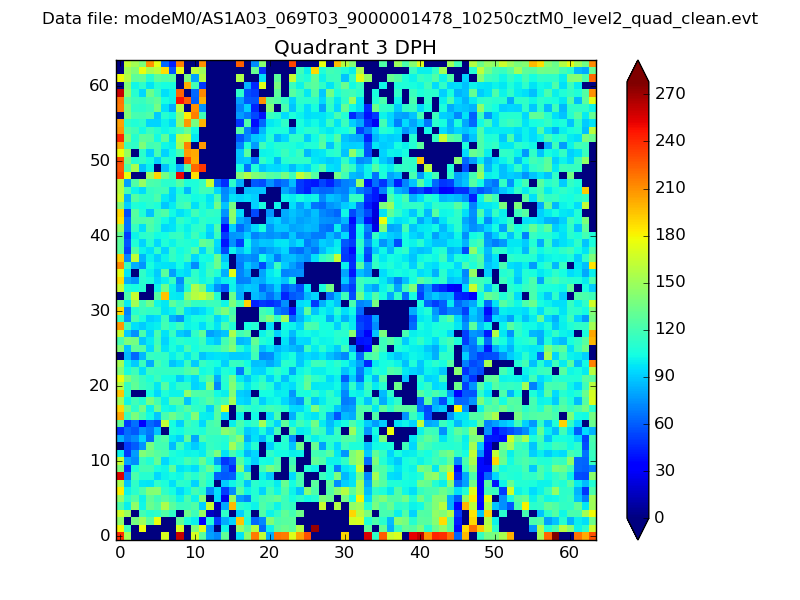 |
 |
Quadrant C |
| Plot type | Count rate plots | Images |
|---|---|---|
| Comparison with Poisson distribution Blue bars denote a histogram of data divided into 1 sec bins. Red curve is a Poisson curve with rate = median count rate of data. |
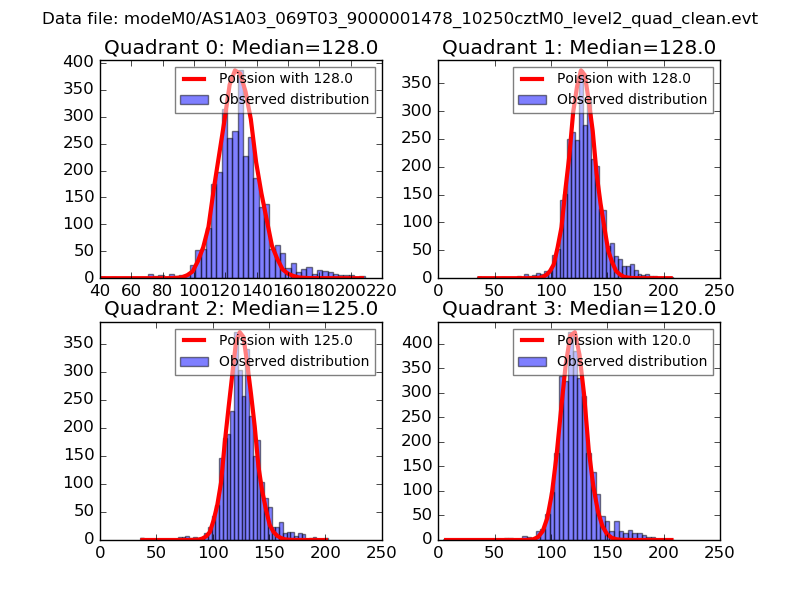 |
 |
| Quadrant-wise count rates Data is divided into 100 sec bins |
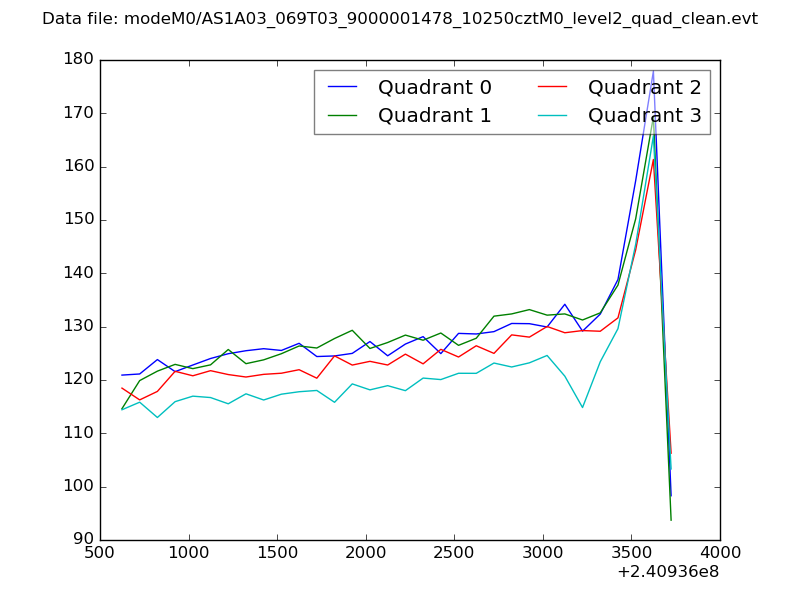 |
|
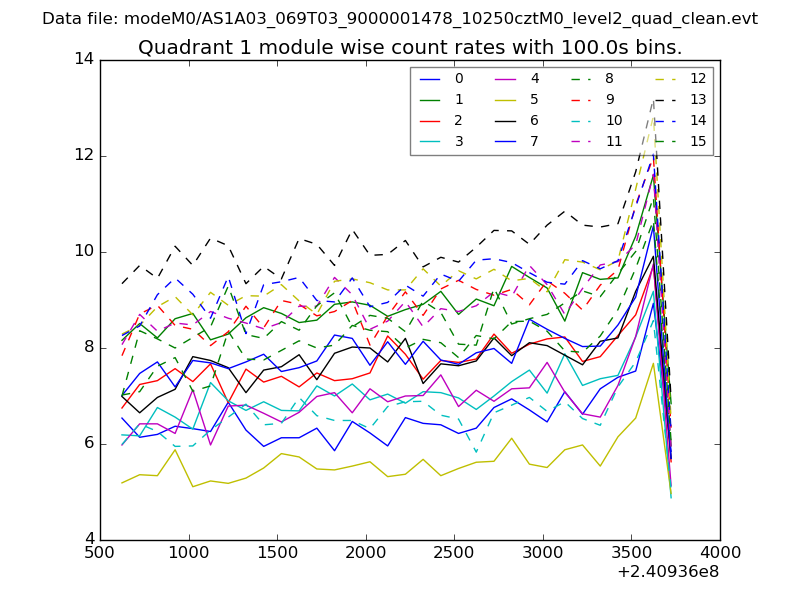
| Module-wise count rates for Quadrant A Data is divided into 100 sec bins |
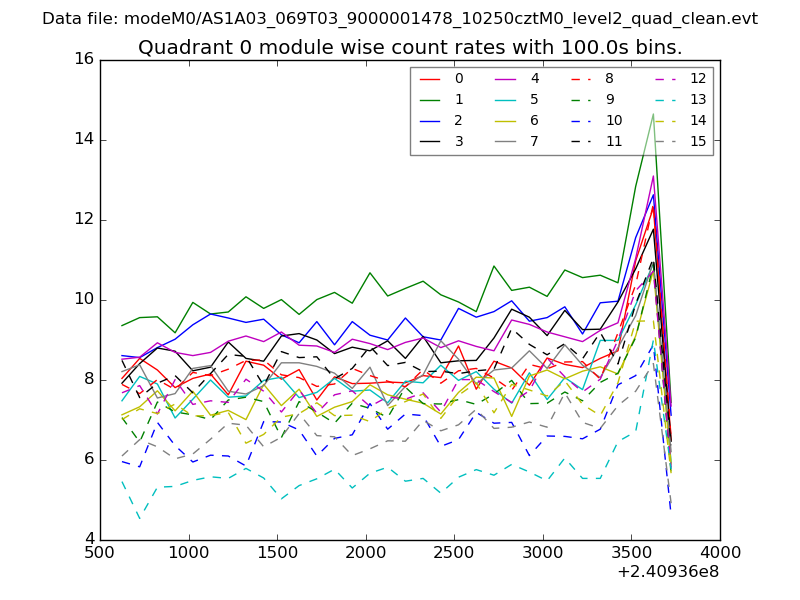 |
 |
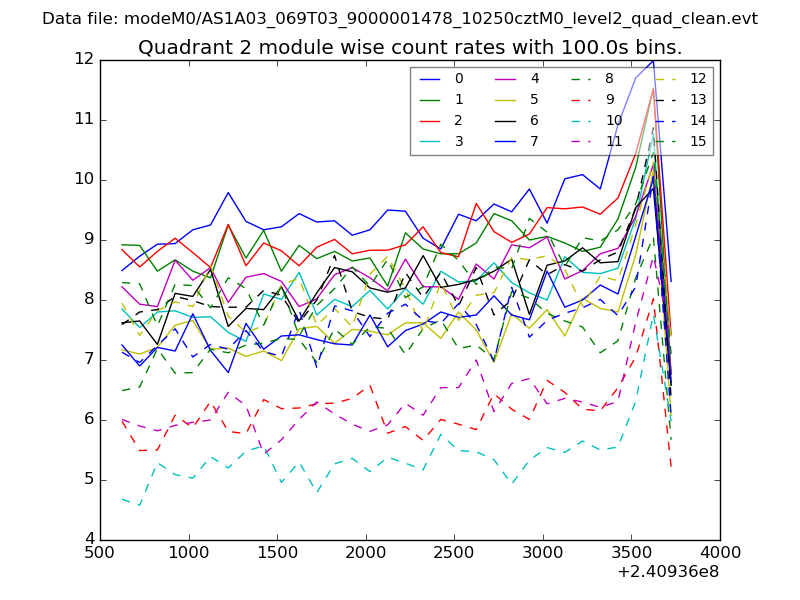
| Module-wise count rates for Quadrant B Data is divided into 100 sec bins |
 |
 |
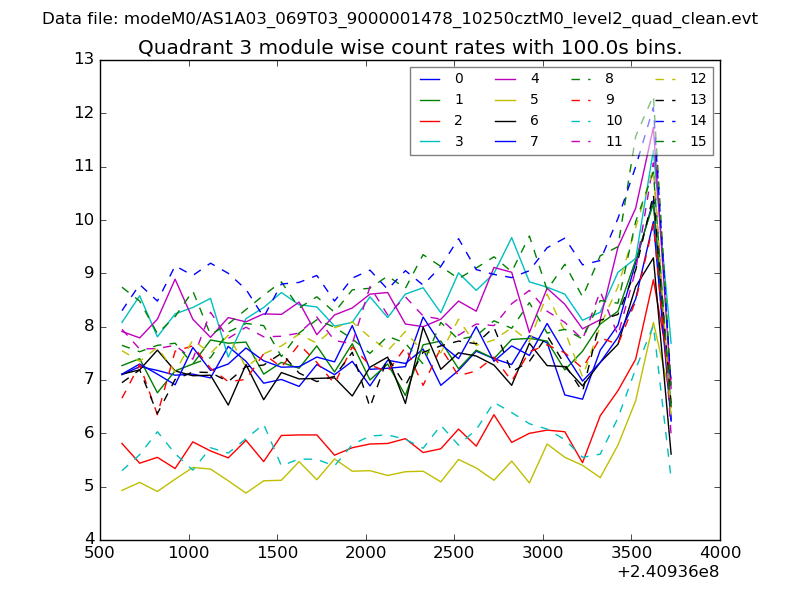
| Module-wise count rates for Quadrant C Data is divided into 100 sec bins |
 |
 |
| Module-wise count rates for Quadrant D Data is divided into 100 sec bins |
 |
 |
| Parameter | Plot |
|---|---|
| CZT HV Monitor | 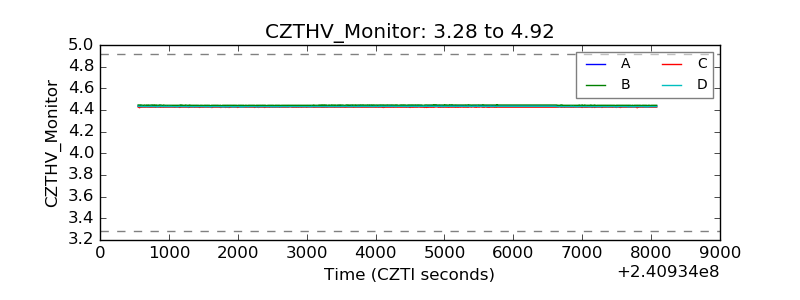 |
| D_VDD | 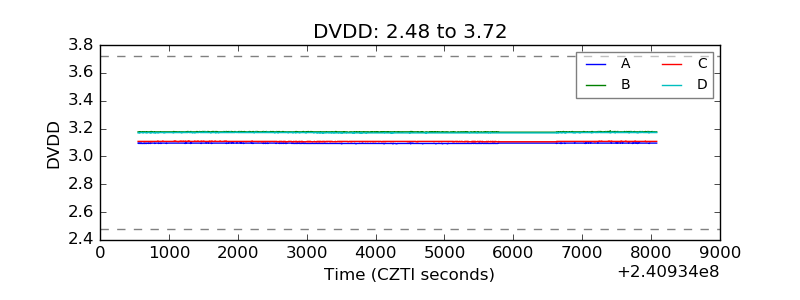 |
| Temperature 1 | 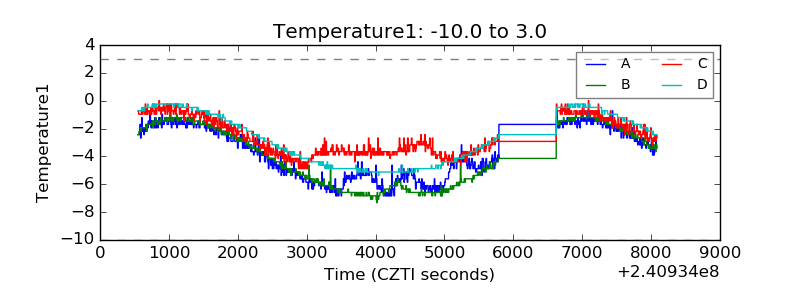 |
| Veto HV Monitor | 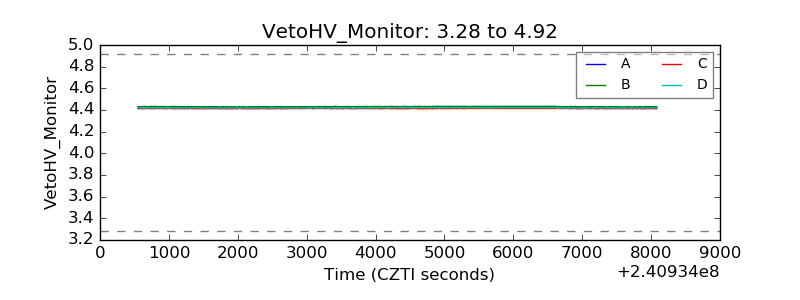 |
| Veto LLD | 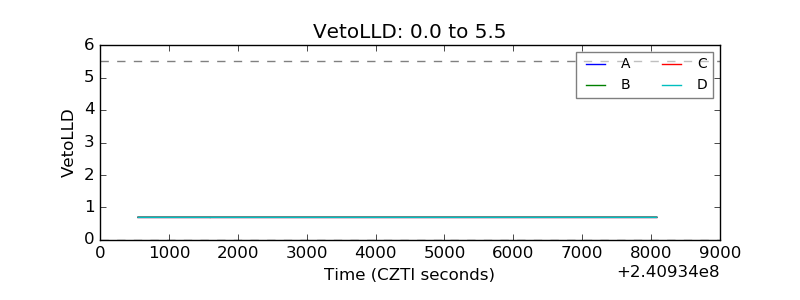 |
| Alpha Counter | 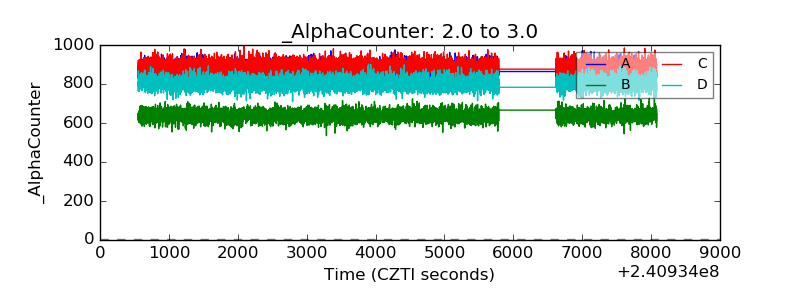 |
| _CPM_Rate | 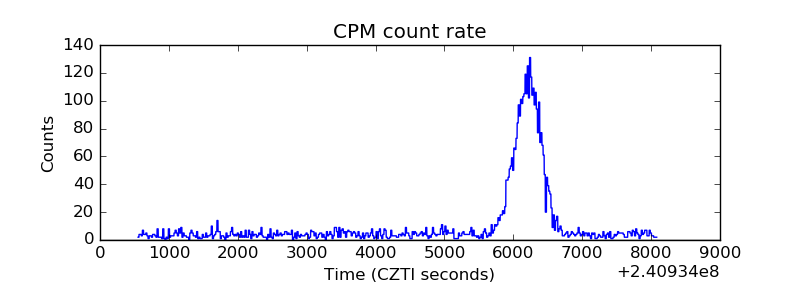 |
| CZT Counter | 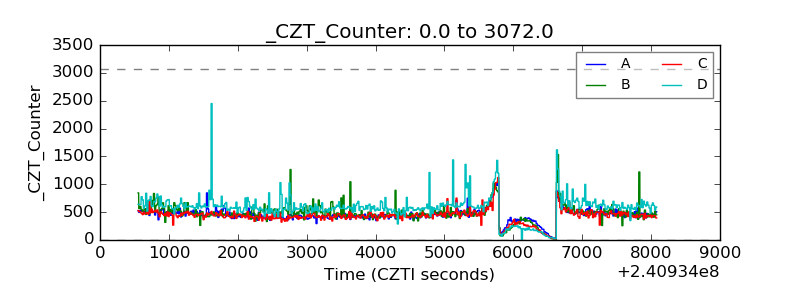 |
| +2.5 Volts monitor | 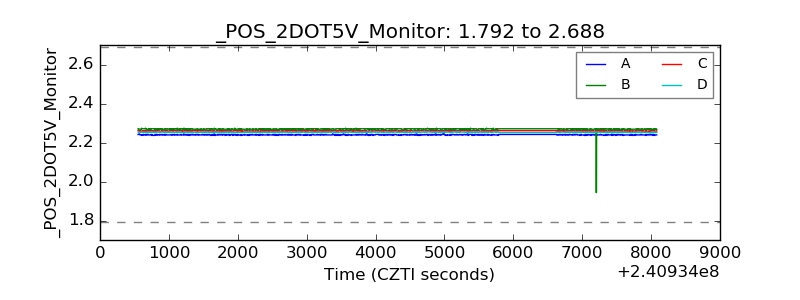 |
| +5 Volts monitor | 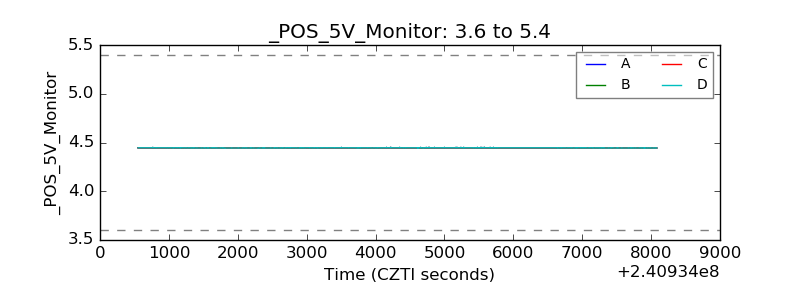 |
| _ROLL_ROT | 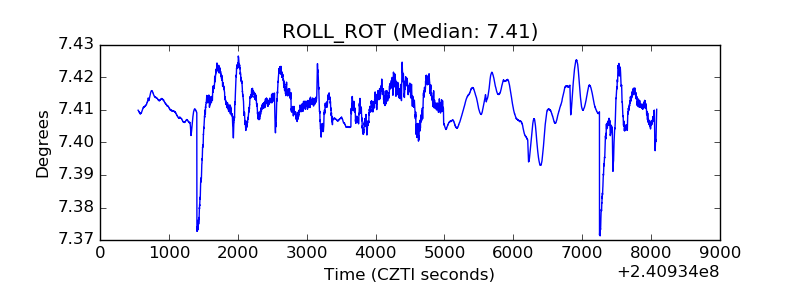 |
| _Roll_DEC | 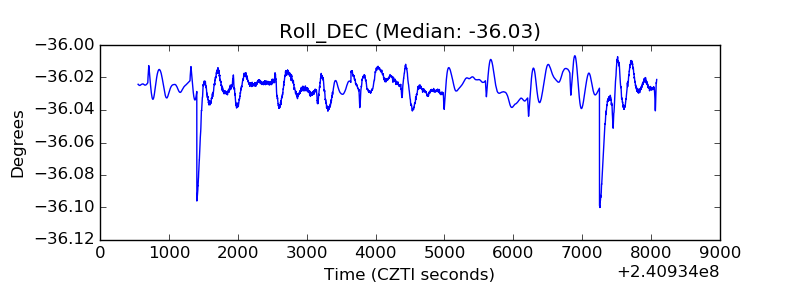 |
| _Roll_RA |  |
| Veto Counter | 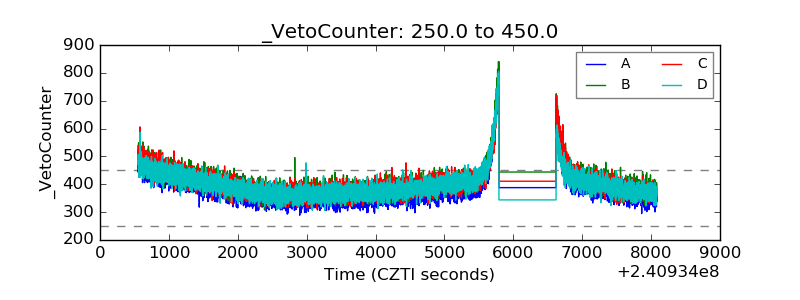 |