| Param | Original file | Final file |
|---|---|---|
| Filename | modeM0/AS1G07_011T03_9000001476_10242cztM0_level2.evt | modeM0/AS1G07_011T03_9000001476_10242cztM0_level2_quad_clean.evt |
| Size (bytes) | 174,787,200 | 33,376,320 |
| Size | 166.7 MB | 31.8 MB |
| Events in quadrant A | 1,198,497 | 219,349 |
| Events in quadrant B | 1,245,919 | 213,151 |
| Events in quadrant C | 1,184,440 | 221,872 |
| Events in quadrant D | 1,491,033 | 175,337 |
| Mode SS | |||
|---|---|---|---|
| Quadrant | BADHDUFLAG | Total packets | Discarded packets |
| A | 0 | 132 | 78 |
| B | 0 | 132 | 74 |
| C | 0 | 132 | 74 |
| D | 0 | 126 | 64 |
| Mode M0 | |||
|---|---|---|---|
| Quadrant | BADHDUFLAG | Total packets | Discarded packets |
| A | 0 | 12325 | 7131 |
| B | 0 | 13821 | 8638 |
| C | 0 | 12719 | 7498 |
| D | 0 | 16722 | 10721 |
| Mode M9 | |||
|---|---|---|---|
| Quadrant | BADHDUFLAG | Total packets | Discarded packets |
| A | 0 | 16 | 7 |
| B | 0 | 18 | 9 |
| C | 0 | 18 | 9 |
| D | 0 | 17 | 8 |
| Quadrant | Total seconds | Saturated seconds | Saturation percentage |
|---|---|---|---|
| A | 2556 | 7 | 0.273865% |
| B | 2462 | 9 | 0.365556% |
| C | 2583 | 4 | 0.154859% |
| D | 2399 | 7 | 0.291788% |
Noise dominated data is calculated using 1-second bins in cleaned event files. If a bin has >2000 counts, and if more than 50% of those come from <1% of pixels, then it is considered to be noise-dominated and hence unusable.
| Quadrant | # 1 sec bins | Bins with >0 counts | Bins with >2000 counts | High rate bins dominated by noise | Noise dominated (total time) | Noise dominated (detector-on time) | Marked lightcurve |
|---|---|---|---|---|---|---|---|
| A | 4101 | 3021 | 0 | 0 | 0.00% | 0.00% | 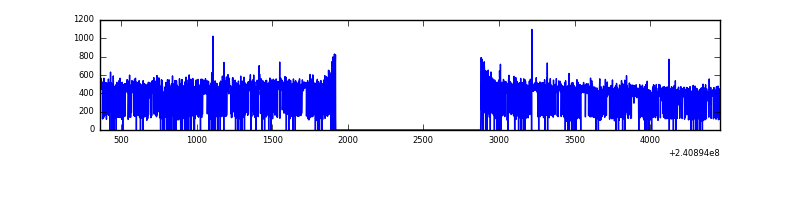 |
| B | 4097 | 2965 | 0 | 0 | 0.00% | 0.00% | 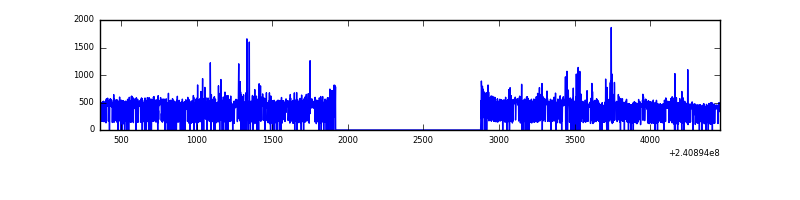 |
| C | 4099 | 3028 | 0 | 0 | 0.00% | 0.00% | 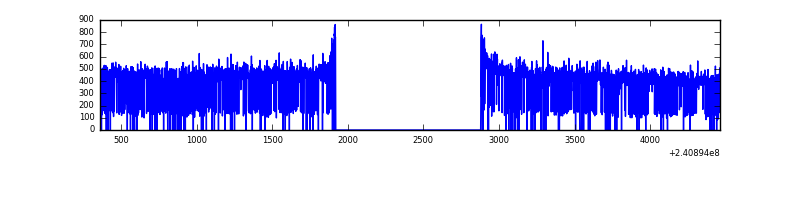 |
| D | 4099 | 2712 | 0 | 0 | 0.00% | 0.00% | 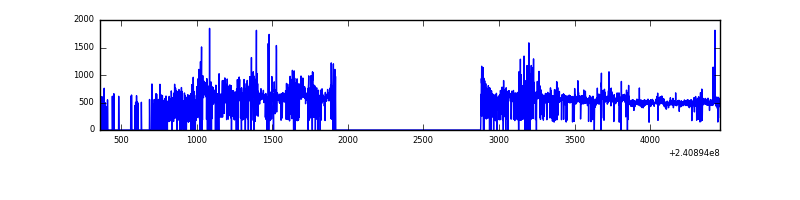 |
Top three noisy pixels from each quadrant. If the there are fewer than three noisy pixels in the level2.evt file, extra rows are filled as -1
| Pixel properties | Quadrant properties | ||||||
|---|---|---|---|---|---|---|---|
| Quadrant | DetID | PixID | Counts | Sigma | Mean | Median | Sigma |
| A | 8 | 15 | 5667 | 82.28 | 307 | 301 | 65.2 |
| A | 15 | 174 | 3371 | 47.07 | 307 | 301 | 65.2 |
| A | 4 | 2 | 2975 | 41.0 | 307 | 301 | 65.2 |
| B | 4 | 239 | 30064 | 506.76 | 298 | 292 | 58.8 |
| B | 10 | 247 | 22079 | 370.84 | 298 | 292 | 58.8 |
| B | 0 | 214 | 10665 | 176.56 | 298 | 292 | 58.8 |
| C | 9 | 68 | 4974 | 65.57 | 300 | 302 | 71.3 |
| C | 14 | 67 | 3946 | 51.14 | 300 | 302 | 71.3 |
| C | 13 | 61 | 2304 | 28.1 | 300 | 302 | 71.3 |
| D | 8 | 195 | 234185 | 3452.86 | 275 | 266 | 67.7 |
| D | 1 | 52 | 93599 | 1377.68 | 275 | 266 | 67.7 |
| D | 2 | 16 | 43888 | 643.9 | 275 | 266 | 67.7 |
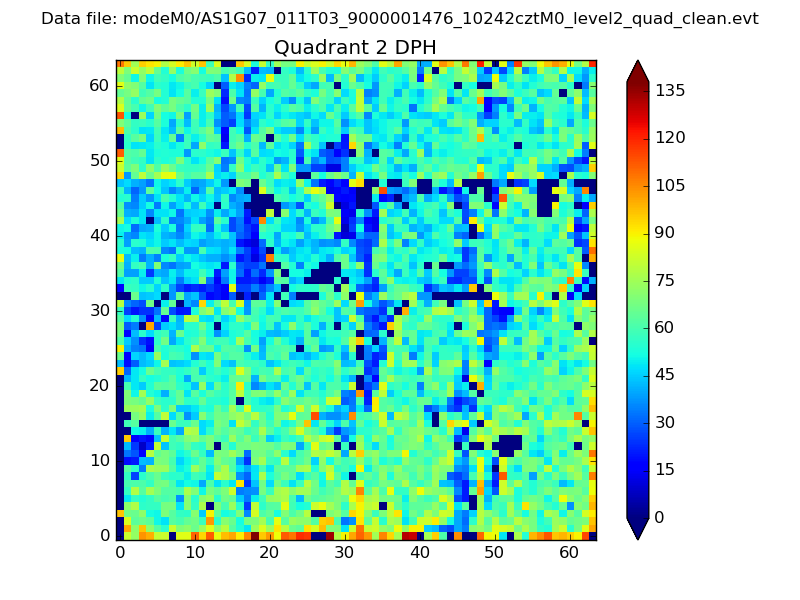
Histogram calculated using DETX and DETY for each event in the final _common_clean file
| Quadrant A | 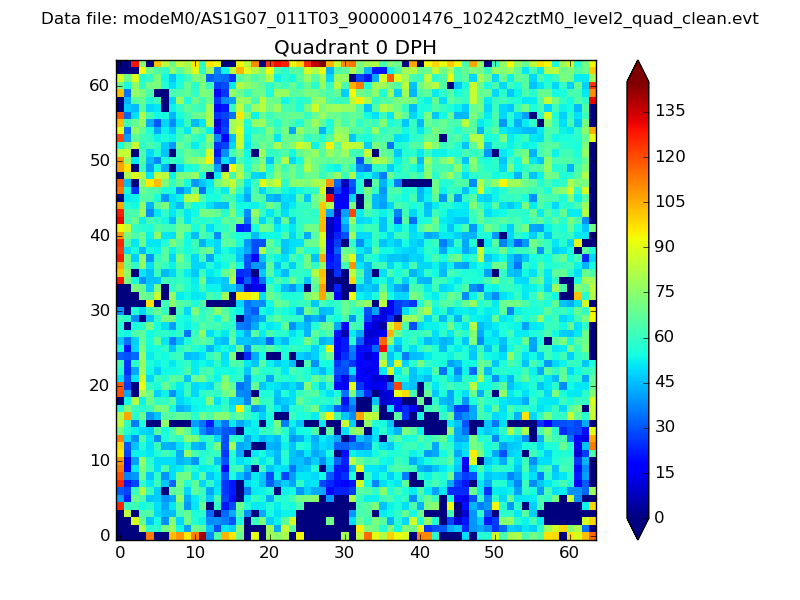 |
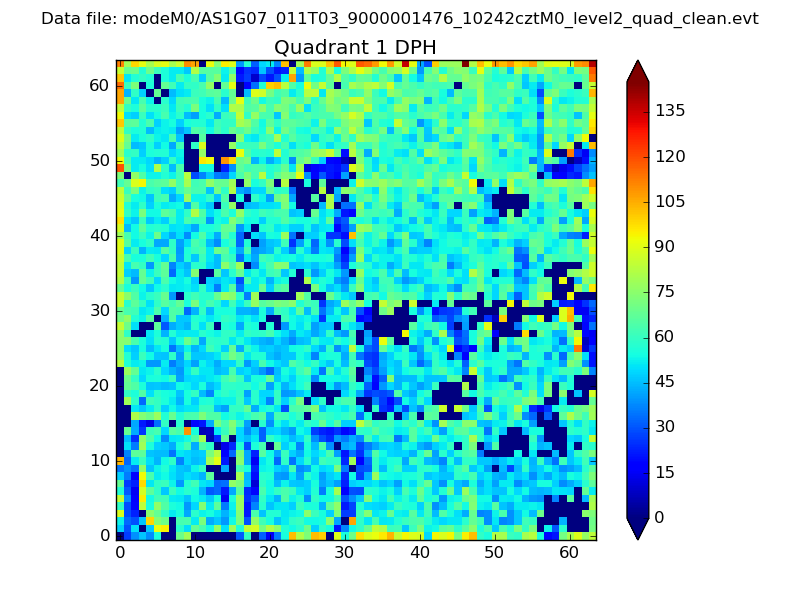 |
Quadrant B |
|---|---|---|---|
| Quadrant D | 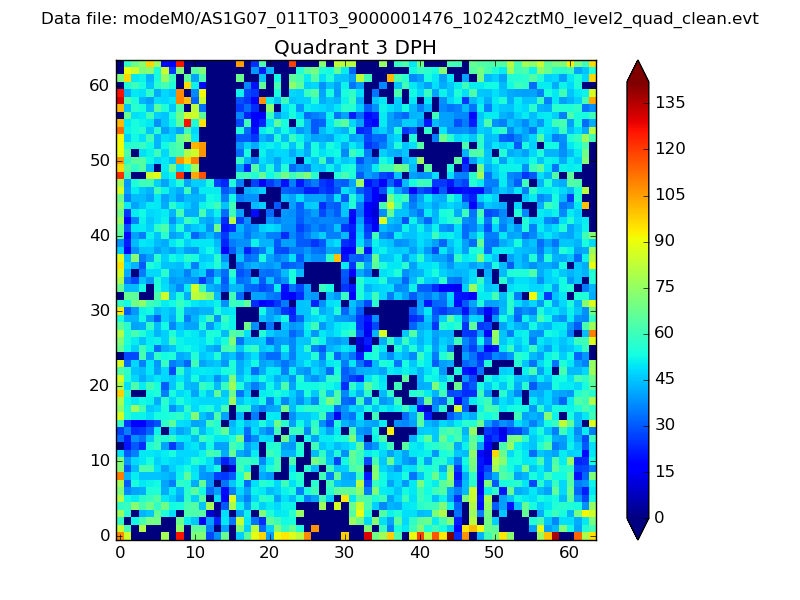 |
 |
Quadrant C |
| Plot type | Count rate plots | Images |
|---|---|---|
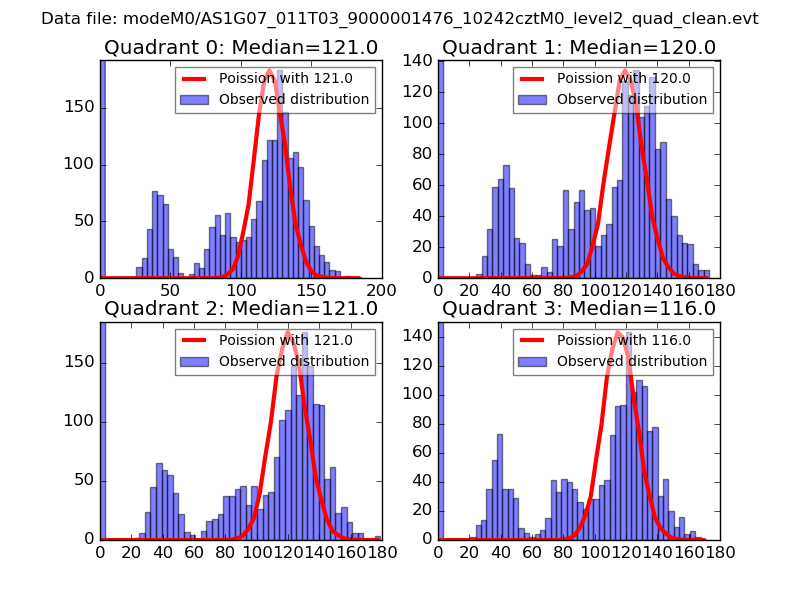
| Comparison with Poisson distribution Blue bars denote a histogram of data divided into 1 sec bins. Red curve is a Poisson curve with rate = median count rate of data. |
 |
 |
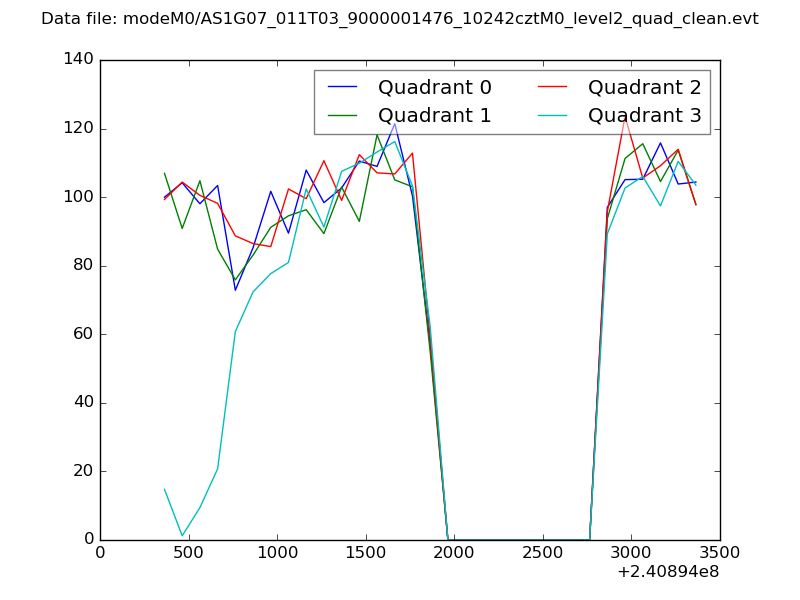
| Quadrant-wise count rates Data is divided into 100 sec bins |
 |
|
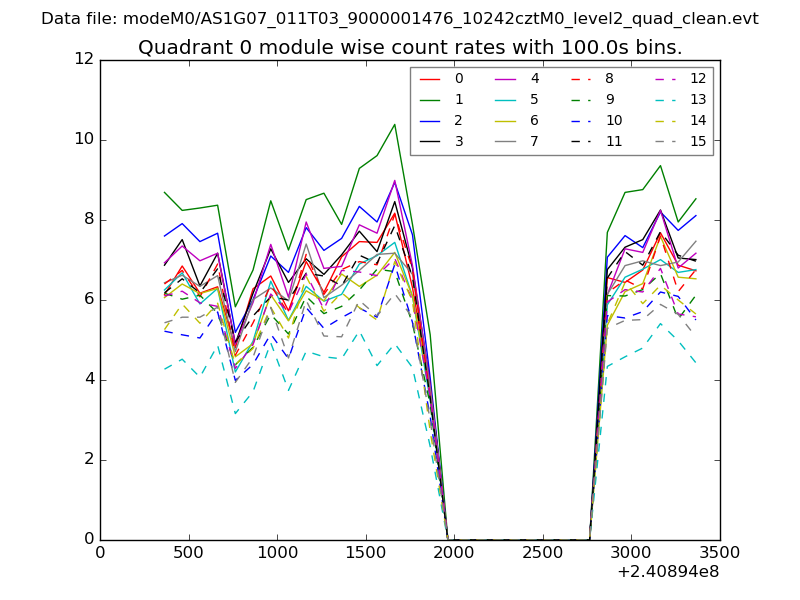
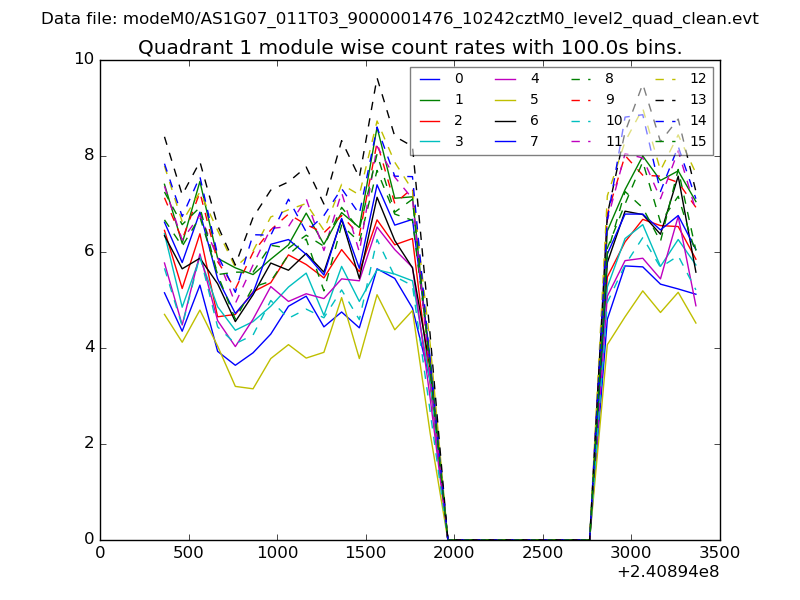
| Module-wise count rates for Quadrant A Data is divided into 100 sec bins |
 |
 |
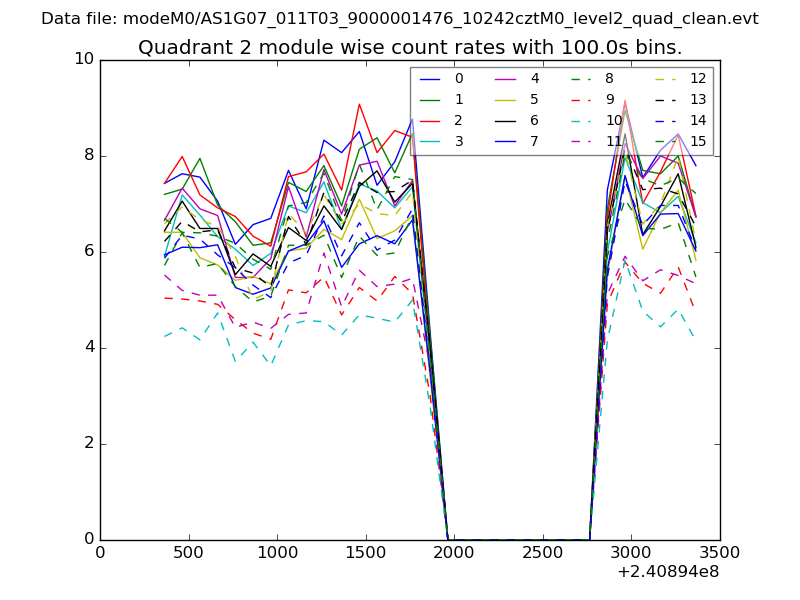
| Module-wise count rates for Quadrant B Data is divided into 100 sec bins |
 |
 |
| Module-wise count rates for Quadrant C Data is divided into 100 sec bins |
 |
 |
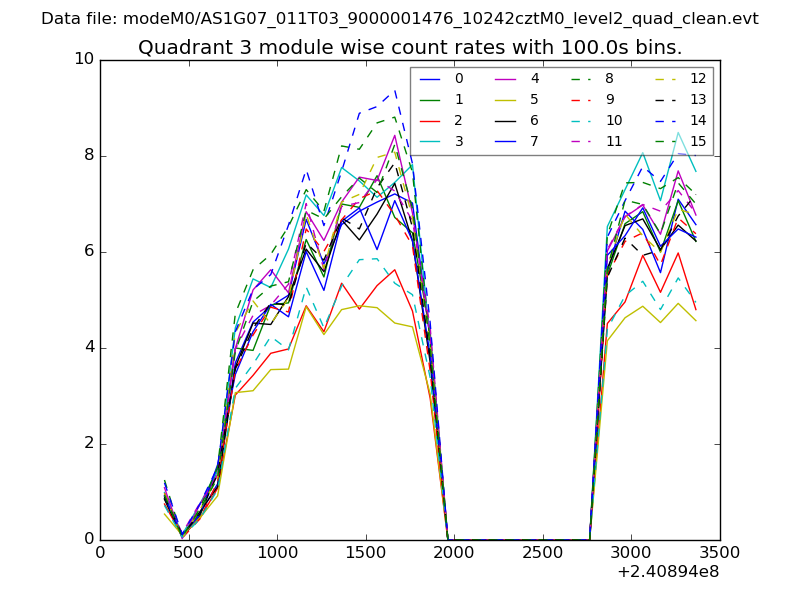
| Module-wise count rates for Quadrant D Data is divided into 100 sec bins |
 |
 |
| Parameter | Plot |
|---|---|
| CZT HV Monitor | 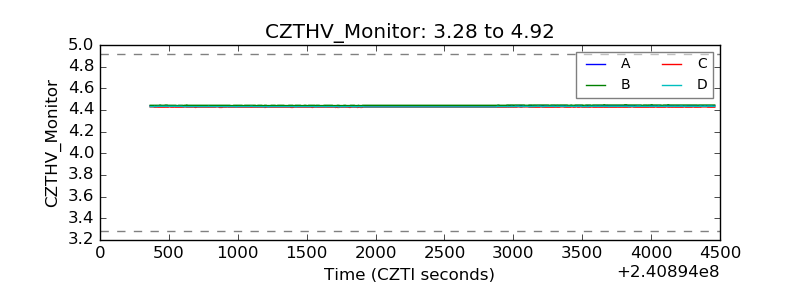 |
| D_VDD | 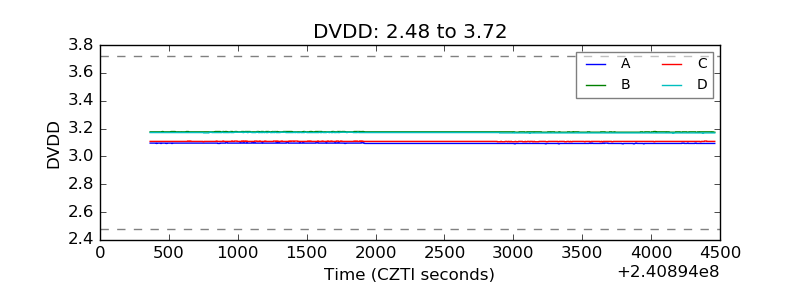 |
| Temperature 1 | 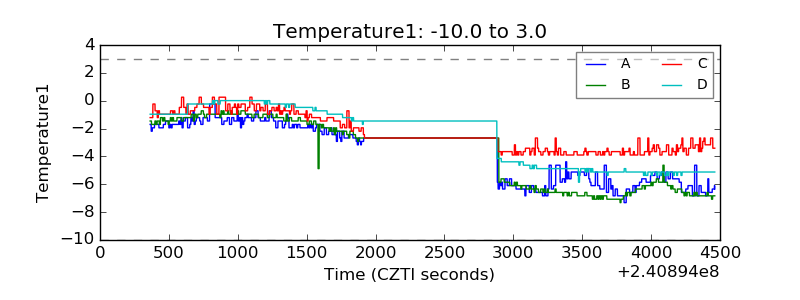 |
| Veto HV Monitor | 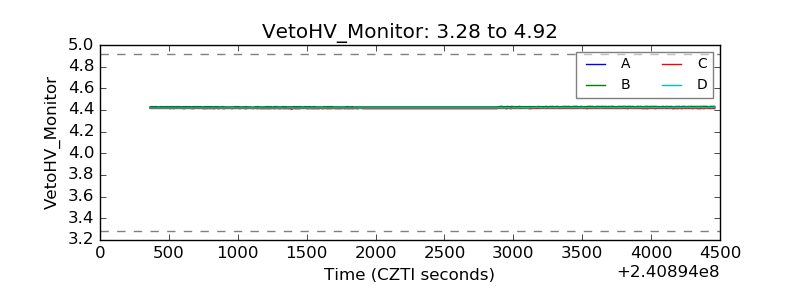 |
| Veto LLD | 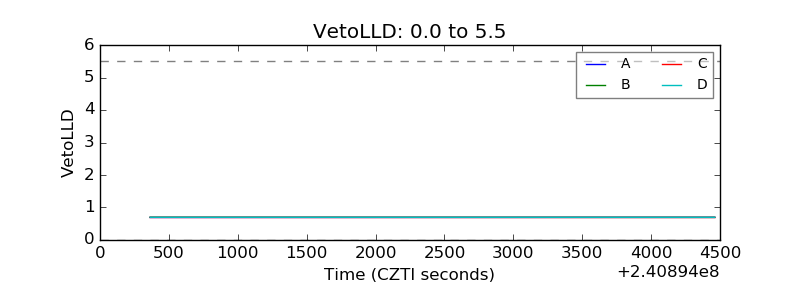 |
| Alpha Counter | 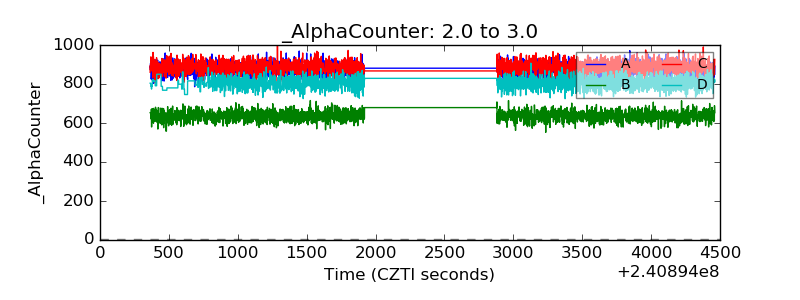 |
| _CPM_Rate | 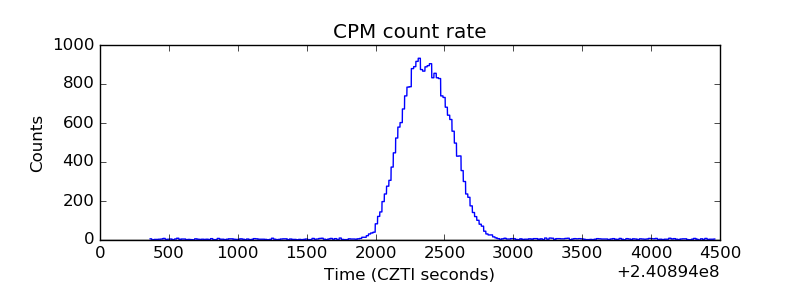 |
| CZT Counter |  |
| +2.5 Volts monitor |  |
| +5 Volts monitor |  |
| _ROLL_ROT | 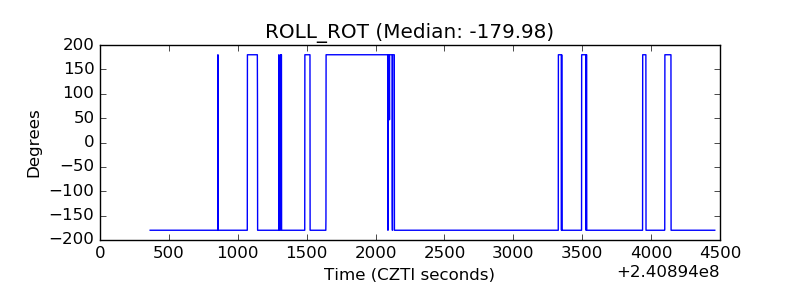 |
| _Roll_DEC | 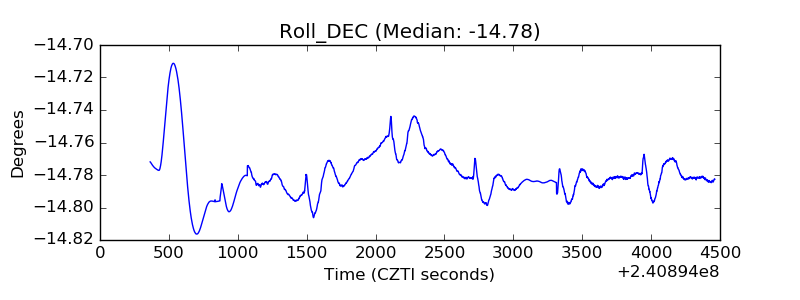 |
| _Roll_RA | 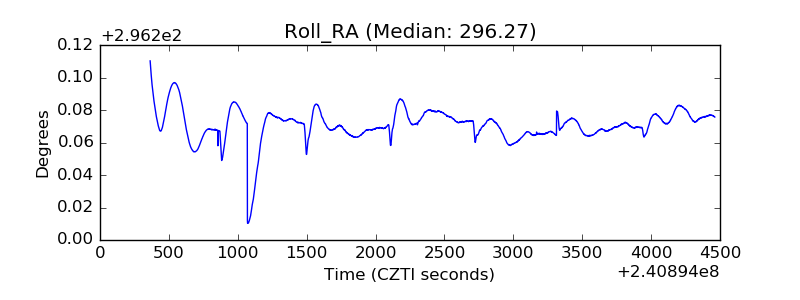 |
| Veto Counter | 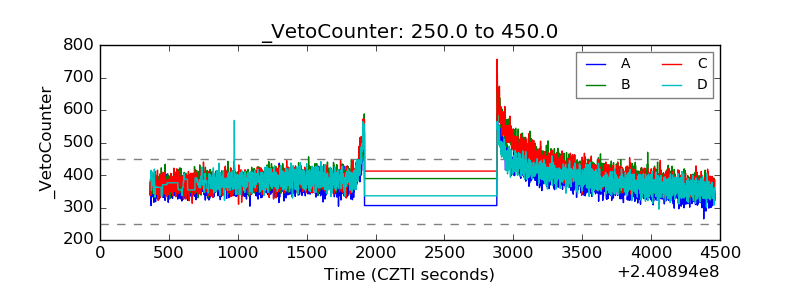 |