| Param | Original file | Final file |
|---|---|---|
| Filename | modeM0/AS1G07_011T03_9000001476_10243cztM0_level2.evt | modeM0/AS1G07_011T03_9000001476_10243cztM0_level2_quad_clean.evt |
| Size (bytes) | 480,326,400 | 67,968,000 |
| Size | 458.1 MB | 64.8 MB |
| Events in quadrant A | 3,078,637 | 404,312 |
| Events in quadrant B | 3,463,389 | 404,033 |
| Events in quadrant C | 3,019,703 | 405,152 |
| Events in quadrant D | 4,533,197 | 380,405 |
| Mode SS | |||
|---|---|---|---|
| Quadrant | BADHDUFLAG | Total packets | Discarded packets |
| A | 0 | 136 | 0 |
| B | 0 | 136 | 0 |
| C | 0 | 136 | 0 |
| D | 0 | 136 | 0 |
| Mode M0 | |||
|---|---|---|---|
| Quadrant | BADHDUFLAG | Total packets | Discarded packets |
| A | 0 | 13608 | 5 |
| B | 0 | 14574 | 2 |
| C | 0 | 13522 | 4 |
| D | 0 | 17922 | 2 |
| Mode M9 | |||
|---|---|---|---|
| Quadrant | BADHDUFLAG | Total packets | Discarded packets |
| A | 0 | 14 | 0 |
| B | 0 | 14 | 0 |
| C | 0 | 14 | 0 |
| D | 0 | 15 | 0 |
| Quadrant | Total seconds | Saturated seconds | Saturation percentage |
|---|---|---|---|
| A | 6651 | 25 | 0.375883% |
| B | 6652 | 90 | 1.352977% |
| C | 6651 | 22 | 0.330777% |
| D | 6652 | 97 | 1.458208% |
Noise dominated data is calculated using 1-second bins in cleaned event files. If a bin has >2000 counts, and if more than 50% of those come from <1% of pixels, then it is considered to be noise-dominated and hence unusable.
| Quadrant | # 1 sec bins | Bins with >0 counts | Bins with >2000 counts | High rate bins dominated by noise | Noise dominated (total time) | Noise dominated (detector-on time) | Marked lightcurve |
|---|---|---|---|---|---|---|---|
| A | 7762 | 6653 | 0 | 0 | 0.00% | 0.00% | 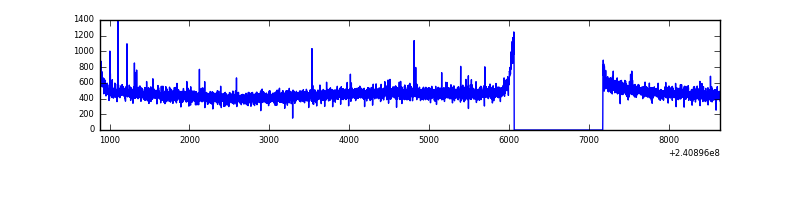 |
| B | 7762 | 6653 | 45 | 45 | 0.58% | 0.68% | 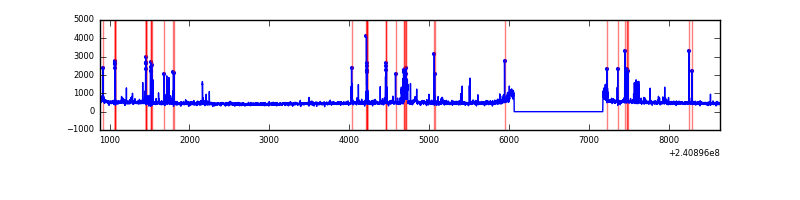 |
| C | 7762 | 6653 | 0 | 0 | 0.00% | 0.00% | 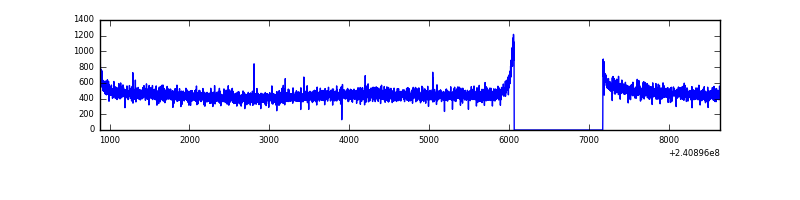 |
| D | 7762 | 6653 | 60 | 60 | 0.77% | 0.90% | 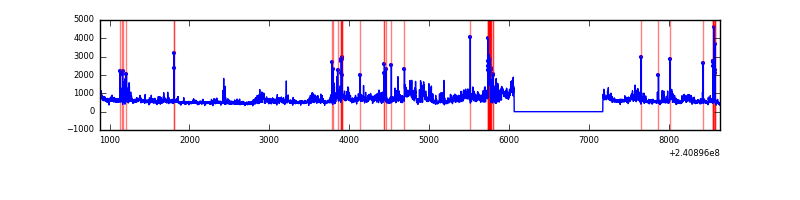 |
Top three noisy pixels from each quadrant. If the there are fewer than three noisy pixels in the level2.evt file, extra rows are filled as -1
| Pixel properties | Quadrant properties | ||||||
|---|---|---|---|---|---|---|---|
| Quadrant | DetID | PixID | Counts | Sigma | Mean | Median | Sigma |
| A | 8 | 15 | 10375 | 59.68 | 793 | 777 | 160.8 |
| A | 0 | 226 | 7246 | 40.23 | 793 | 777 | 160.8 |
| A | 12 | 194 | 6544 | 35.86 | 793 | 777 | 160.8 |
| B | 10 | 247 | 130531 | 851.59 | 796 | 778 | 152.4 |
| B | 0 | 219 | 111032 | 723.62 | 796 | 778 | 152.4 |
| B | 4 | 239 | 78794 | 512.03 | 796 | 778 | 152.4 |
| C | 13 | 61 | 5811 | 28.21 | 770 | 775 | 178.5 |
| C | 0 | 207 | 5458 | 26.24 | 770 | 775 | 178.5 |
| C | 14 | 67 | 5186 | 24.71 | 770 | 775 | 178.5 |
| D | 1 | 52 | 688270 | 3728.69 | 758 | 737 | 184.4 |
| D | 8 | 195 | 569835 | 3086.38 | 758 | 737 | 184.4 |
| D | 2 | 152 | 87526 | 470.68 | 758 | 737 | 184.4 |
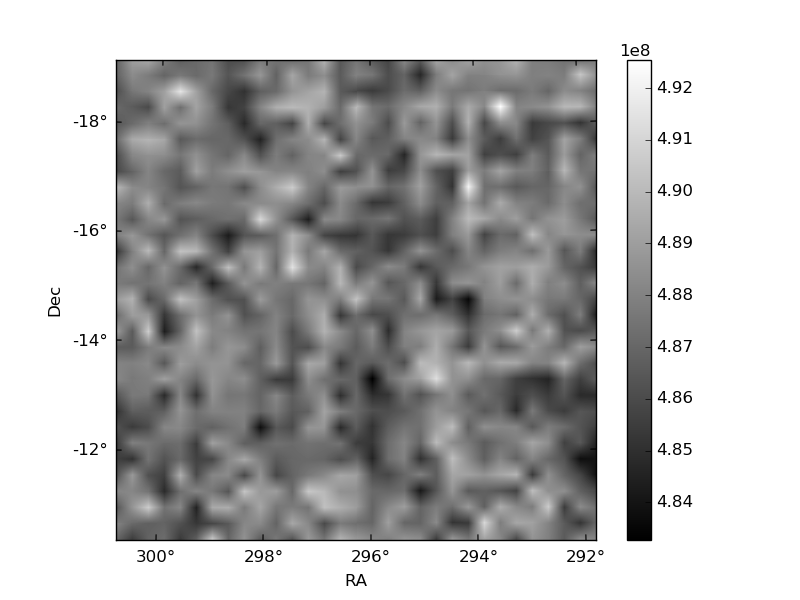
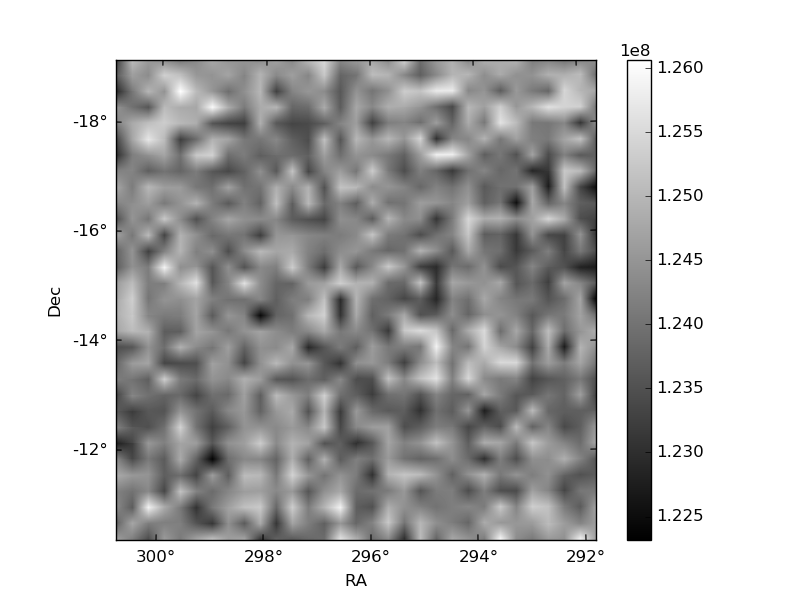
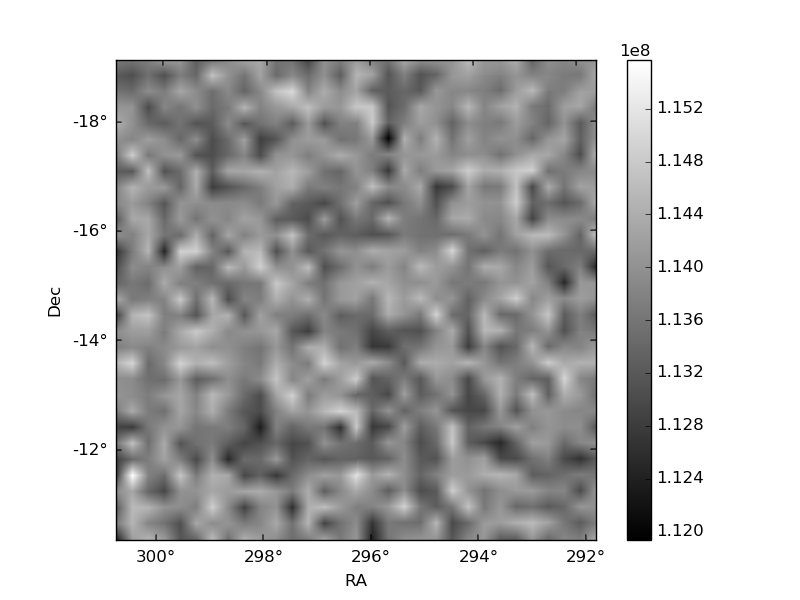
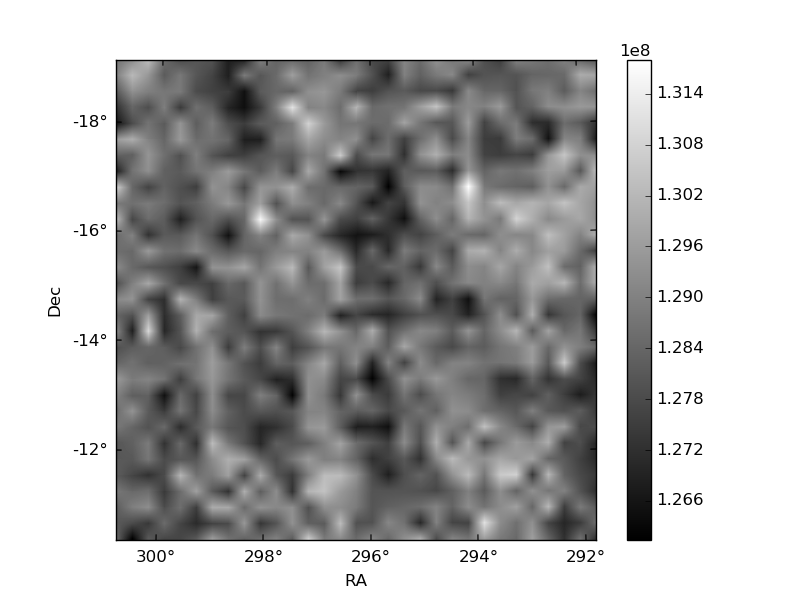
Histogram calculated using DETX and DETY for each event in the final _common_clean file
| Quadrant A | 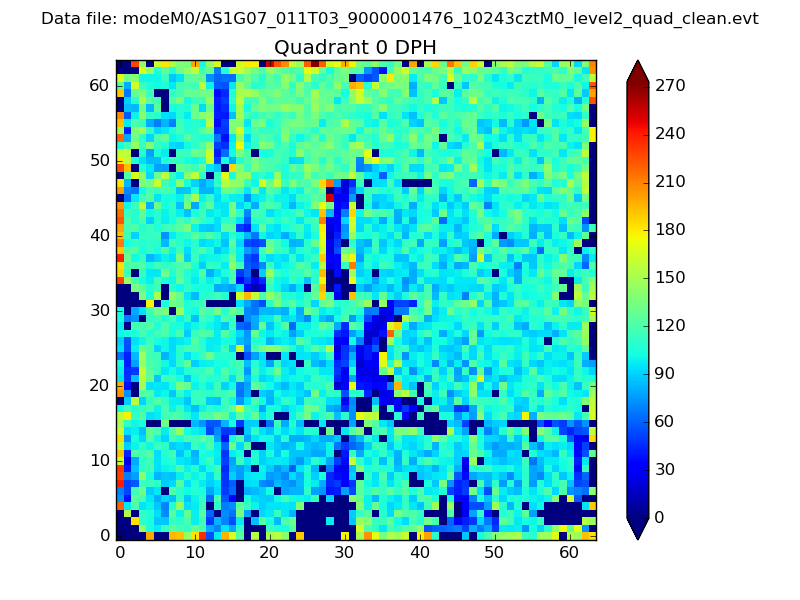 |
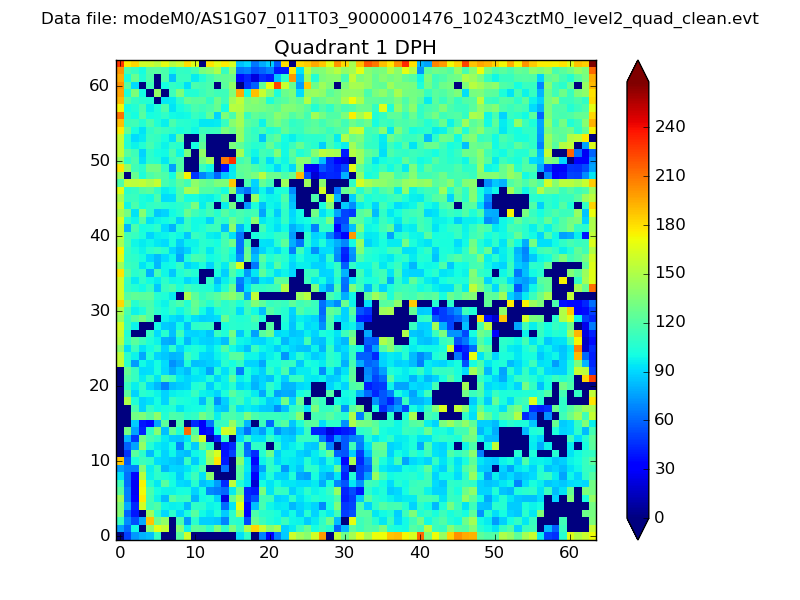 |
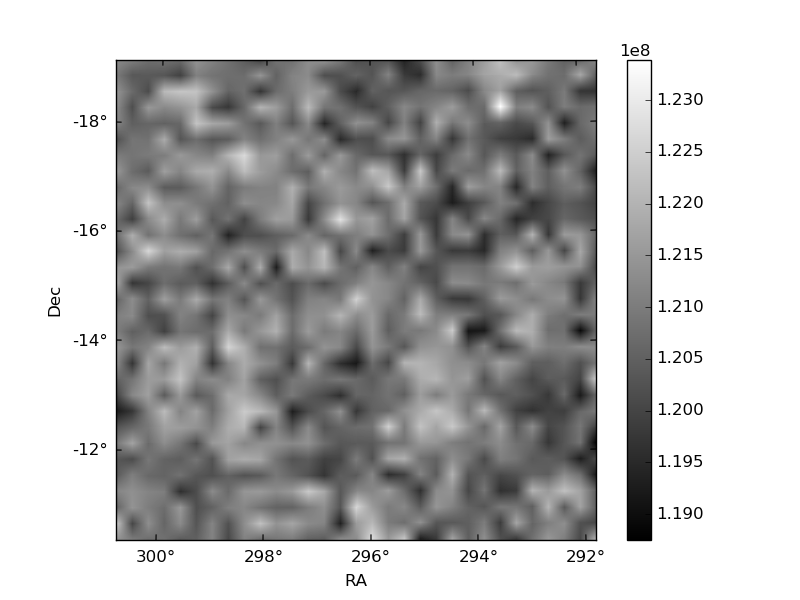
Quadrant B |
|---|---|---|---|
| Quadrant D | 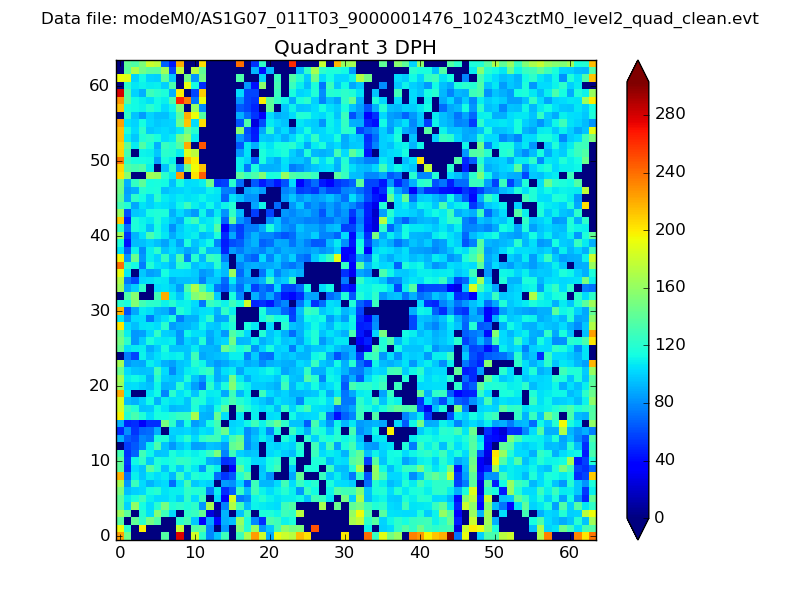 |
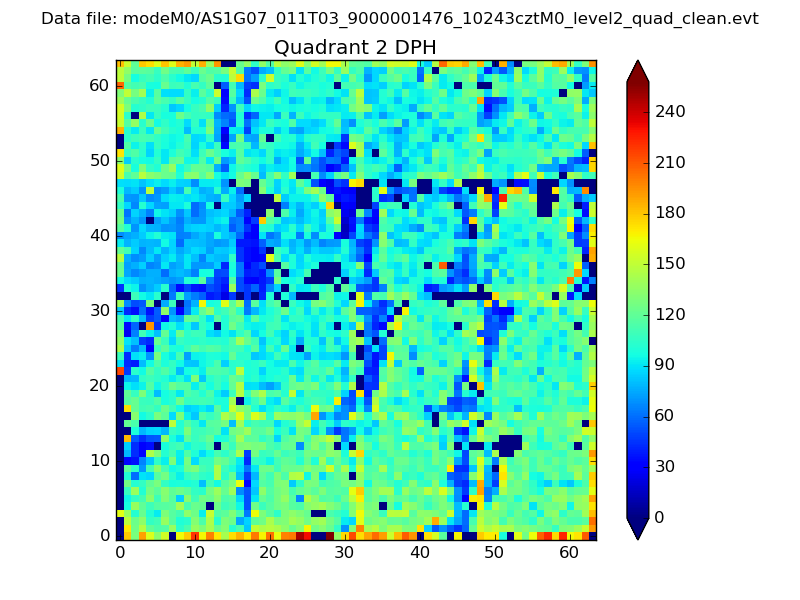 |
Quadrant C |
| Plot type | Count rate plots | Images |
|---|---|---|
| Comparison with Poisson distribution Blue bars denote a histogram of data divided into 1 sec bins. Red curve is a Poisson curve with rate = median count rate of data. |
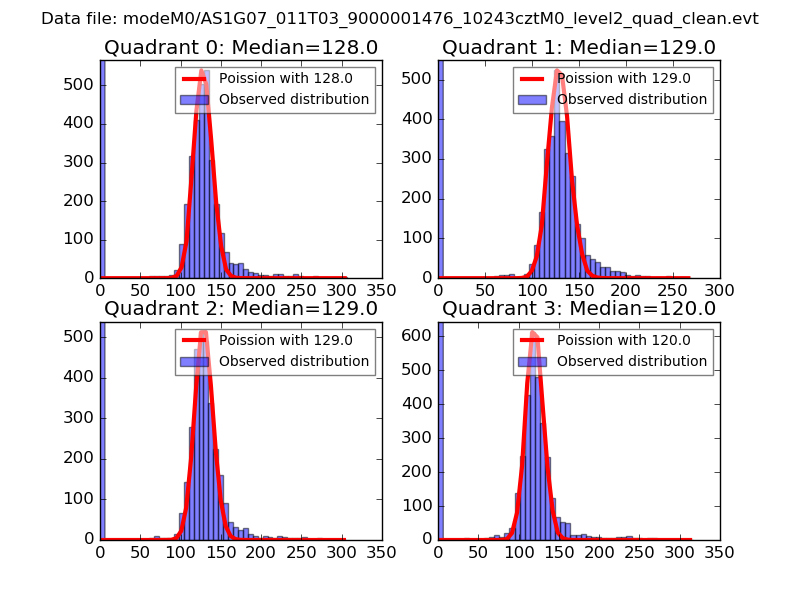 |
 |
| Quadrant-wise count rates Data is divided into 100 sec bins |
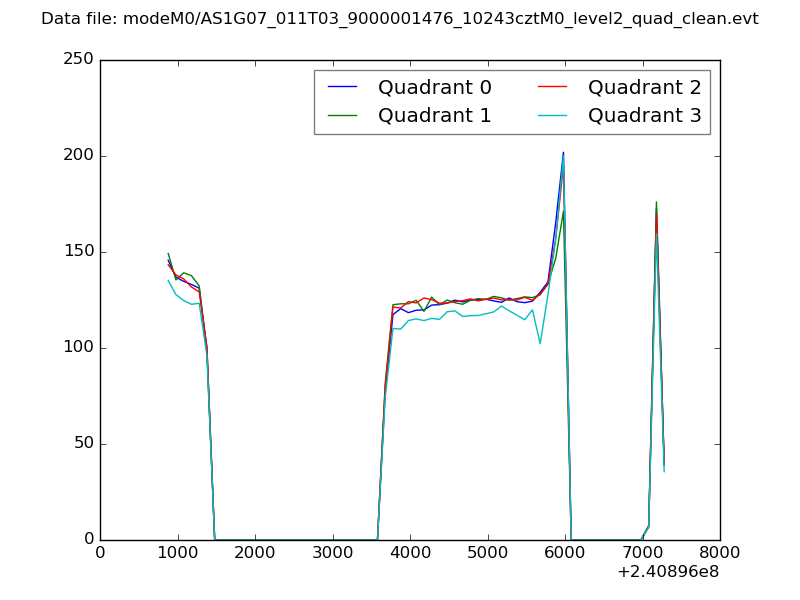 |
|
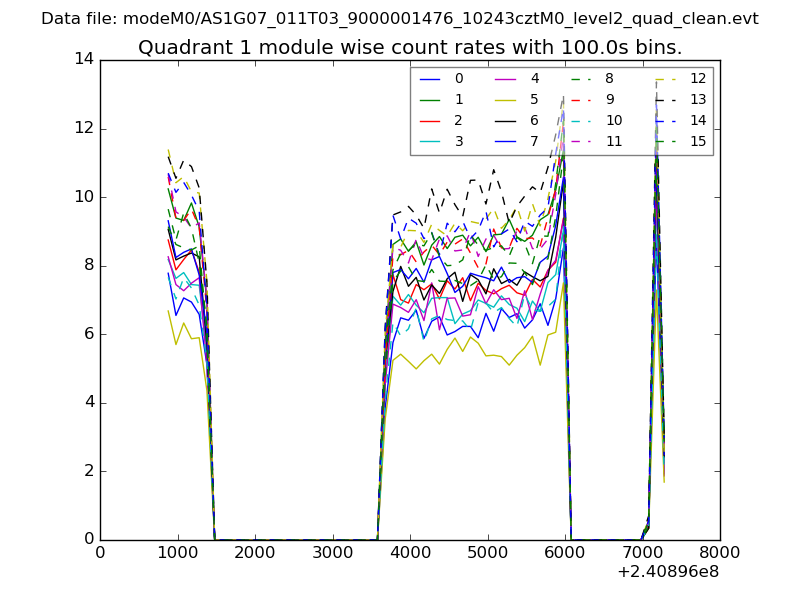
| Module-wise count rates for Quadrant A Data is divided into 100 sec bins |
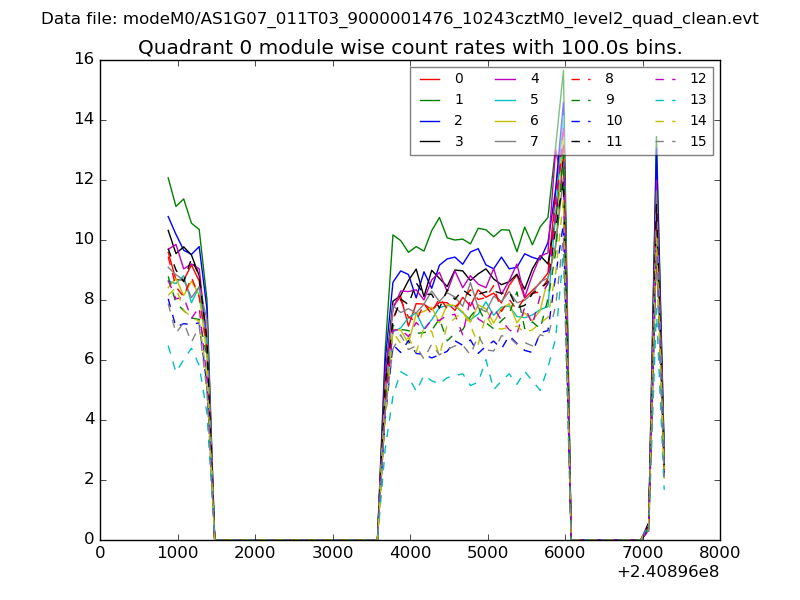 |
 |
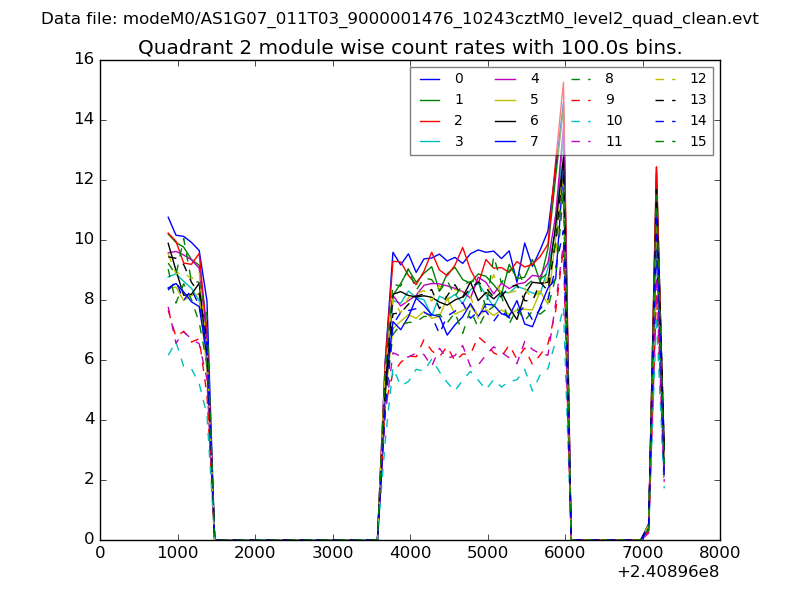
| Module-wise count rates for Quadrant B Data is divided into 100 sec bins |
 |
 |
| Module-wise count rates for Quadrant C Data is divided into 100 sec bins |
 |
 |
| Module-wise count rates for Quadrant D Data is divided into 100 sec bins |
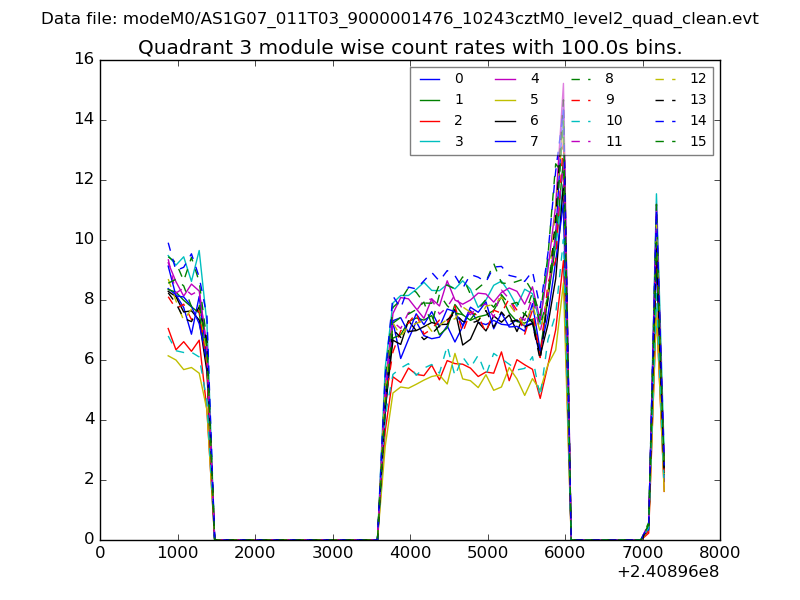 |
 |
| Parameter | Plot |
|---|---|
| CZT HV Monitor | 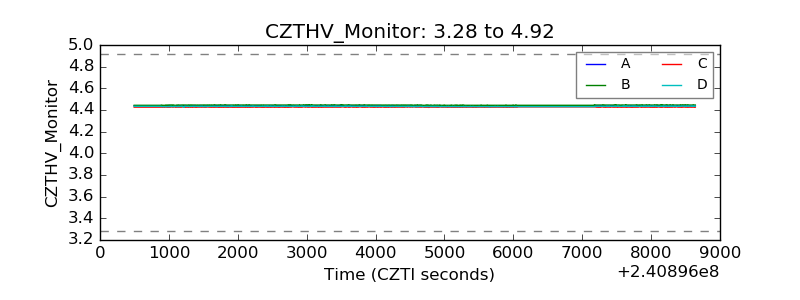 |
| D_VDD | 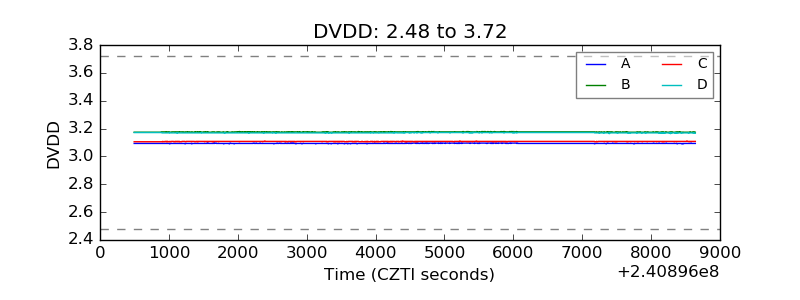 |
| Temperature 1 | 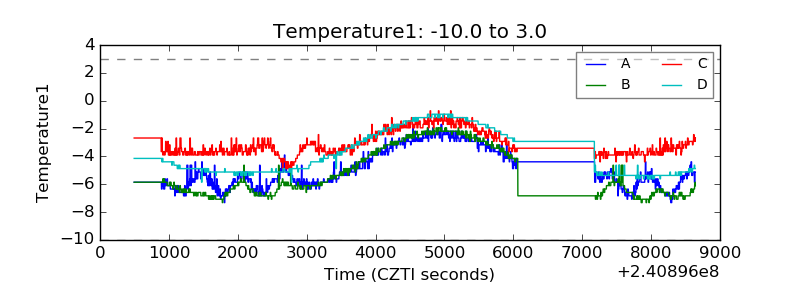 |
| Veto HV Monitor | 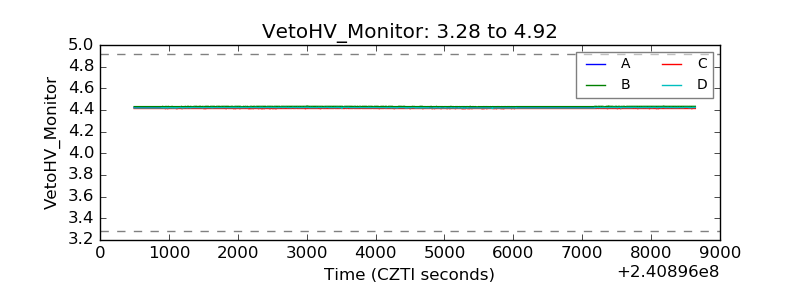 |
| Veto LLD | 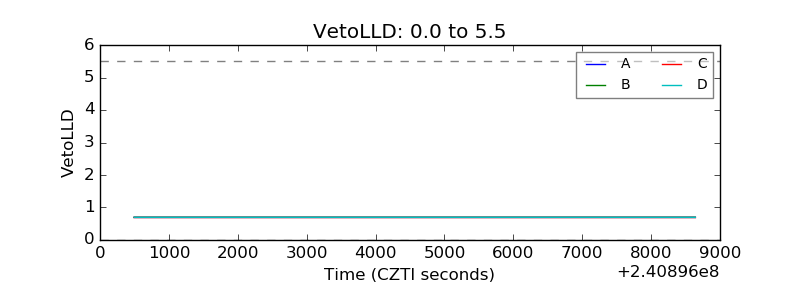 |
| Alpha Counter | 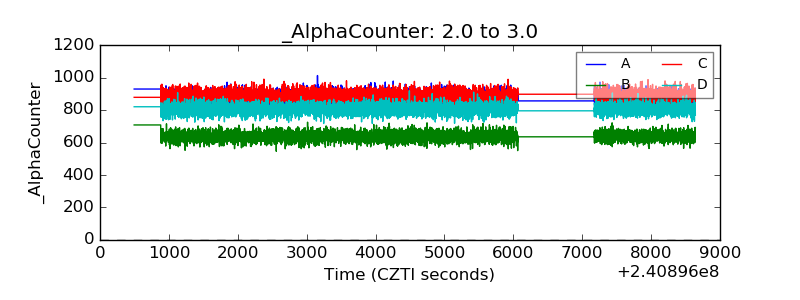 |
| _CPM_Rate | 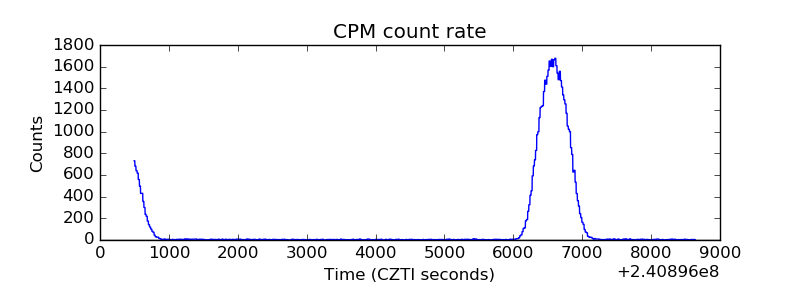 |
| CZT Counter | 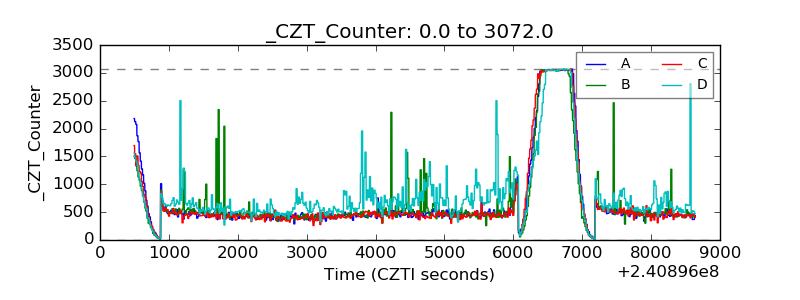 |
| +2.5 Volts monitor | 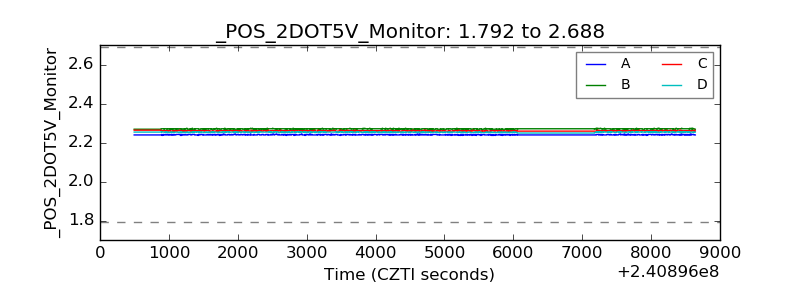 |
| +5 Volts monitor | 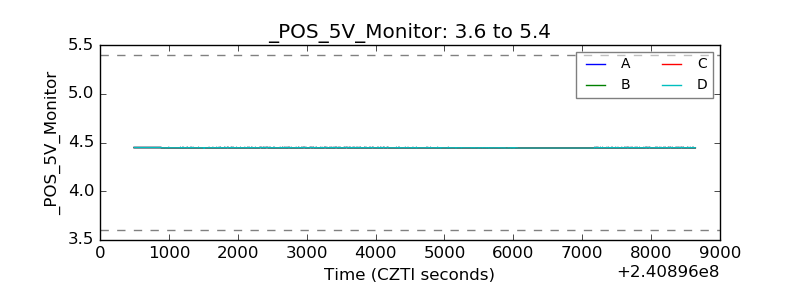 |
| _ROLL_ROT | 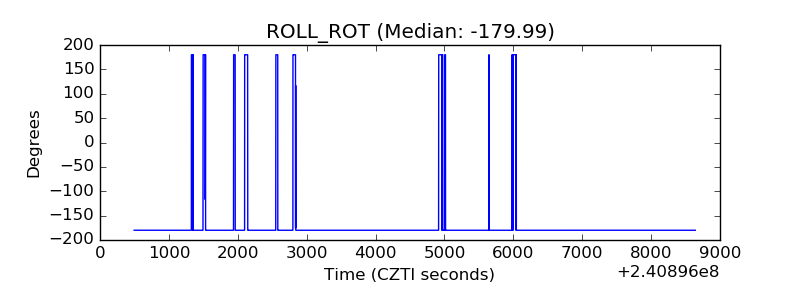 |
| _Roll_DEC | 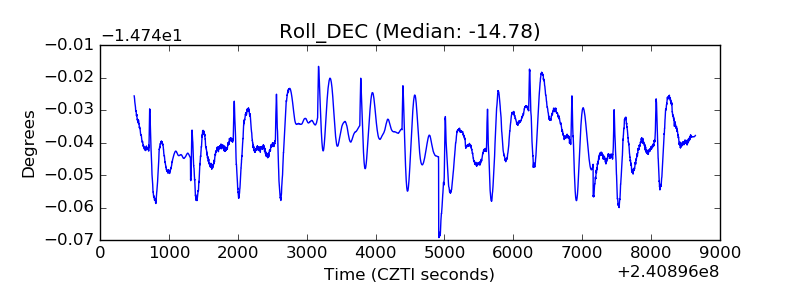 |
| _Roll_RA | 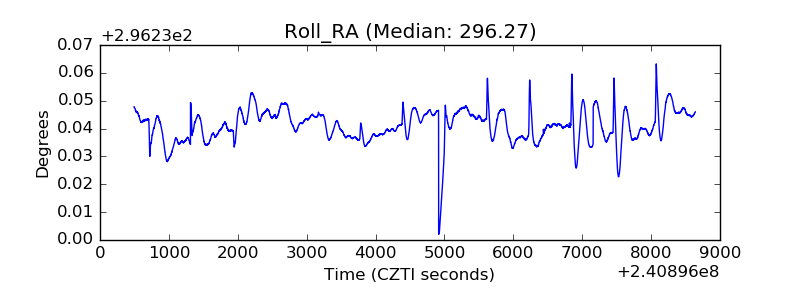 |
| Veto Counter | 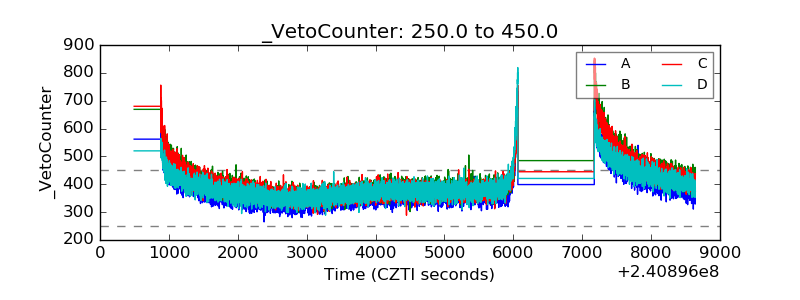 |