| Param | Original file | Final file |
|---|---|---|
| Filename | modeM0/AS1G07_011T03_9000001476_10245cztM0_level2.evt | modeM0/AS1G07_011T03_9000001476_10245cztM0_level2_quad_clean.evt |
| Size (bytes) | 485,809,920 | 62,470,080 |
| Size | 463.3 MB | 59.6 MB |
| Events in quadrant A | 3,113,528 | 365,838 |
| Events in quadrant B | 3,683,768 | 362,971 |
| Events in quadrant C | 3,043,865 | 364,386 |
| Events in quadrant D | 4,433,972 | 348,100 |
| Mode SS | |||
|---|---|---|---|
| Quadrant | BADHDUFLAG | Total packets | Discarded packets |
| A | 0 | 132 | 0 |
| B | 0 | 132 | 0 |
| C | 0 | 132 | 0 |
| D | 0 | 132 | 0 |
| Mode M0 | |||
|---|---|---|---|
| Quadrant | BADHDUFLAG | Total packets | Discarded packets |
| A | 0 | 13333 | 3 |
| B | 0 | 14968 | 2 |
| C | 0 | 13250 | 2 |
| D | 0 | 17546 | 2 |
| Mode M9 | |||
|---|---|---|---|
| Quadrant | BADHDUFLAG | Total packets | Discarded packets |
| A | 0 | 21 | 0 |
| B | 0 | 21 | 0 |
| C | 0 | 21 | 0 |
| D | 0 | 22 | 0 |
| Quadrant | Total seconds | Saturated seconds | Saturation percentage |
|---|---|---|---|
| A | 6447 | 16 | 0.248177% |
| B | 6447 | 119 | 1.845820% |
| C | 6447 | 20 | 0.310222% |
| D | 6447 | 54 | 0.837599% |
Noise dominated data is calculated using 1-second bins in cleaned event files. If a bin has >2000 counts, and if more than 50% of those come from <1% of pixels, then it is considered to be noise-dominated and hence unusable.
| Quadrant | # 1 sec bins | Bins with >0 counts | Bins with >2000 counts | High rate bins dominated by noise | Noise dominated (total time) | Noise dominated (detector-on time) | Marked lightcurve |
|---|---|---|---|---|---|---|---|
| A | 7682 | 6448 | 0 | 0 | 0.00% | 0.00% | 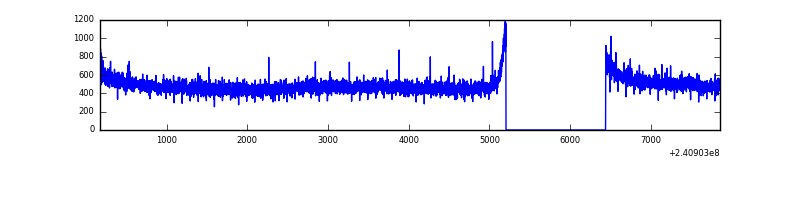 |
| B | 7682 | 6447 | 64 | 64 | 0.83% | 0.99% | 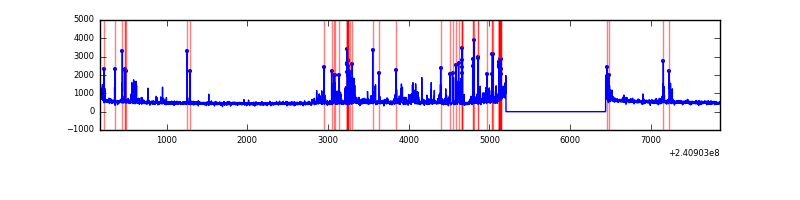 |
| C | 7682 | 6448 | 0 | 0 | 0.00% | 0.00% | 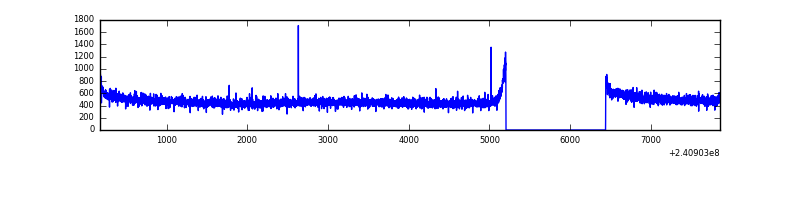 |
| D | 7682 | 6448 | 31 | 31 | 0.40% | 0.48% | 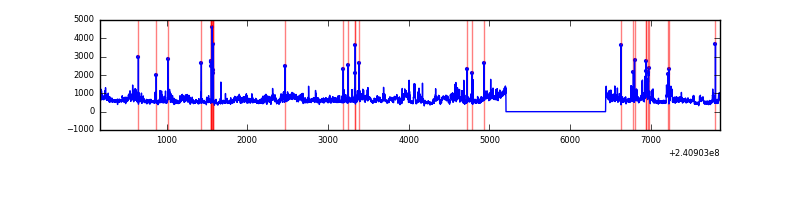 |
Top three noisy pixels from each quadrant. If the there are fewer than three noisy pixels in the level2.evt file, extra rows are filled as -1
| Pixel properties | Quadrant properties | ||||||
|---|---|---|---|---|---|---|---|
| Quadrant | DetID | PixID | Counts | Sigma | Mean | Median | Sigma |
| A | 8 | 15 | 15570 | 91.47 | 803 | 788 | 161.6 |
| A | 0 | 226 | 7292 | 40.25 | 803 | 788 | 161.6 |
| A | 12 | 194 | 6665 | 36.37 | 803 | 788 | 161.6 |
| B | 10 | 247 | 330605 | 2166.49 | 804 | 784 | 152.2 |
| B | 0 | 219 | 76145 | 495.02 | 804 | 784 | 152.2 |
| B | 4 | 239 | 59691 | 386.94 | 804 | 784 | 152.2 |
| C | 13 | 61 | 5797 | 27.94 | 778 | 783 | 179.5 |
| C | 0 | 207 | 3824 | 16.94 | 778 | 783 | 179.5 |
| C | 12 | 4 | 3683 | 16.16 | 778 | 783 | 179.5 |
| D | 1 | 52 | 917956 | 4534.28 | 760 | 746 | 202.3 |
| D | 8 | 195 | 483809 | 2388.05 | 760 | 746 | 202.3 |
| D | 13 | 104 | 61037 | 298.05 | 760 | 746 | 202.3 |
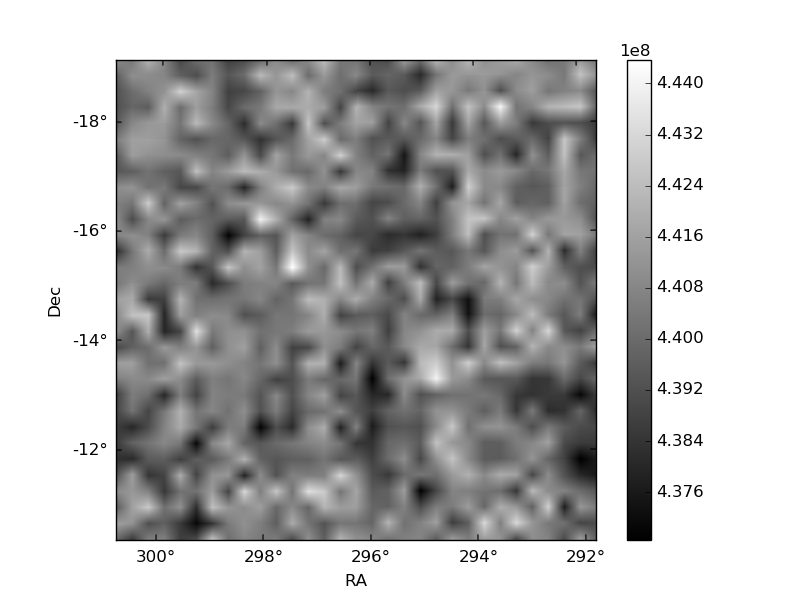
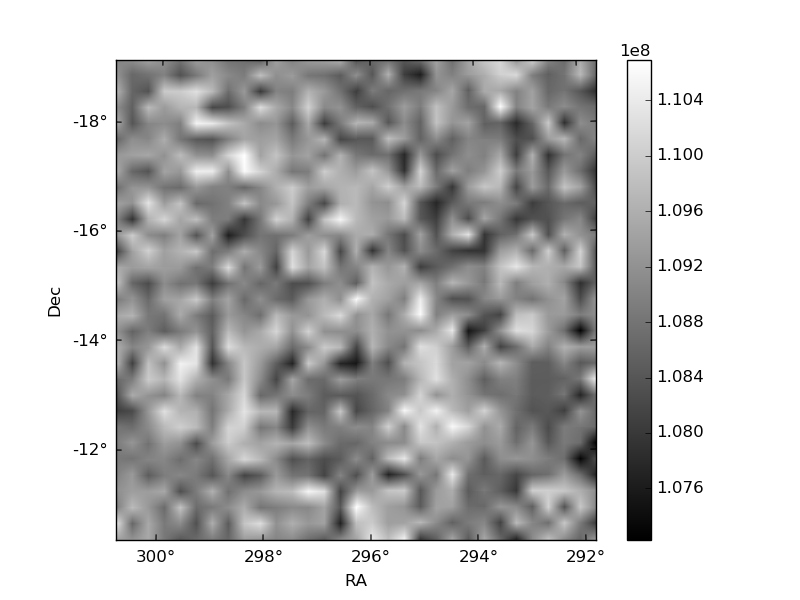
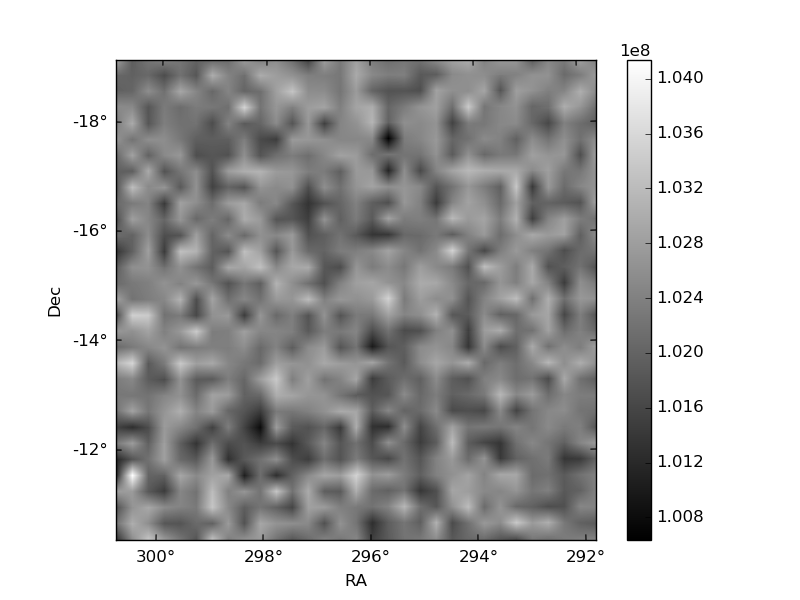
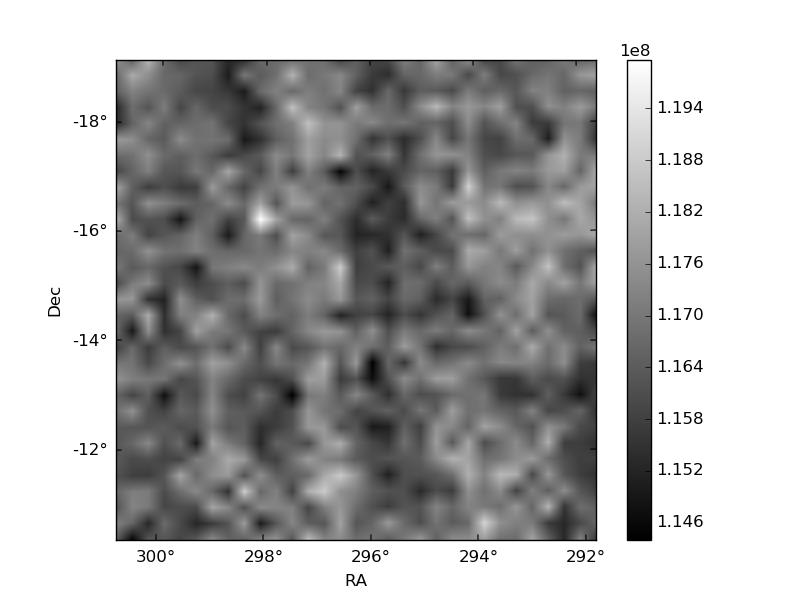
Histogram calculated using DETX and DETY for each event in the final _common_clean file
| Quadrant A | 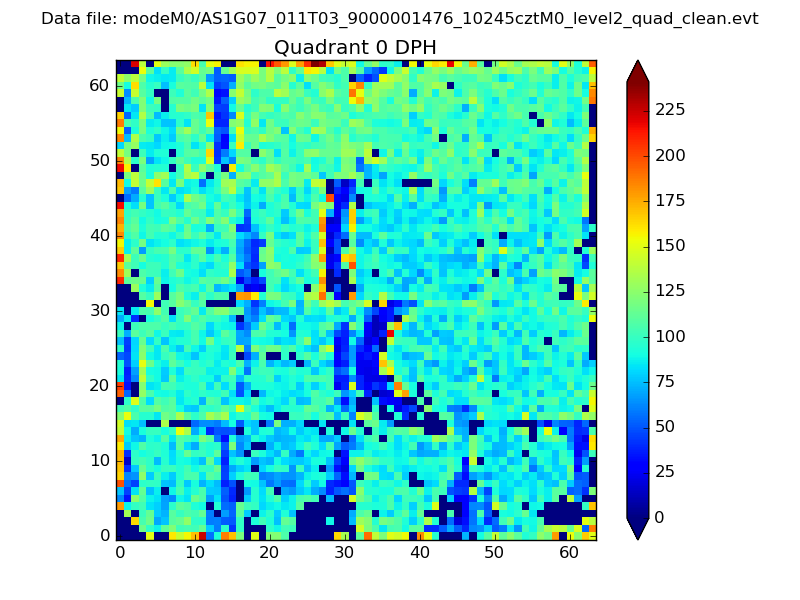 |
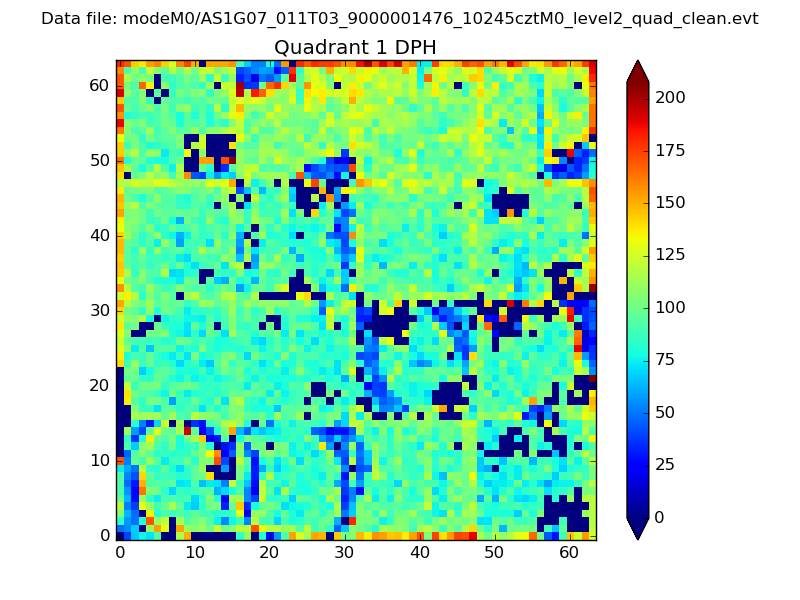 |
Quadrant B |
|---|---|---|---|
| Quadrant D | 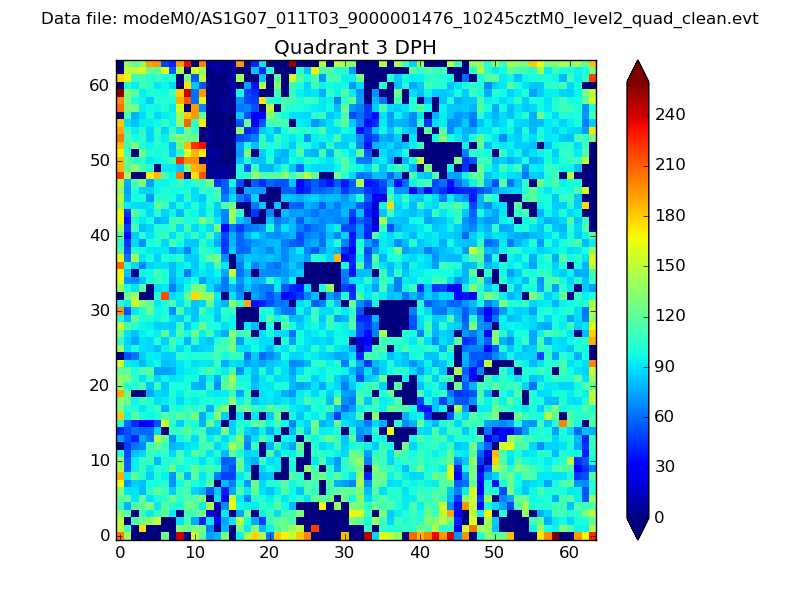 |
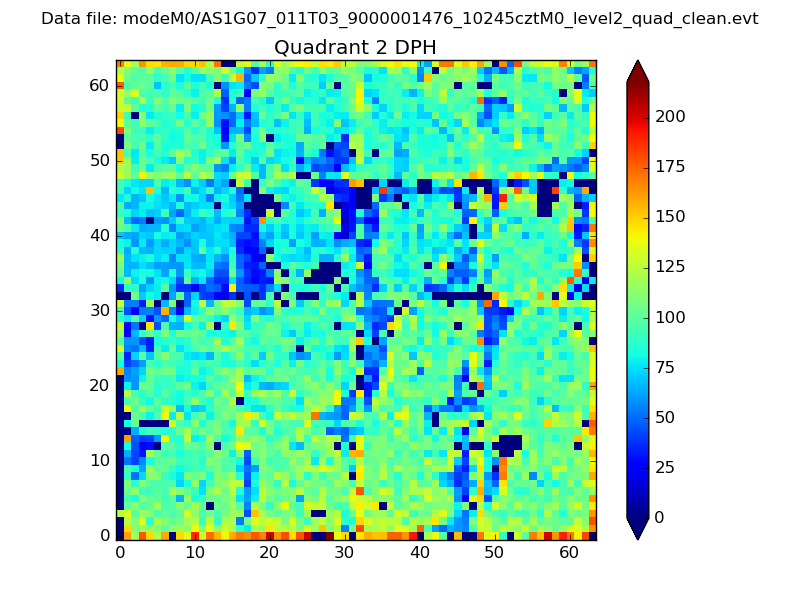 |
Quadrant C |
| Plot type | Count rate plots | Images |
|---|---|---|
| Comparison with Poisson distribution Blue bars denote a histogram of data divided into 1 sec bins. Red curve is a Poisson curve with rate = median count rate of data. |
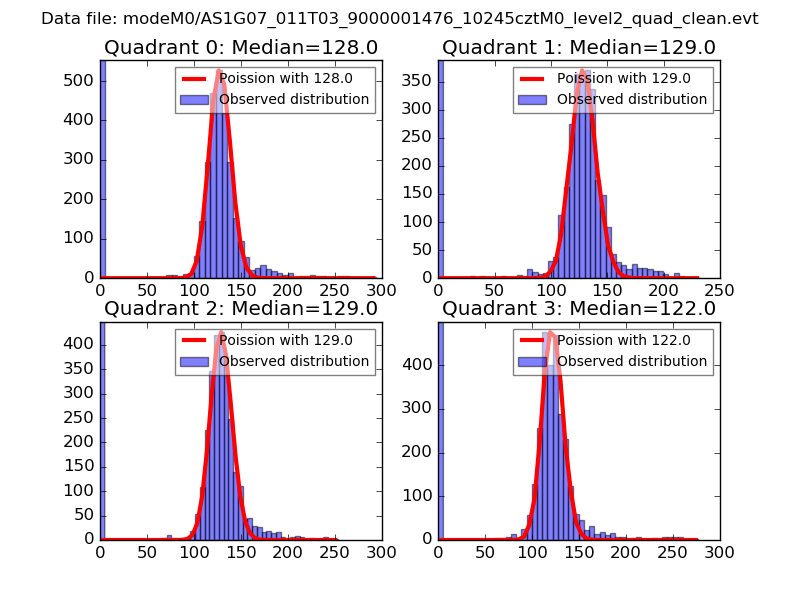 |
 |
| Quadrant-wise count rates Data is divided into 100 sec bins |
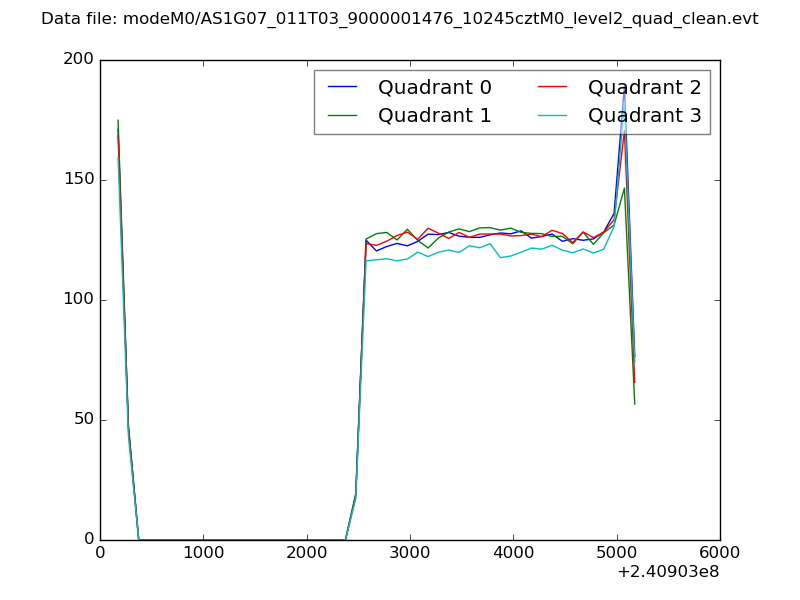 |
|
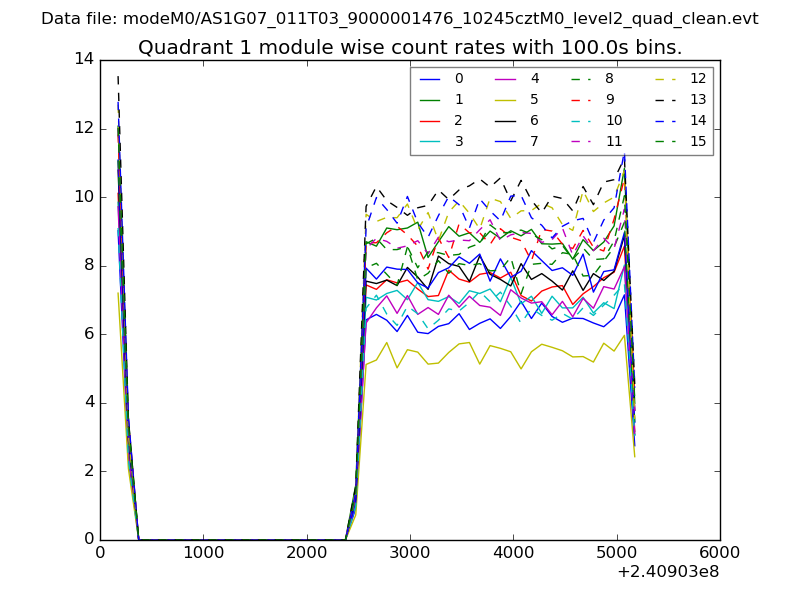
| Module-wise count rates for Quadrant A Data is divided into 100 sec bins |
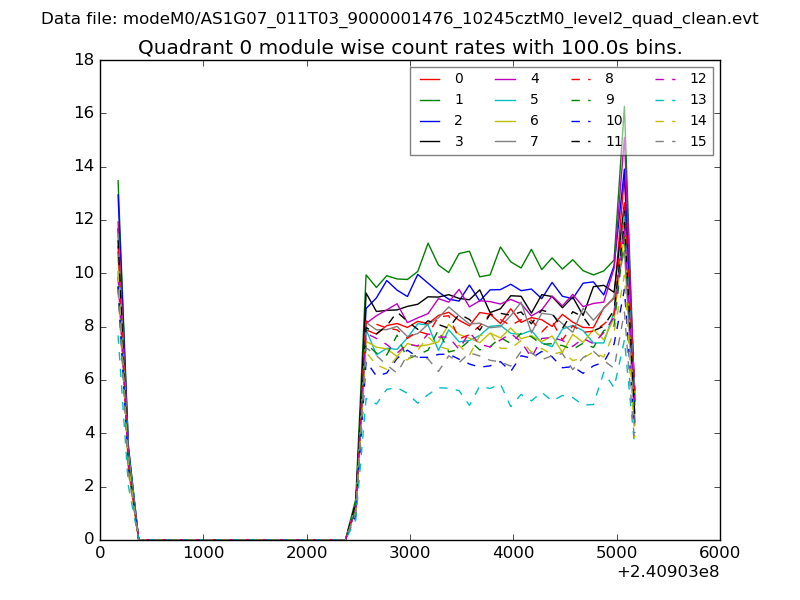 |
 |
| Module-wise count rates for Quadrant B Data is divided into 100 sec bins |
 |
 |
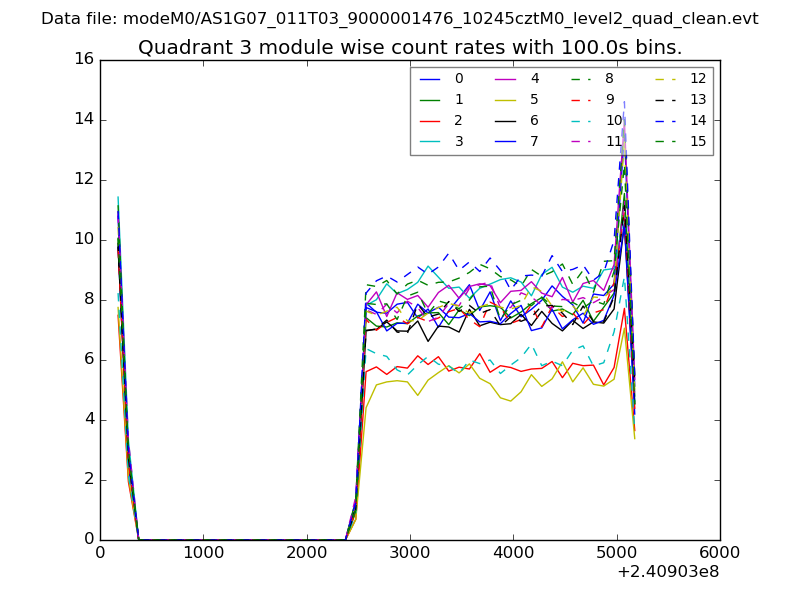
| Module-wise count rates for Quadrant C Data is divided into 100 sec bins |
 |
 |
| Module-wise count rates for Quadrant D Data is divided into 100 sec bins |
 |
 |
| Parameter | Plot |
|---|---|
| CZT HV Monitor | 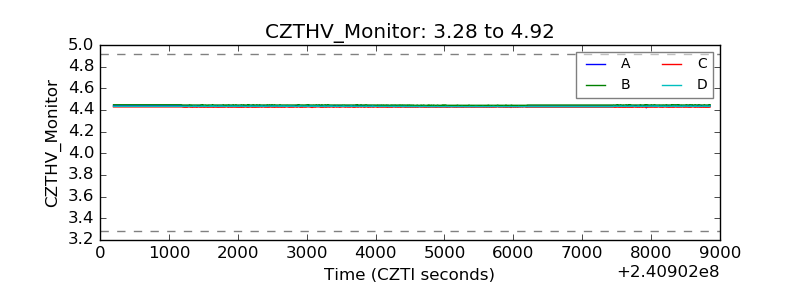 |
| D_VDD | 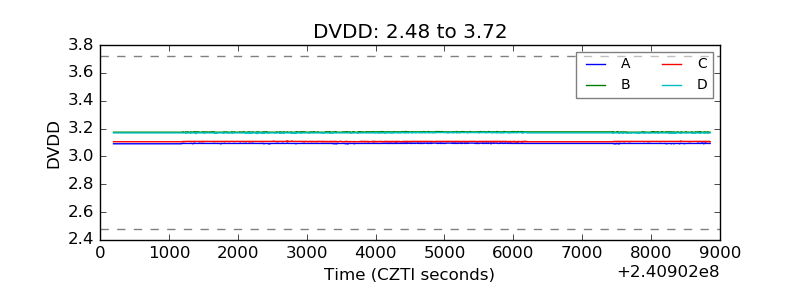 |
| Temperature 1 | 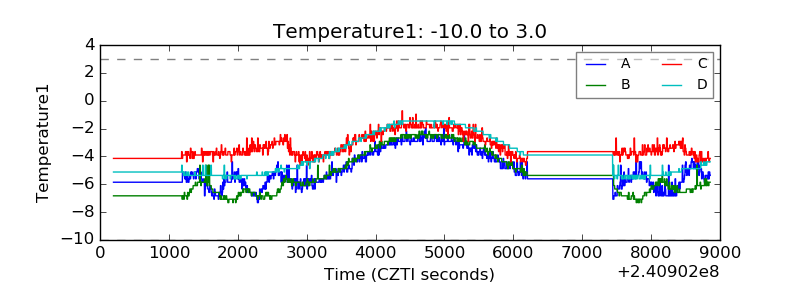 |
| Veto HV Monitor | 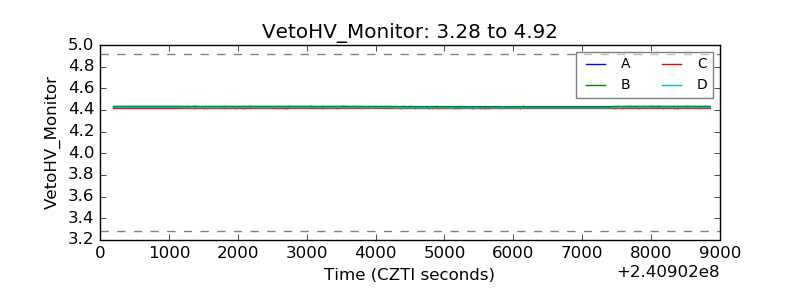 |
| Veto LLD | 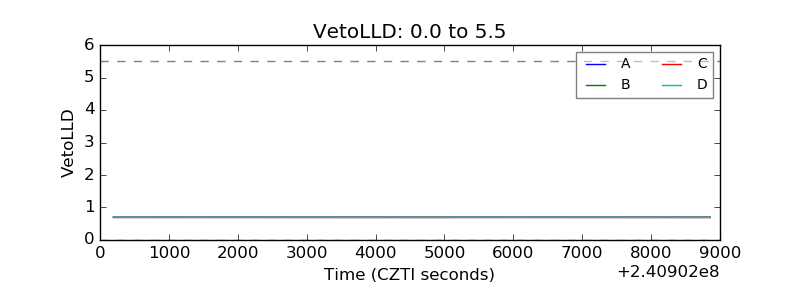 |
| Alpha Counter | 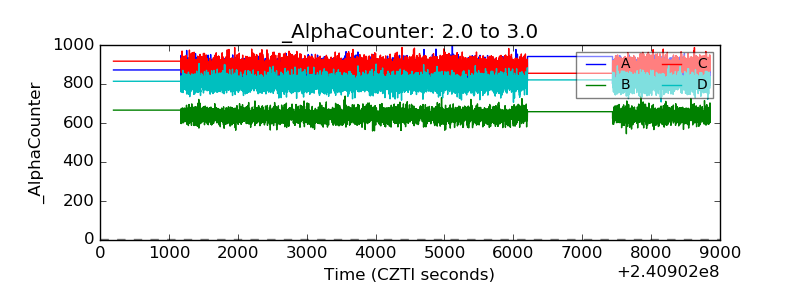 |
| _CPM_Rate | 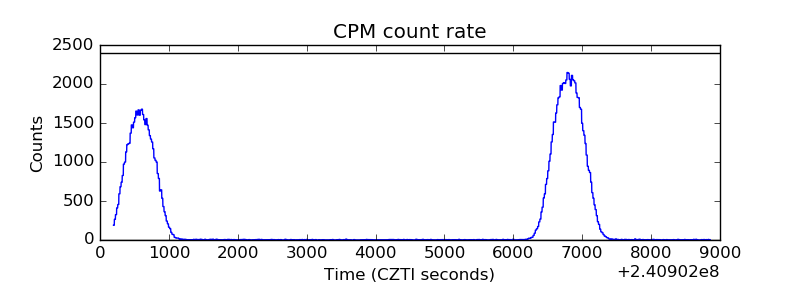 |
| CZT Counter | 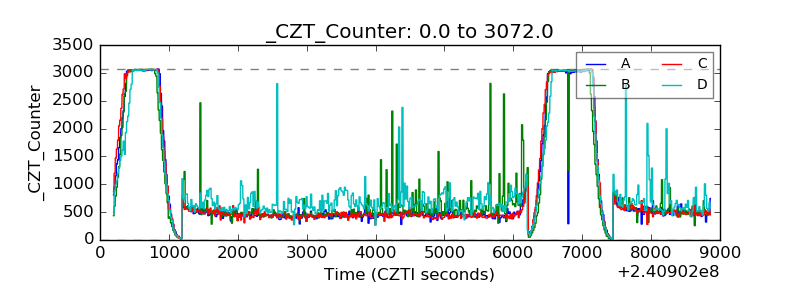 |
| +2.5 Volts monitor |  |
| +5 Volts monitor |  |
| _ROLL_ROT | 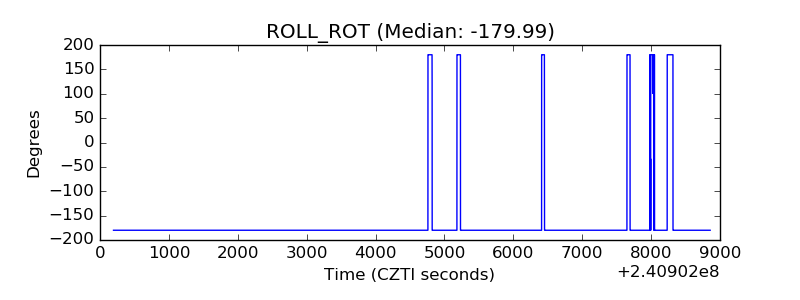 |
| _Roll_DEC | 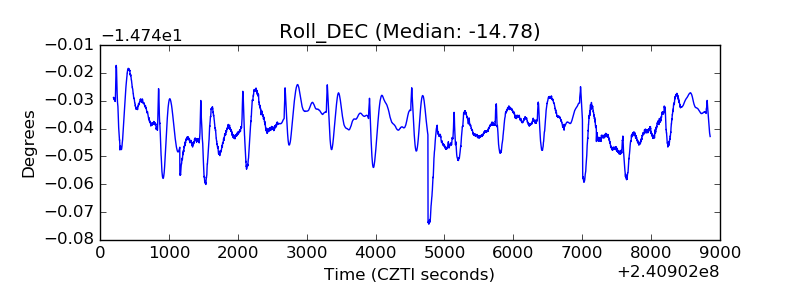 |
| _Roll_RA | 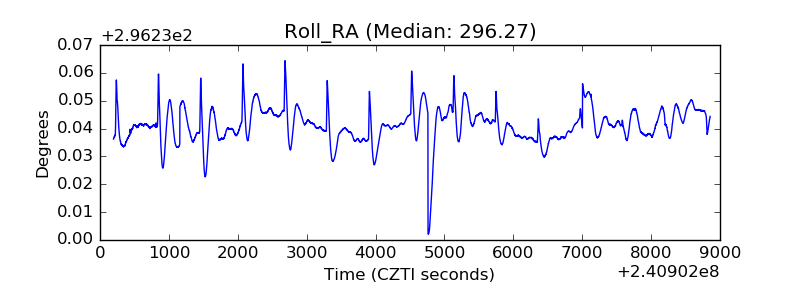 |
| Veto Counter |  |