| Param | Original file | Final file |
|---|---|---|
| Filename | modeM0/AS1G07_011T03_9000001476_10246cztM0_level2.evt | modeM0/AS1G07_011T03_9000001476_10246cztM0_level2_quad_clean.evt |
| Size (bytes) | 467,386,560 | 65,606,400 |
| Size | 445.7 MB | 62.6 MB |
| Events in quadrant A | 3,122,694 | 395,570 |
| Events in quadrant B | 3,385,849 | 398,997 |
| Events in quadrant C | 3,042,159 | 394,918 |
| Events in quadrant D | 4,188,270 | 369,087 |
| Mode SS | |||
|---|---|---|---|
| Quadrant | BADHDUFLAG | Total packets | Discarded packets |
| A | 0 | 124 | 0 |
| B | 0 | 124 | 0 |
| C | 0 | 124 | 0 |
| D | 0 | 124 | 0 |
| Mode M0 | |||
|---|---|---|---|
| Quadrant | BADHDUFLAG | Total packets | Discarded packets |
| A | 0 | 12981 | 3 |
| B | 0 | 13747 | 2 |
| C | 0 | 12858 | 4 |
| D | 0 | 16436 | 10 |
| Mode M9 | |||
|---|---|---|---|
| Quadrant | BADHDUFLAG | Total packets | Discarded packets |
| A | 0 | 18 | 0 |
| B | 0 | 18 | 0 |
| C | 0 | 18 | 0 |
| D | 0 | 19 | 0 |
| Quadrant | Total seconds | Saturated seconds | Saturation percentage |
|---|---|---|---|
| A | 6128 | 43 | 0.701697% |
| B | 6128 | 100 | 1.631854% |
| C | 6127 | 40 | 0.652848% |
| D | 6127 | 161 | 2.627713% |
Noise dominated data is calculated using 1-second bins in cleaned event files. If a bin has >2000 counts, and if more than 50% of those come from <1% of pixels, then it is considered to be noise-dominated and hence unusable.
| Quadrant | # 1 sec bins | Bins with >0 counts | Bins with >2000 counts | High rate bins dominated by noise | Noise dominated (total time) | Noise dominated (detector-on time) | Marked lightcurve |
|---|---|---|---|---|---|---|---|
| A | 7423 | 6129 | 2 | 2 | 0.03% | 0.03% | 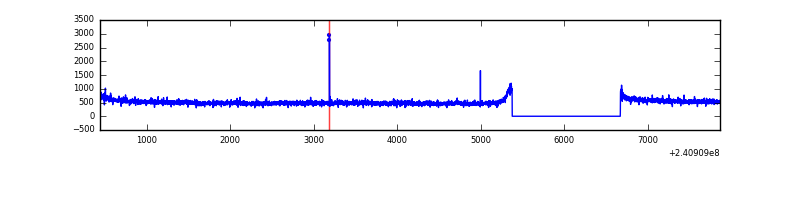 |
| B | 7423 | 6128 | 21 | 21 | 0.28% | 0.34% | 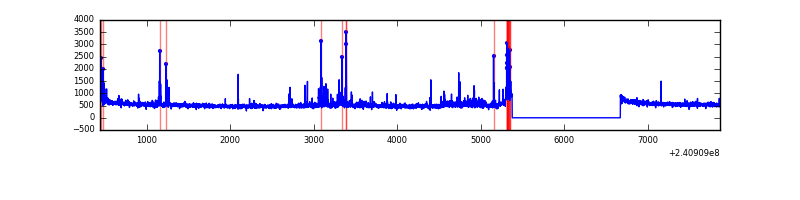 |
| C | 7423 | 6128 | 0 | 0 | 0.00% | 0.00% | 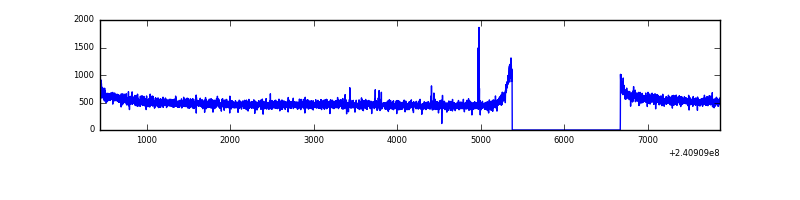 |
| D | 7423 | 6129 | 107 | 107 | 1.44% | 1.75% | 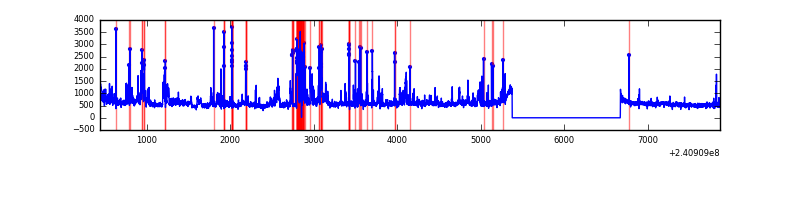 |
Top three noisy pixels from each quadrant. If the there are fewer than three noisy pixels in the level2.evt file, extra rows are filled as -1
| Pixel properties | Quadrant properties | ||||||
|---|---|---|---|---|---|---|---|
| Quadrant | DetID | PixID | Counts | Sigma | Mean | Median | Sigma |
| A | 8 | 15 | 16742 | 99.59 | 801 | 787 | 160.2 |
| A | 14 | 31 | 8905 | 50.67 | 801 | 787 | 160.2 |
| A | 13 | 14 | 8812 | 50.09 | 801 | 787 | 160.2 |
| B | 10 | 247 | 112559 | 737.77 | 801 | 785 | 151.5 |
| B | 11 | 51 | 54849 | 356.85 | 801 | 785 | 151.5 |
| B | 4 | 239 | 54841 | 356.8 | 801 | 785 | 151.5 |
| C | 0 | 207 | 14444 | 77.2 | 774 | 781 | 177.0 |
| C | 13 | 61 | 5571 | 27.07 | 774 | 781 | 177.0 |
| C | 1 | 0 | 5298 | 25.52 | 774 | 781 | 177.0 |
| D | 1 | 52 | 851763 | 4653.74 | 766 | 747 | 182.9 |
| D | 8 | 195 | 349459 | 1906.92 | 766 | 747 | 182.9 |
| D | 2 | 14 | 26637 | 141.58 | 766 | 747 | 182.9 |
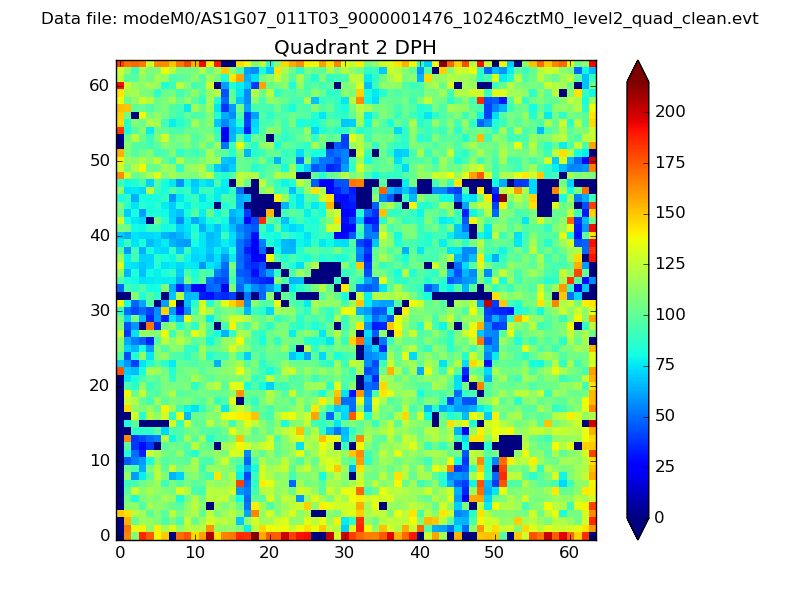
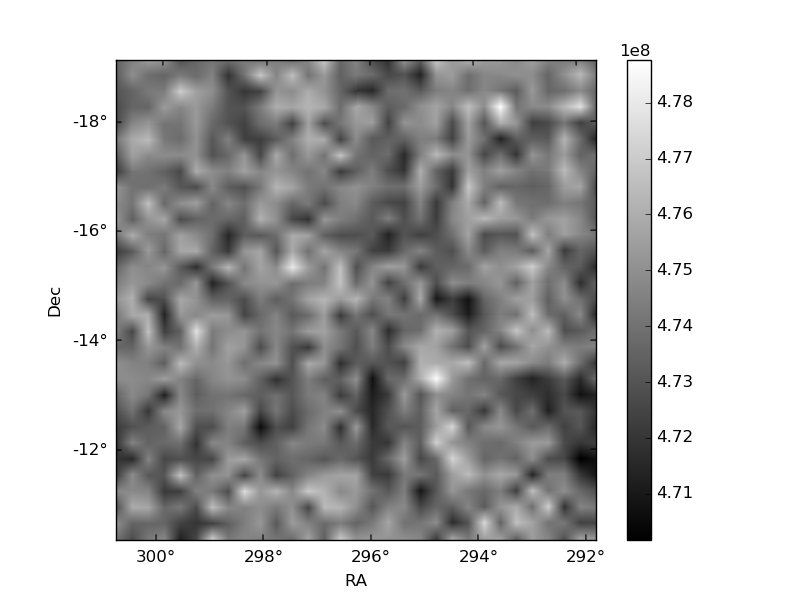
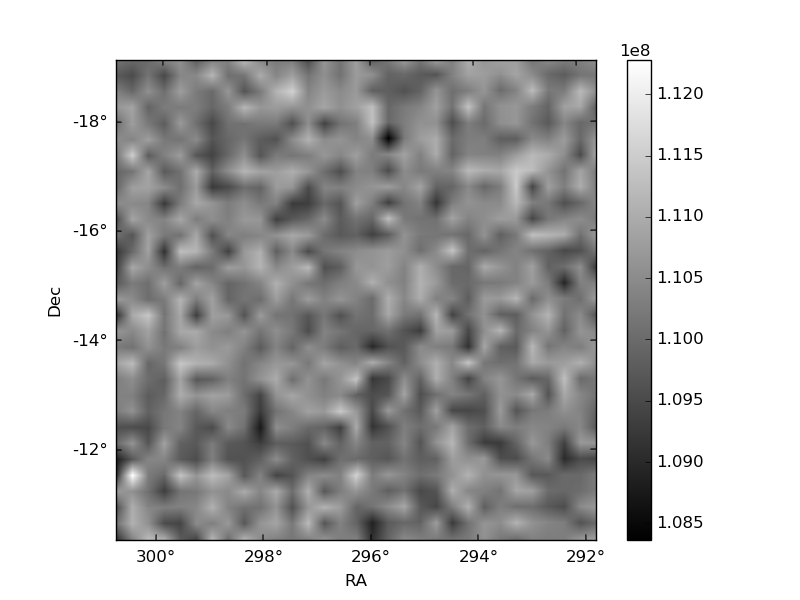
Histogram calculated using DETX and DETY for each event in the final _common_clean file
| Quadrant A | 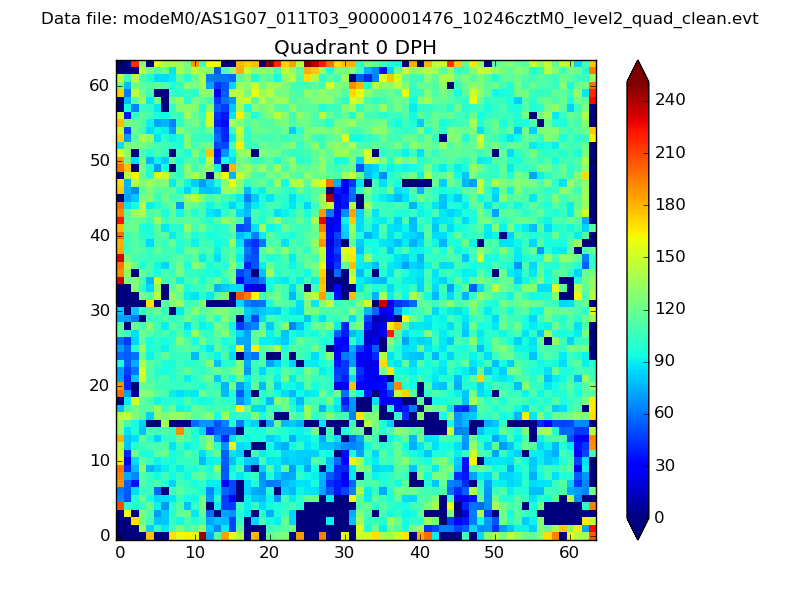 |
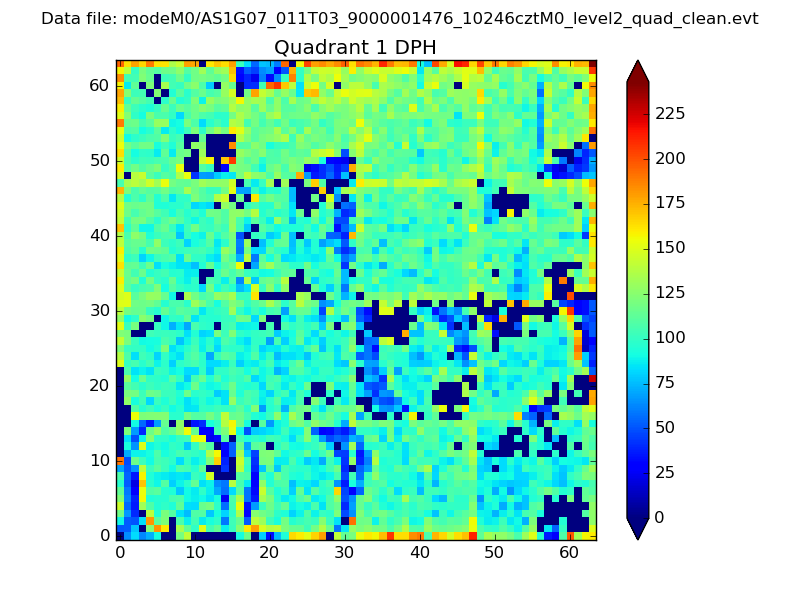 |
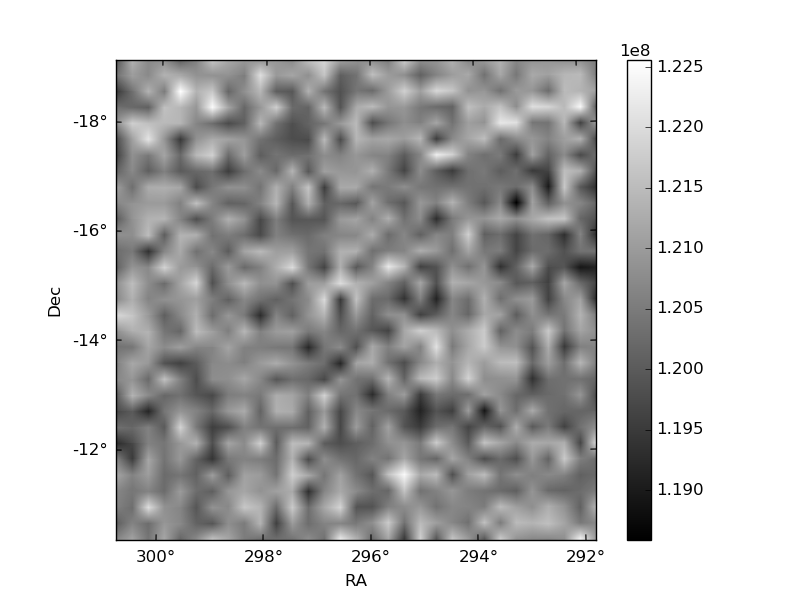
Quadrant B |
|---|---|---|---|
| Quadrant D | 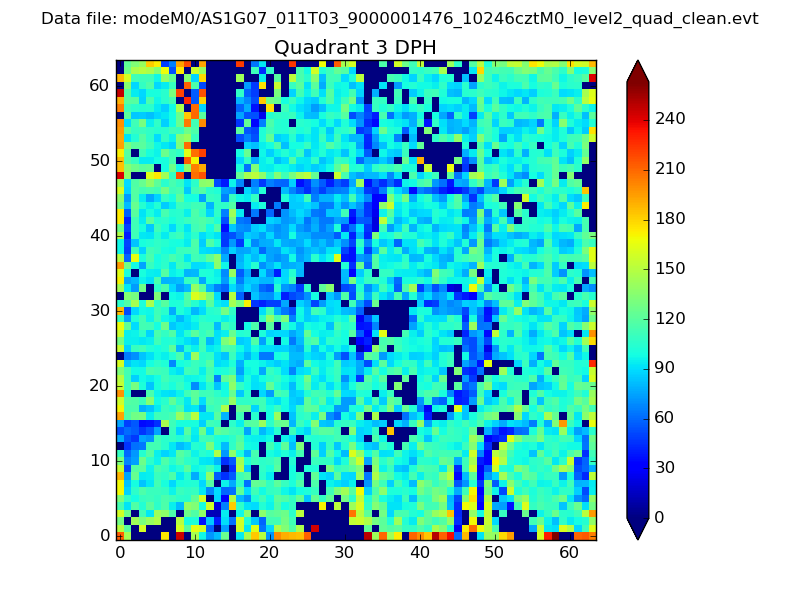 |
 |
Quadrant C |
| Plot type | Count rate plots | Images |
|---|---|---|
| Comparison with Poisson distribution Blue bars denote a histogram of data divided into 1 sec bins. Red curve is a Poisson curve with rate = median count rate of data. |
 |
 |
| Quadrant-wise count rates Data is divided into 100 sec bins |
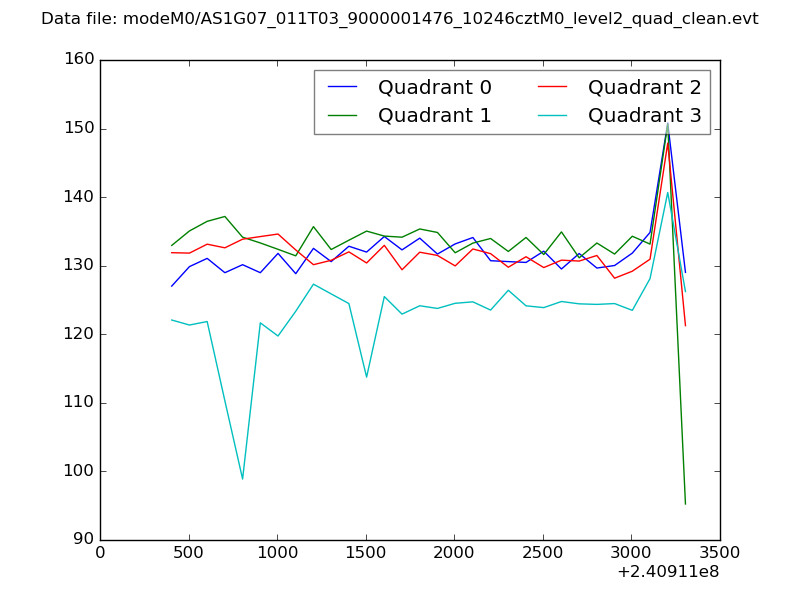 |
|
| Module-wise count rates for Quadrant A Data is divided into 100 sec bins |
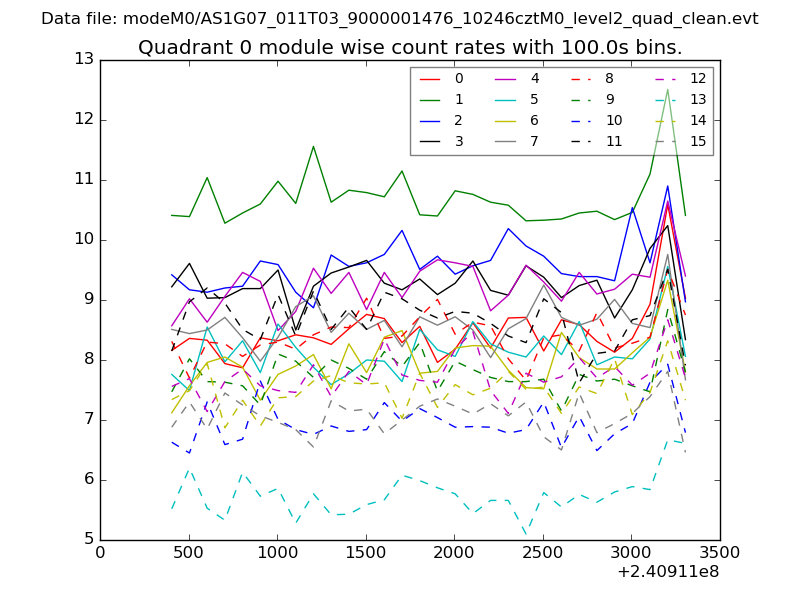 |
 |
| Module-wise count rates for Quadrant B Data is divided into 100 sec bins |
 |
 |
| Module-wise count rates for Quadrant C Data is divided into 100 sec bins |
 |
 |
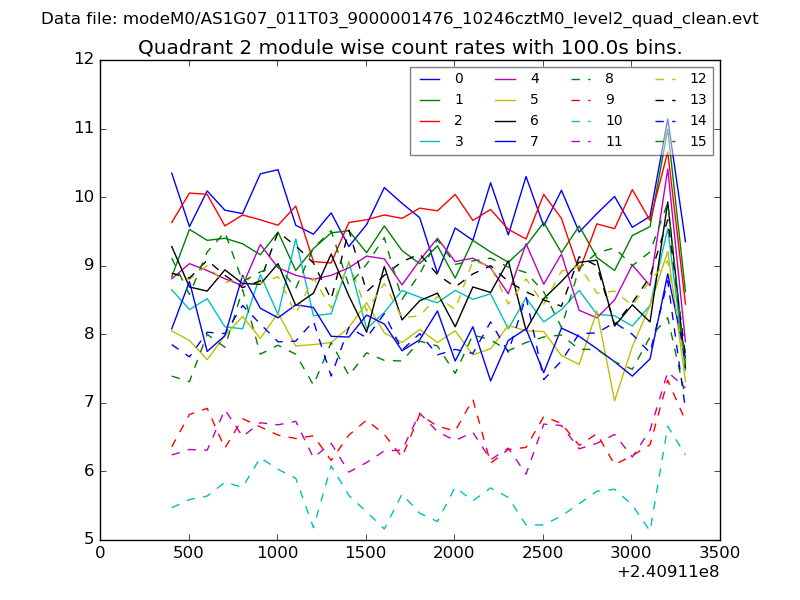
| Module-wise count rates for Quadrant D Data is divided into 100 sec bins |
 |
 |
| Parameter | Plot |
|---|---|
| CZT HV Monitor | 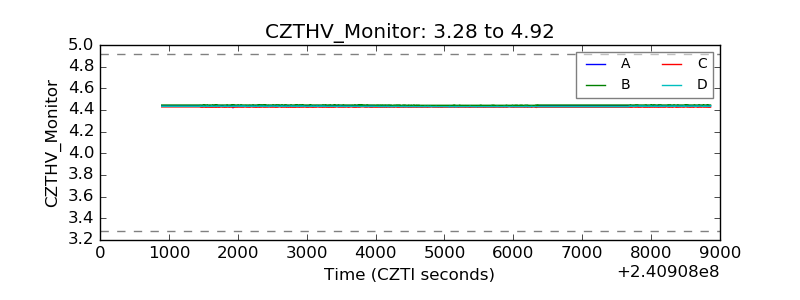 |
| D_VDD | 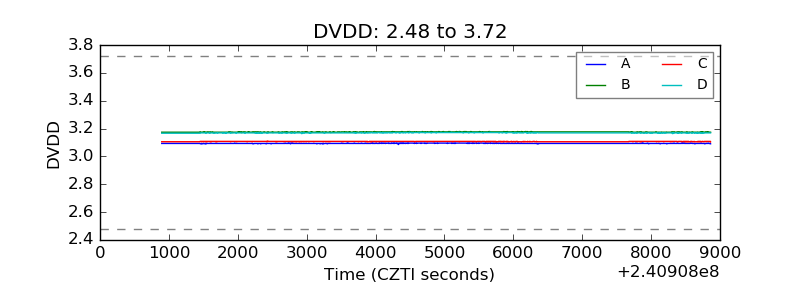 |
| Temperature 1 | 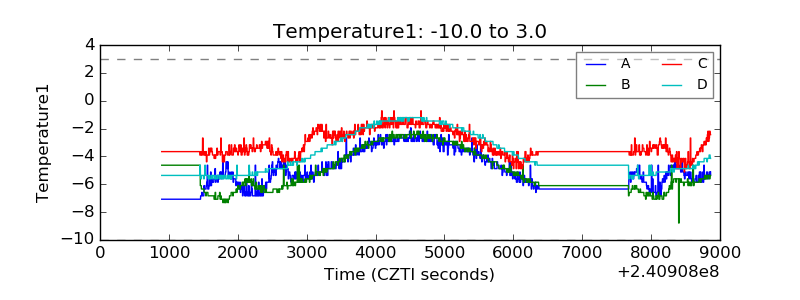 |
| Veto HV Monitor | 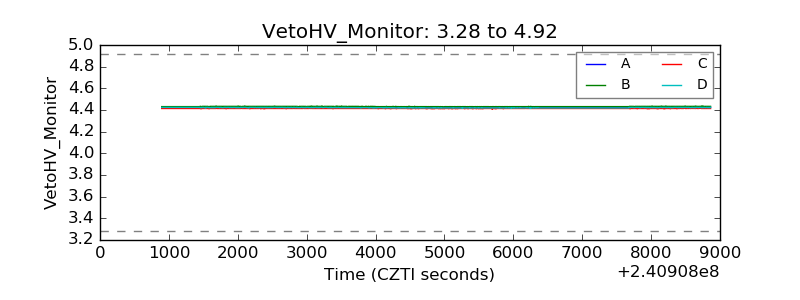 |
| Veto LLD | 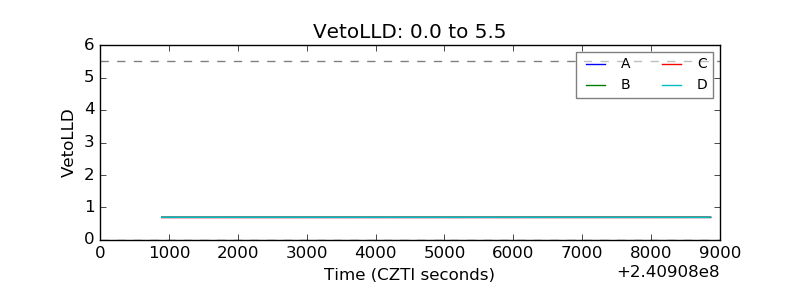 |
| Alpha Counter | 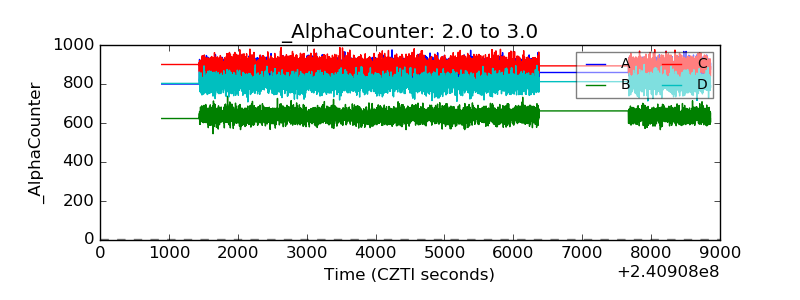 |
| _CPM_Rate | 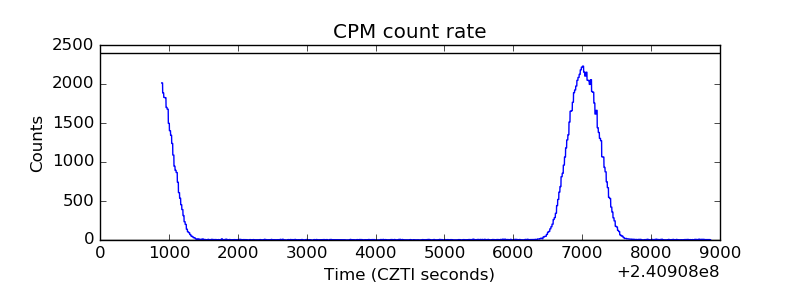 |
| CZT Counter | 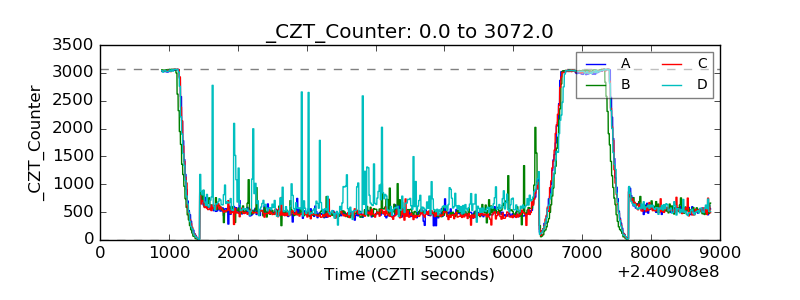 |
| +2.5 Volts monitor |  |
| +5 Volts monitor |  |
| _ROLL_ROT |  |
| _Roll_DEC |  |
| _Roll_RA | 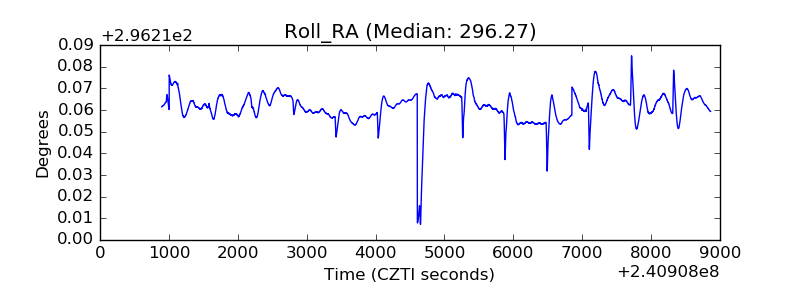 |
| Veto Counter | 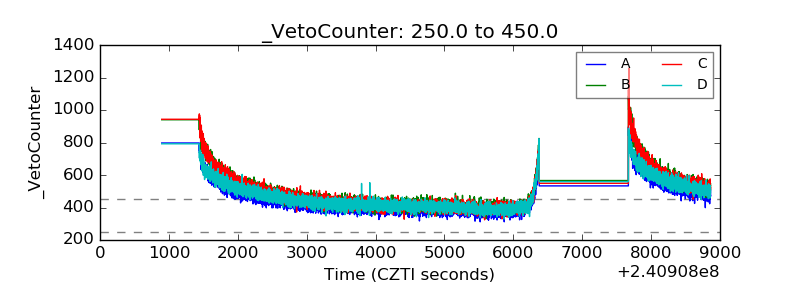 |