| Param | Original file | Final file |
|---|---|---|
| Filename | modeM0/AS1G07_011T03_9000001476_10247cztM0_level2.evt | modeM0/AS1G07_011T03_9000001476_10247cztM0_level2_quad_clean.evt |
| Size (bytes) | 481,345,920 | 78,791,040 |
| Size | 459.0 MB | 75.1 MB |
| Events in quadrant A | 3,327,140 | 491,082 |
| Events in quadrant B | 3,666,298 | 495,377 |
| Events in quadrant C | 3,246,982 | 491,370 |
| Events in quadrant D | 3,909,404 | 468,340 |
| Mode SS | |||
|---|---|---|---|
| Quadrant | BADHDUFLAG | Total packets | Discarded packets |
| A | 0 | 130 | 0 |
| B | 0 | 130 | 0 |
| C | 0 | 130 | 0 |
| D | 0 | 130 | 2 |
| Mode M0 | |||
|---|---|---|---|
| Quadrant | BADHDUFLAG | Total packets | Discarded packets |
| A | 0 | 13647 | 47 |
| B | 0 | 14754 | 61 |
| C | 0 | 13497 | 33 |
| D | 0 | 15612 | 41 |
| Mode M9 | |||
|---|---|---|---|
| Quadrant | BADHDUFLAG | Total packets | Discarded packets |
| A | 0 | 27 | 0 |
| B | 0 | 27 | 0 |
| C | 0 | 27 | 1 |
| D | 0 | 27 | 0 |
| Quadrant | Total seconds | Saturated seconds | Saturation percentage |
|---|---|---|---|
| A | 6299 | 102 | 1.619305% |
| B | 6296 | 173 | 2.747776% |
| C | 6304 | 99 | 1.570431% |
| D | 6303 | 164 | 2.601936% |
Noise dominated data is calculated using 1-second bins in cleaned event files. If a bin has >2000 counts, and if more than 50% of those come from <1% of pixels, then it is considered to be noise-dominated and hence unusable.
| Quadrant | # 1 sec bins | Bins with >0 counts | Bins with >2000 counts | High rate bins dominated by noise | Noise dominated (total time) | Noise dominated (detector-on time) | Marked lightcurve |
|---|---|---|---|---|---|---|---|
| A | 8947 | 6317 | 0 | 0 | 0.00% | 0.00% | 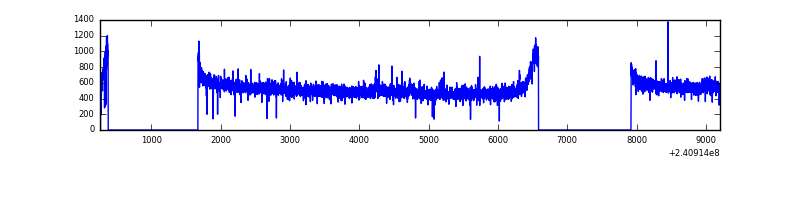 |
| B | 8947 | 6312 | 30 | 30 | 0.34% | 0.48% | 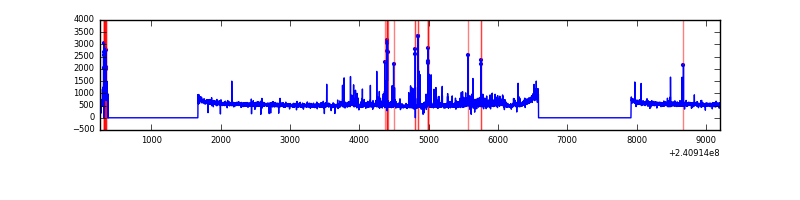 |
| C | 8947 | 6317 | 0 | 0 | 0.00% | 0.00% | 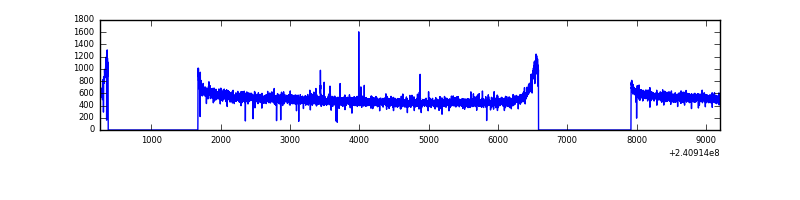 |
| D | 8947 | 6319 | 62 | 62 | 0.69% | 0.98% | 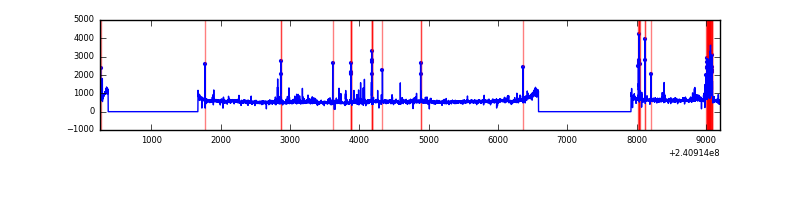 |
Top three noisy pixels from each quadrant. If the there are fewer than three noisy pixels in the level2.evt file, extra rows are filled as -1
| Pixel properties | Quadrant properties | ||||||
|---|---|---|---|---|---|---|---|
| Quadrant | DetID | PixID | Counts | Sigma | Mean | Median | Sigma |
| A | 8 | 15 | 13768 | 75.54 | 856 | 839 | 171.1 |
| A | 3 | 1 | 9919 | 53.05 | 856 | 839 | 171.1 |
| A | 13 | 14 | 9388 | 49.95 | 856 | 839 | 171.1 |
| B | 10 | 247 | 171054 | 1060.09 | 852 | 832 | 160.6 |
| B | 11 | 51 | 87525 | 539.9 | 852 | 832 | 160.6 |
| B | 0 | 214 | 40646 | 247.95 | 852 | 832 | 160.6 |
| C | 0 | 207 | 14795 | 73.25 | 827 | 835 | 190.6 |
| C | 13 | 61 | 6046 | 27.34 | 827 | 835 | 190.6 |
| C | 14 | 234 | 4573 | 19.61 | 827 | 835 | 190.6 |
| D | 8 | 195 | 414444 | 1903.52 | 816 | 804 | 217.3 |
| D | 2 | 33 | 144747 | 662.41 | 816 | 804 | 217.3 |
| D | 1 | 52 | 53164 | 240.95 | 816 | 804 | 217.3 |
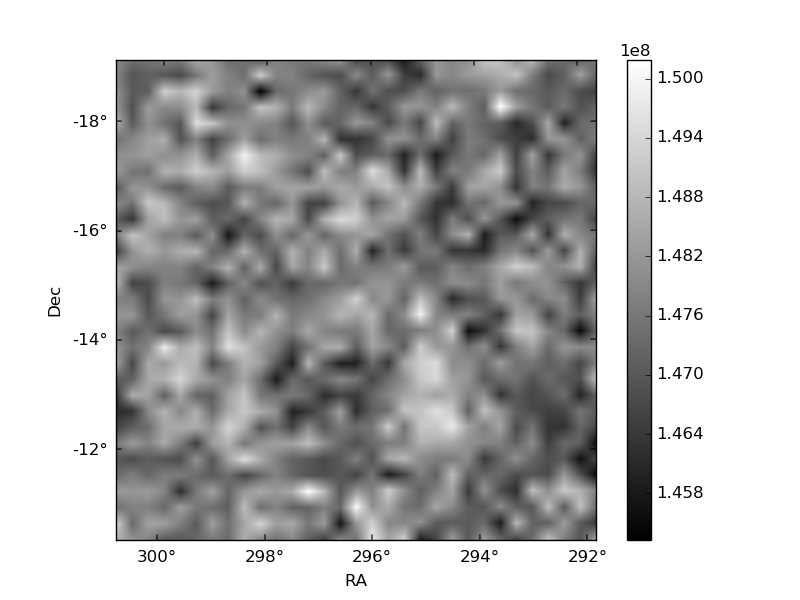
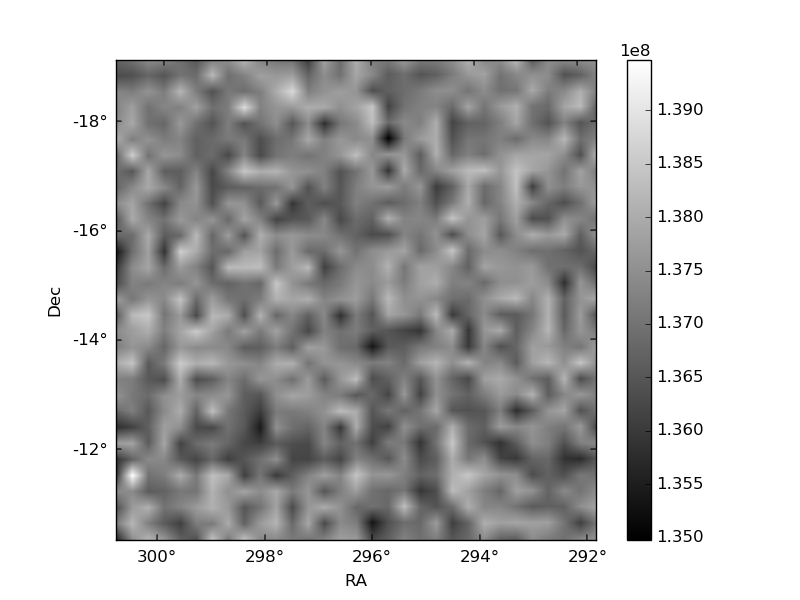
Histogram calculated using DETX and DETY for each event in the final _common_clean file
| Quadrant A | 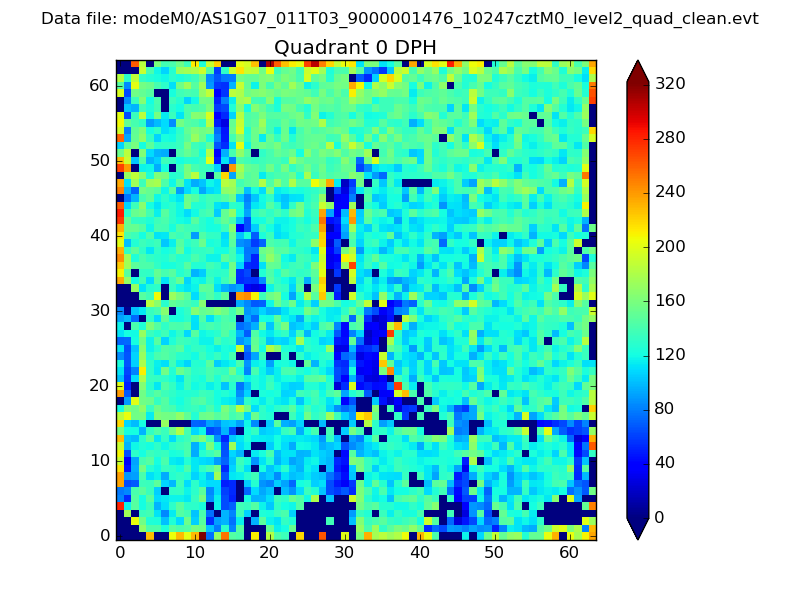 |
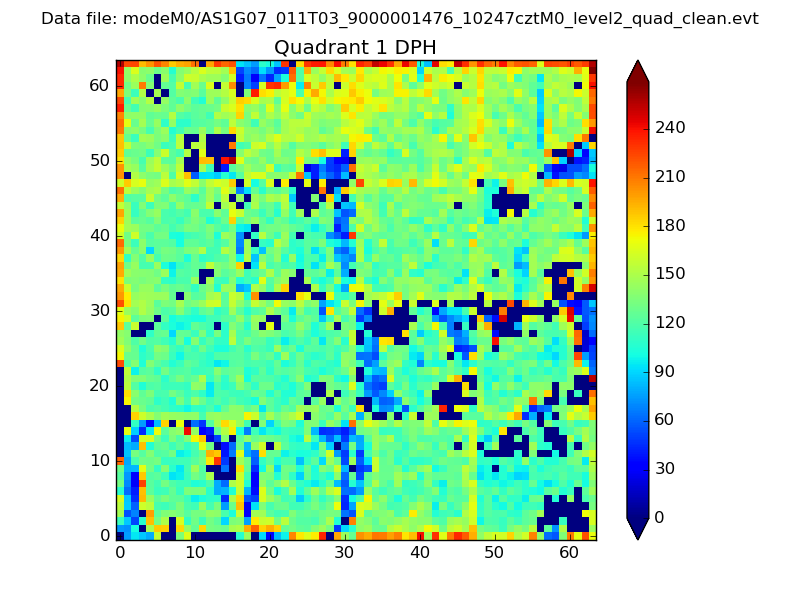 |
Quadrant B |
|---|---|---|---|
| Quadrant D | 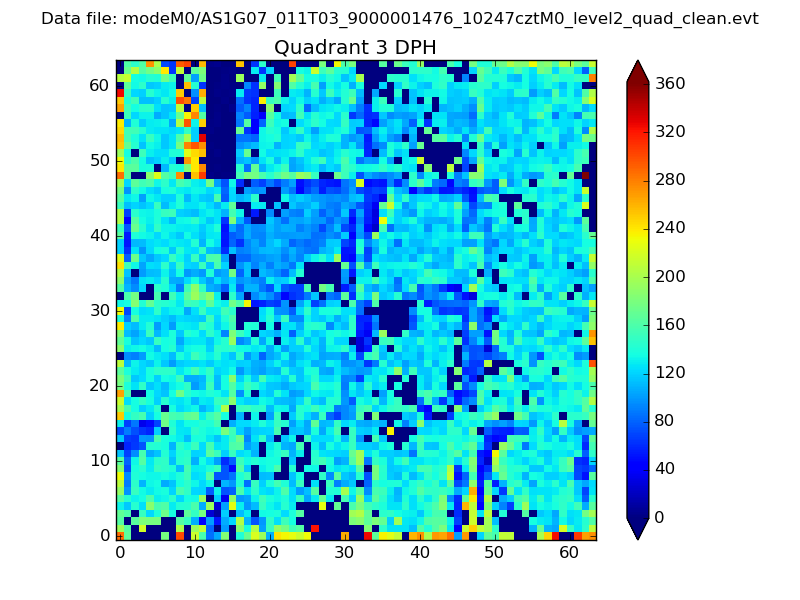 |
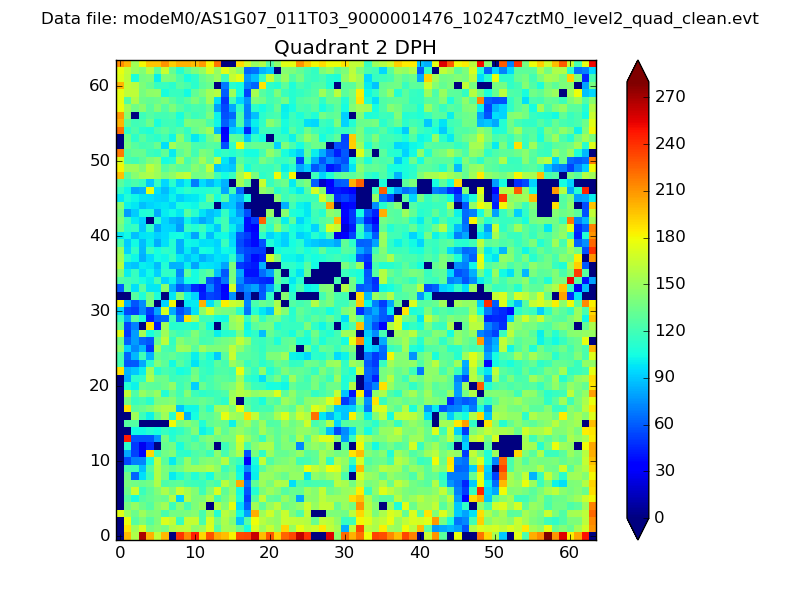 |
Quadrant C |
| Plot type | Count rate plots | Images |
|---|---|---|
| Comparison with Poisson distribution Blue bars denote a histogram of data divided into 1 sec bins. Red curve is a Poisson curve with rate = median count rate of data. |
 |
 |
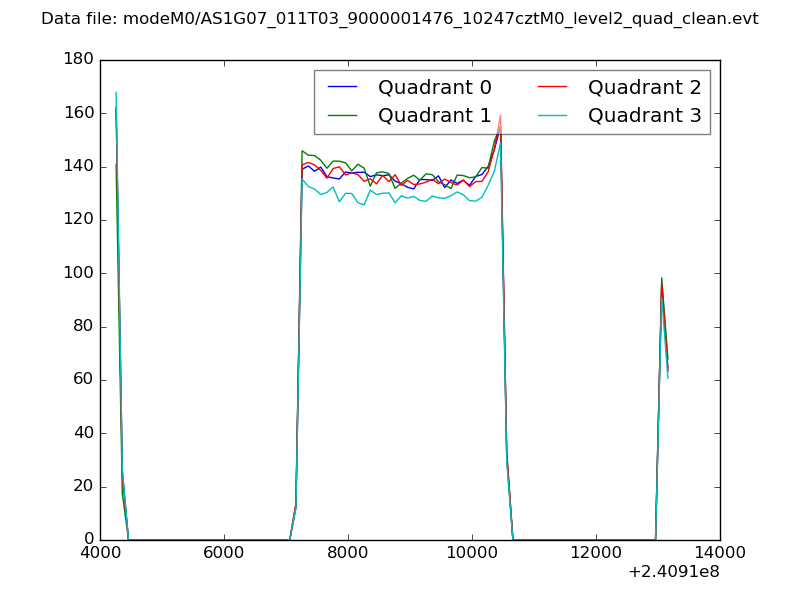
| Quadrant-wise count rates Data is divided into 100 sec bins |
 |
|
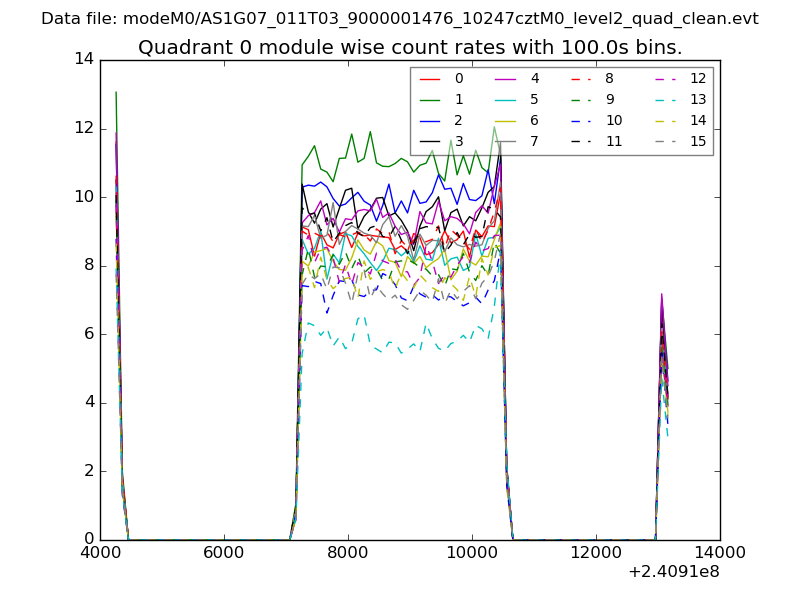
| Module-wise count rates for Quadrant A Data is divided into 100 sec bins |
 |
 |
| Module-wise count rates for Quadrant B Data is divided into 100 sec bins |
 |
 |
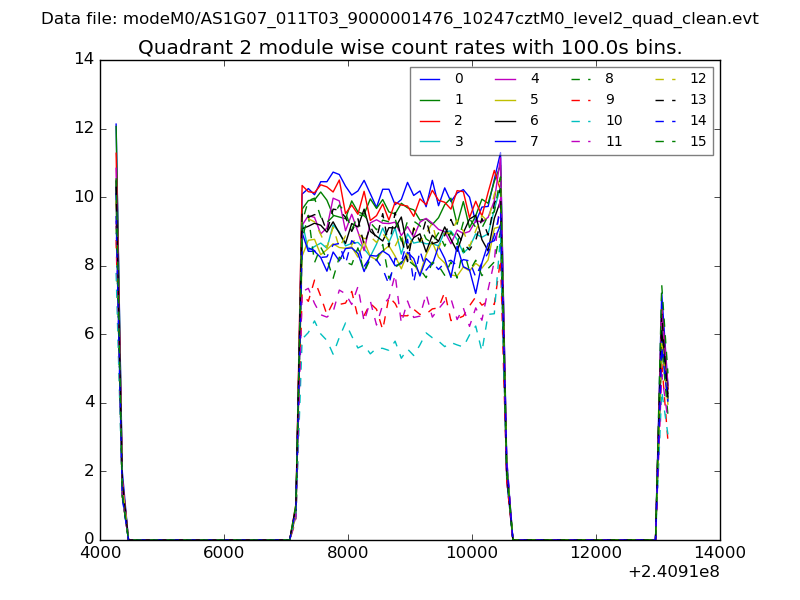
| Module-wise count rates for Quadrant C Data is divided into 100 sec bins |
 |
 |
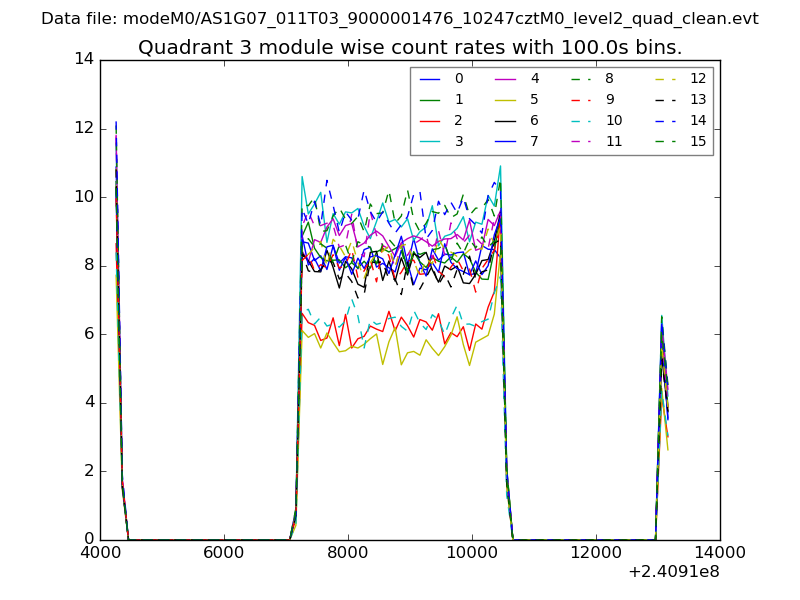
| Module-wise count rates for Quadrant D Data is divided into 100 sec bins |
 |
 |
| Parameter | Plot |
|---|---|
| CZT HV Monitor | 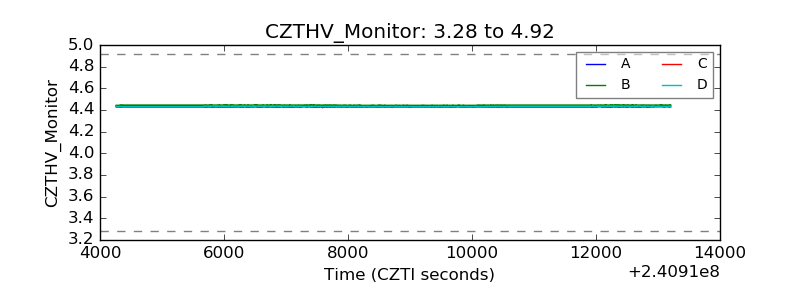 |
| D_VDD | 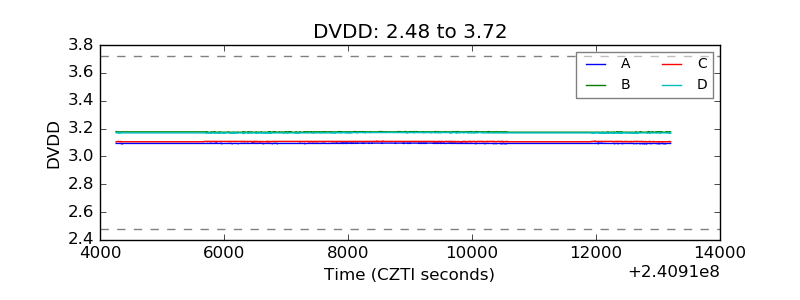 |
| Temperature 1 | 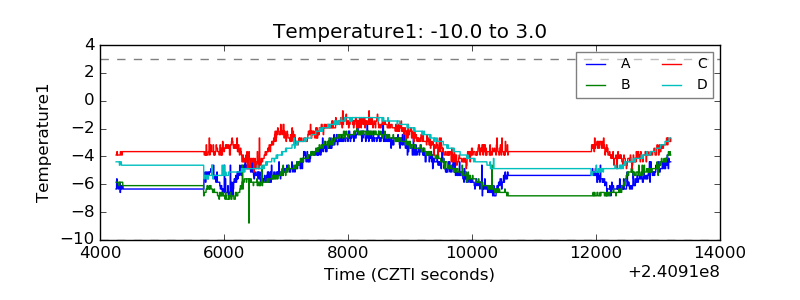 |
| Veto HV Monitor | 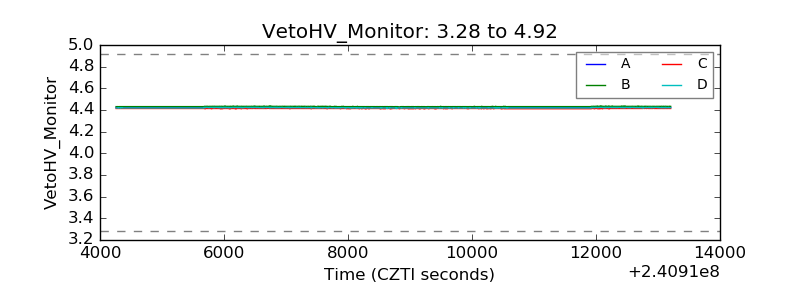 |
| Veto LLD | 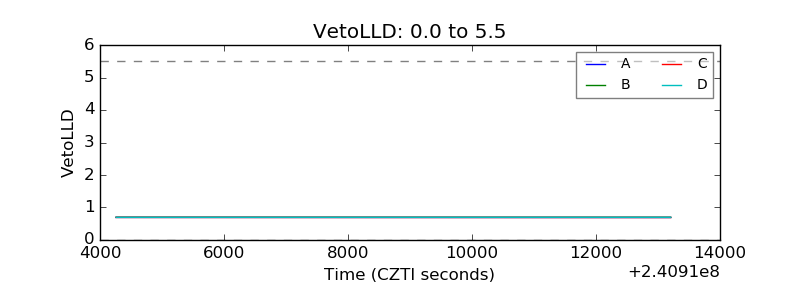 |
| Alpha Counter | 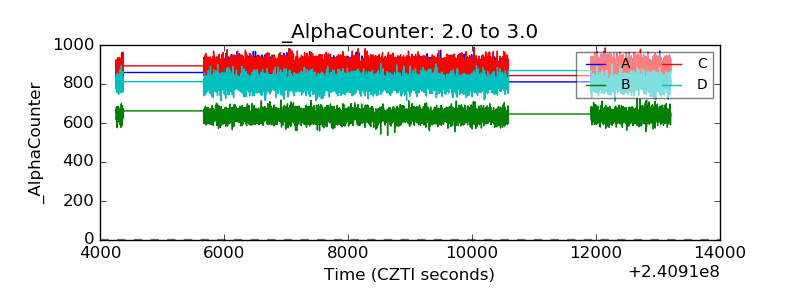 |
| _CPM_Rate | 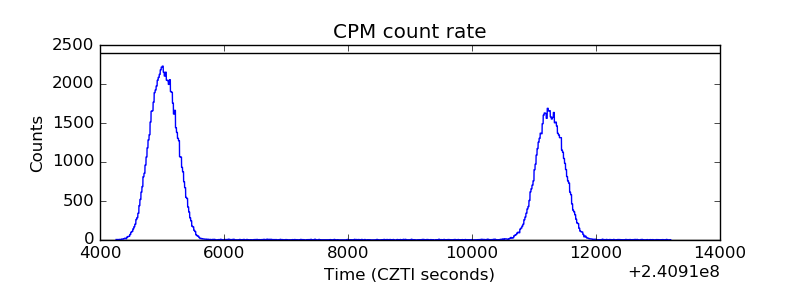 |
| CZT Counter | 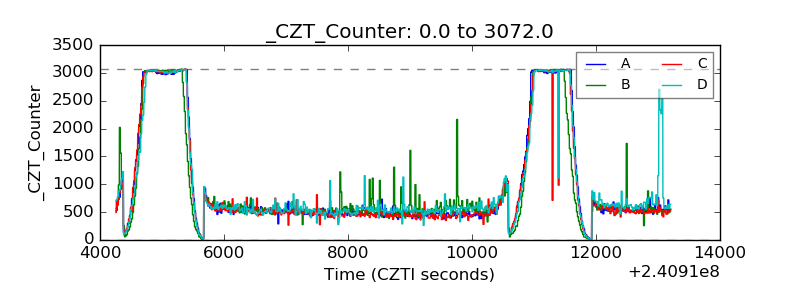 |
| +2.5 Volts monitor |  |
| +5 Volts monitor |  |
| _ROLL_ROT |  |
| _Roll_DEC |  |
| _Roll_RA | 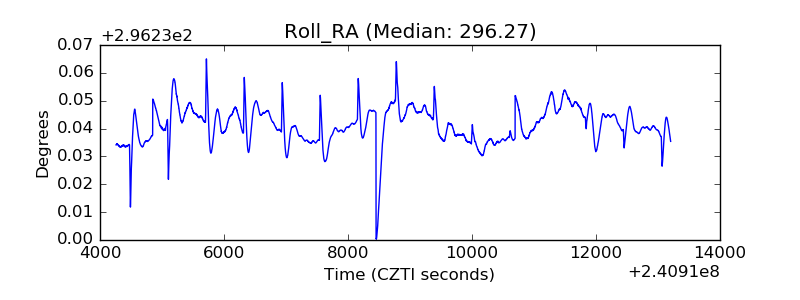 |
| Veto Counter | 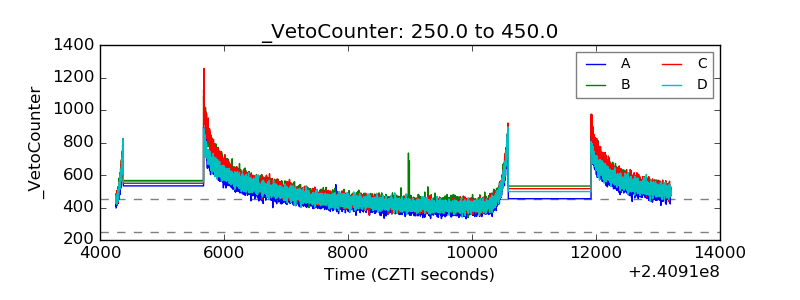 |