| Param | Original file | Final file |
|---|---|---|
| Filename | modeM0/AS1G07_011T03_9000001476_10248cztM0_level2.evt | modeM0/AS1G07_011T03_9000001476_10248cztM0_level2_quad_clean.evt |
| Size (bytes) | 363,507,840 | 77,293,440 |
| Size | 346.7 MB | 73.7 MB |
| Events in quadrant A | 2,465,980 | 505,734 |
| Events in quadrant B | 2,712,441 | 511,868 |
| Events in quadrant C | 2,384,428 | 502,871 |
| Events in quadrant D | 3,115,754 | 479,653 |
| Mode SS | |||
|---|---|---|---|
| Quadrant | BADHDUFLAG | Total packets | Discarded packets |
| A | 0 | 98 | 0 |
| B | 0 | 98 | 0 |
| C | 0 | 98 | 0 |
| D | 0 | 98 | 0 |
| Mode M0 | |||
|---|---|---|---|
| Quadrant | BADHDUFLAG | Total packets | Discarded packets |
| A | 0 | 10257 | 1 |
| B | 0 | 11052 | 1 |
| C | 0 | 10161 | 1 |
| D | 0 | 12380 | 1 |
| Mode M9 | |||
|---|---|---|---|
| Quadrant | BADHDUFLAG | Total packets | Discarded packets |
| A | 0 | 14 | 0 |
| B | 0 | 14 | 0 |
| C | 0 | 14 | 0 |
| D | 0 | 14 | 0 |
| Quadrant | Total seconds | Saturated seconds | Saturation percentage |
|---|---|---|---|
| A | 4854 | 66 | 1.359703% |
| B | 4854 | 86 | 1.771735% |
| C | 4854 | 62 | 1.277297% |
| D | 4854 | 113 | 2.327977% |
Noise dominated data is calculated using 1-second bins in cleaned event files. If a bin has >2000 counts, and if more than 50% of those come from <1% of pixels, then it is considered to be noise-dominated and hence unusable.
| Quadrant | # 1 sec bins | Bins with >0 counts | Bins with >2000 counts | High rate bins dominated by noise | Noise dominated (total time) | Noise dominated (detector-on time) | Marked lightcurve |
|---|---|---|---|---|---|---|---|
| A | 6189 | 4854 | 0 | 0 | 0.00% | 0.00% | 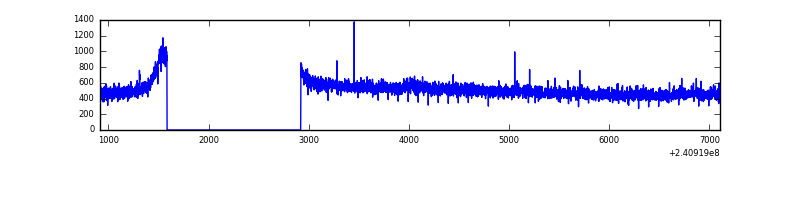 |
| B | 6189 | 4854 | 9 | 9 | 0.15% | 0.19% | 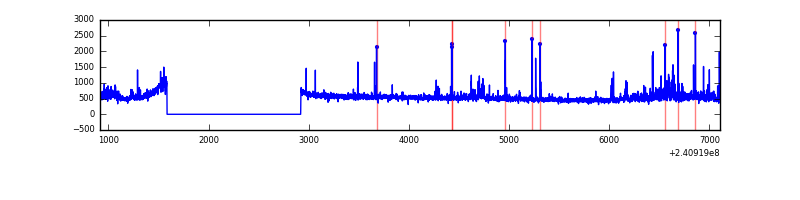 |
| C | 6189 | 4854 | 0 | 0 | 0.00% | 0.00% | 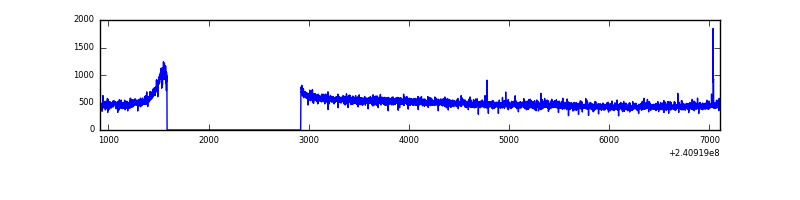 |
| D | 6189 | 4855 | 49 | 49 | 0.79% | 1.01% | 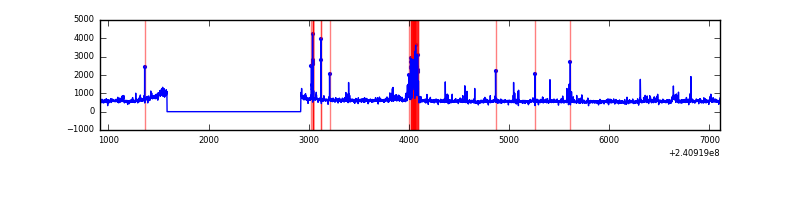 |
Top three noisy pixels from each quadrant. If the there are fewer than three noisy pixels in the level2.evt file, extra rows are filled as -1
| Pixel properties | Quadrant properties | ||||||
|---|---|---|---|---|---|---|---|
| Quadrant | DetID | PixID | Counts | Sigma | Mean | Median | Sigma |
| A | 8 | 15 | 21717 | 166.0 | 631 | 619 | 127.1 |
| A | 13 | 14 | 9074 | 66.53 | 631 | 619 | 127.1 |
| A | 0 | 226 | 5834 | 41.03 | 631 | 619 | 127.1 |
| B | 11 | 51 | 106794 | 889.27 | 629 | 614 | 119.4 |
| B | 10 | 247 | 71664 | 595.05 | 629 | 614 | 119.4 |
| B | 4 | 239 | 35575 | 292.8 | 629 | 614 | 119.4 |
| C | 0 | 207 | 10872 | 73.25 | 606 | 609 | 140.1 |
| C | 14 | 67 | 5486 | 34.81 | 606 | 609 | 140.1 |
| C | 14 | 234 | 5406 | 34.24 | 606 | 609 | 140.1 |
| D | 8 | 195 | 485198 | 3027.15 | 600 | 591 | 160.1 |
| D | 2 | 33 | 131565 | 818.14 | 600 | 591 | 160.1 |
| D | 1 | 52 | 93809 | 582.3 | 600 | 591 | 160.1 |
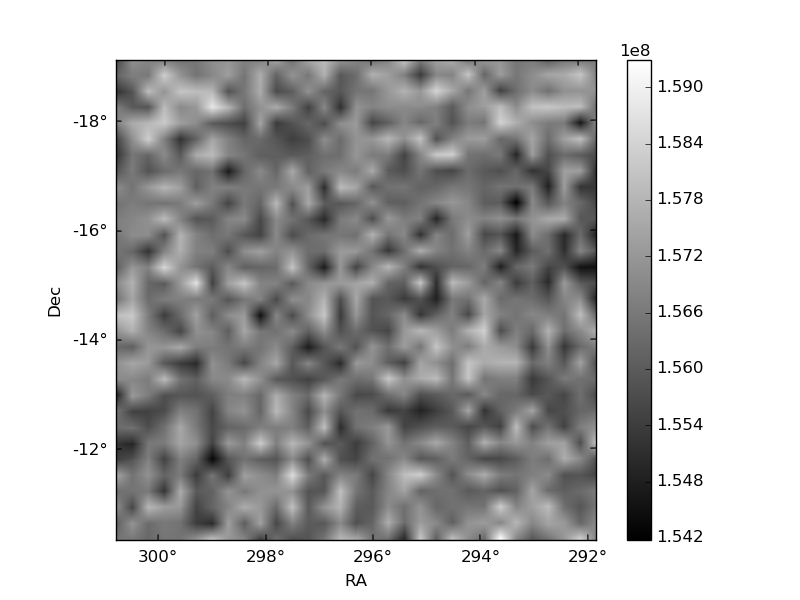
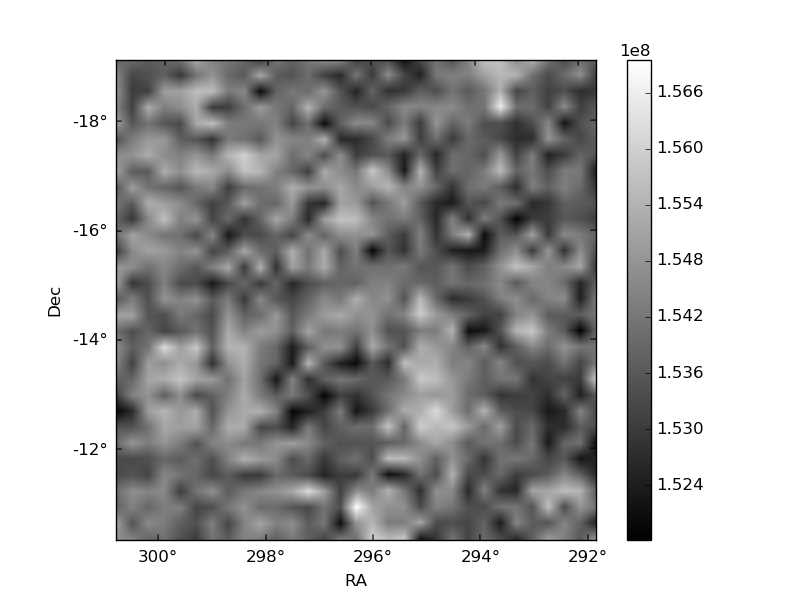
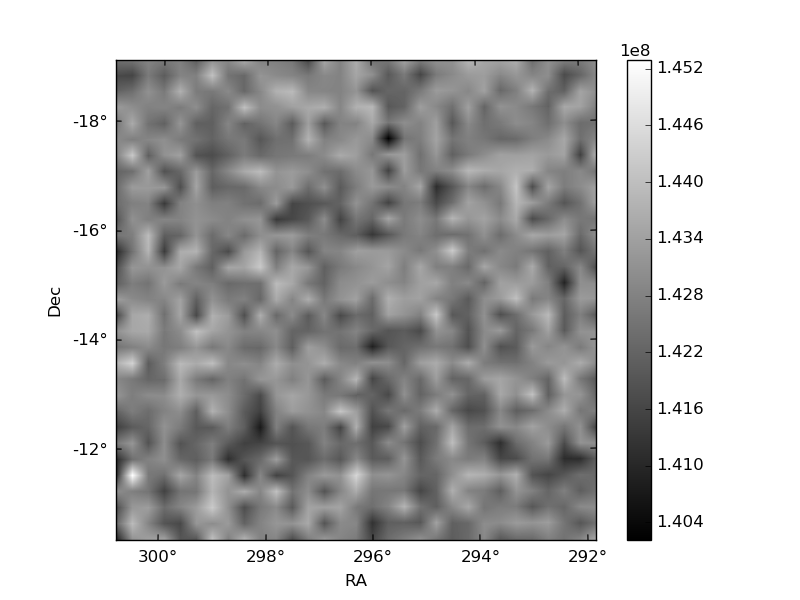
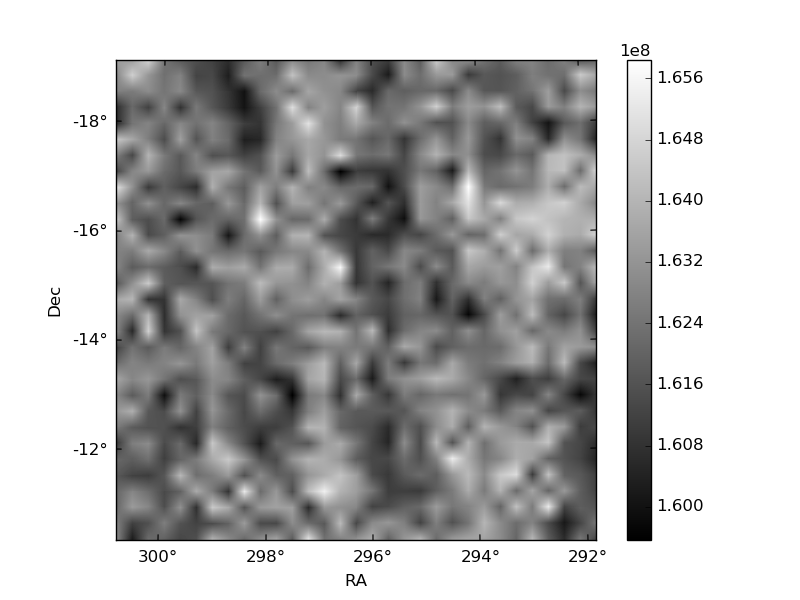
Histogram calculated using DETX and DETY for each event in the final _common_clean file
| Quadrant A | 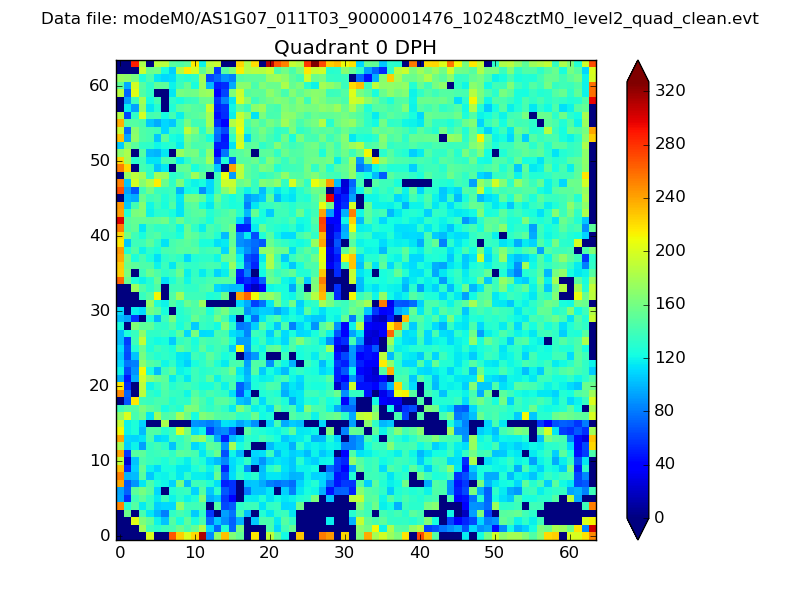 |
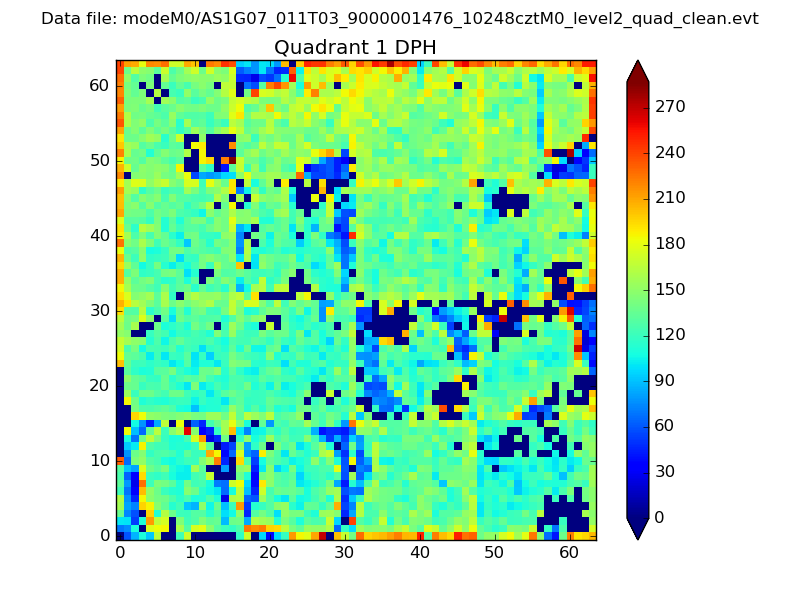 |
Quadrant B |
|---|---|---|---|
| Quadrant D | 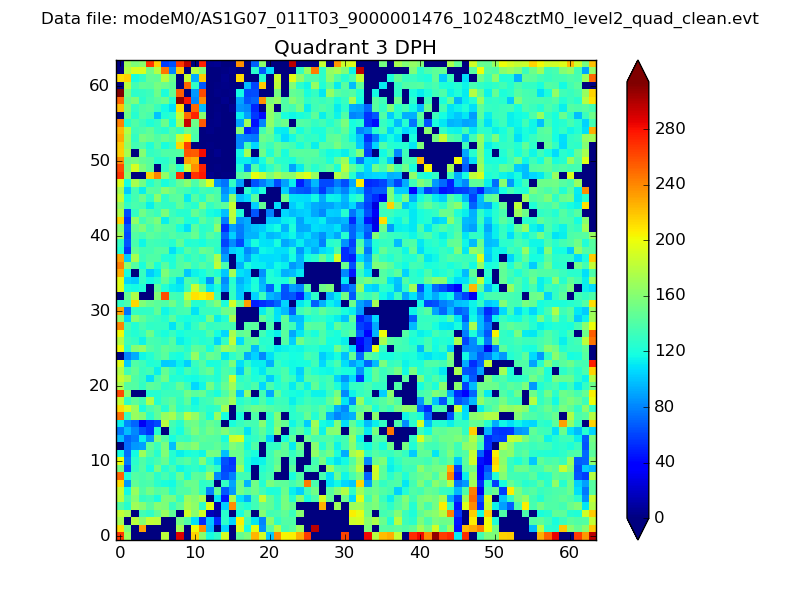 |
 |
Quadrant C |
| Plot type | Count rate plots | Images |
|---|---|---|
| Comparison with Poisson distribution Blue bars denote a histogram of data divided into 1 sec bins. Red curve is a Poisson curve with rate = median count rate of data. |
 |
 |
| Quadrant-wise count rates Data is divided into 100 sec bins |
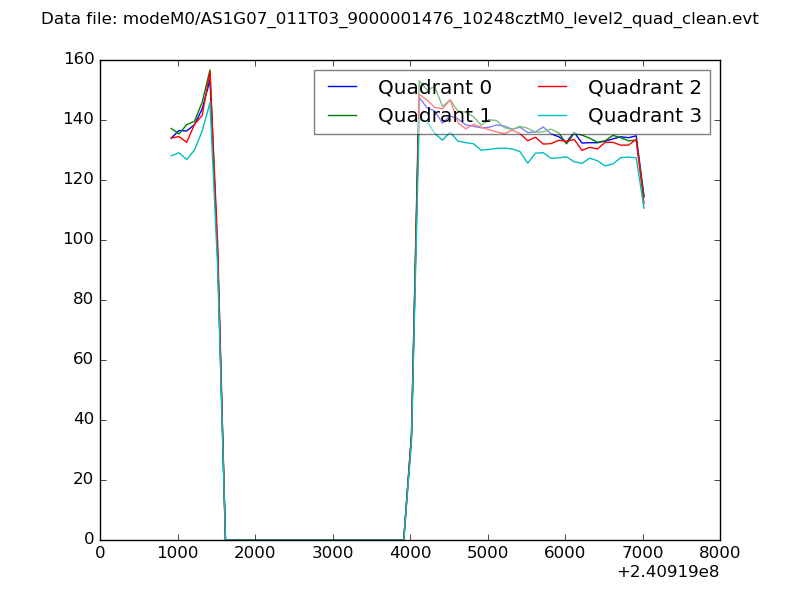 |
|
| Module-wise count rates for Quadrant A Data is divided into 100 sec bins |
 |
 |
| Module-wise count rates for Quadrant B Data is divided into 100 sec bins |
 |
 |
| Module-wise count rates for Quadrant C Data is divided into 100 sec bins |
 |
 |
| Module-wise count rates for Quadrant D Data is divided into 100 sec bins |
 |
 |
| Parameter | Plot |
|---|---|
| CZT HV Monitor |  |
| D_VDD | 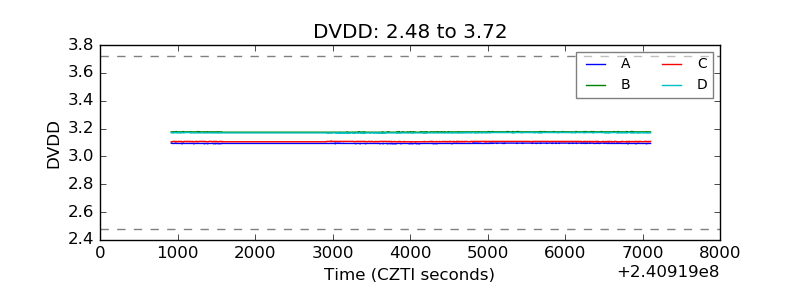 |
| Temperature 1 | 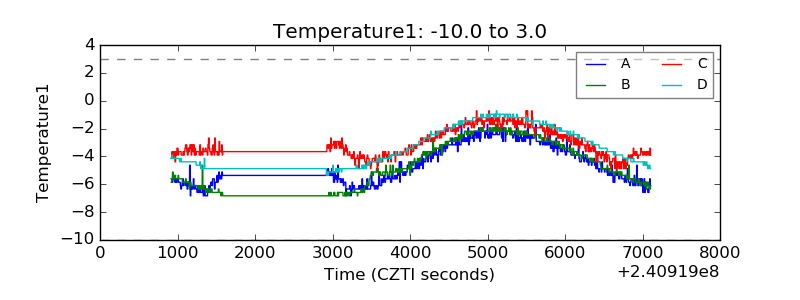 |
| Veto HV Monitor |  |
| Veto LLD | 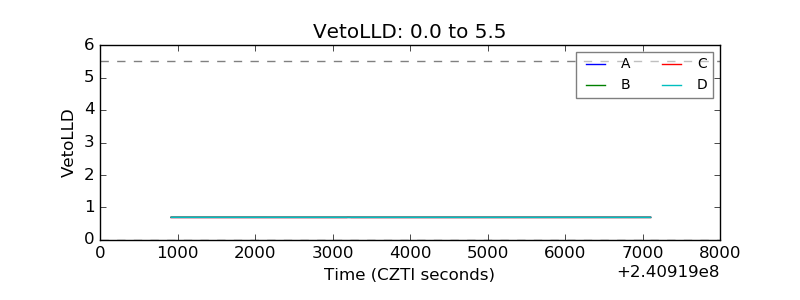 |
| Alpha Counter | 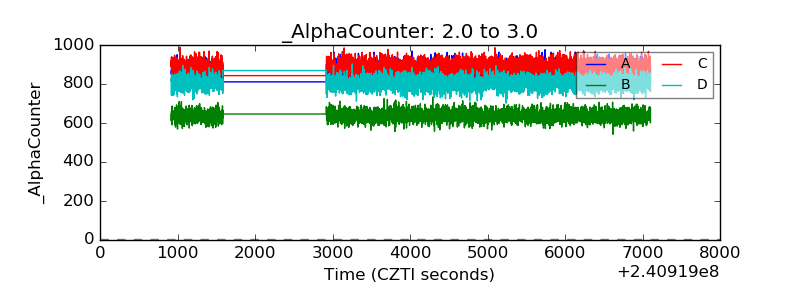 |
| _CPM_Rate | 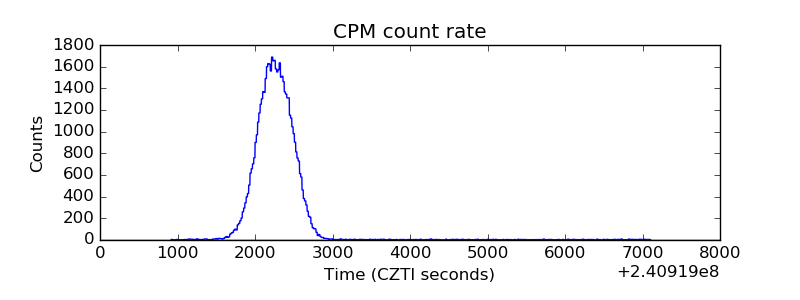 |
| CZT Counter |  |
| +2.5 Volts monitor |  |
| +5 Volts monitor |  |
| _ROLL_ROT |  |
| _Roll_DEC |  |
| _Roll_RA |  |
| Veto Counter |  |