| Param | Original file | Final file |
|---|---|---|
| Filename | modeM0/AS1C02_021T01_9000001482cztM0_level2.fits | modeM0/AS1C02_021T01_9000001482cztM0_level2_quad_clean.evt |
| Size (bytes) | 597,689,280 | 650,263,680 |
| Size | 570.0 MB | 620.1 MB |
| Events in quadrant A | 3,626,798 | 4,025,145 |
| Events in quadrant B | 3,440,560 | 3,949,018 |
| Events in quadrant C | 3,549,014 | 3,807,028 |
| Events in quadrant D | 3,069,178 | 3,499,628 |
| Mode M9 | |||
|---|---|---|---|
| Quadrant | BADHDUFLAG | Total packets | Discarded packets |
| A | 0 | 85 | 0 |
| B | 0 | 85 | 0 |
| C | 0 | 85 | 0 |
| D | 0 | 85 | 0 |
| Mode SS | |||
|---|---|---|---|
| Quadrant | BADHDUFLAG | Total packets | Discarded packets |
| A | 0 | 1098 | 0 |
| B | 0 | 1095 | 0 |
| C | 0 | 1095 | 0 |
| D | 0 | 1098 | 0 |
| Mode M0 | |||
|---|---|---|---|
| Quadrant | BADHDUFLAG | Total packets | Discarded packets |
| A | 0 | 137135 | 0 |
| B | 0 | 143282 | 0 |
| C | 0 | 133600 | 0 |
| D | 0 | 155090 | 0 |
| Quadrant | Total seconds | Saturated seconds | Saturation percentage |
|---|---|---|---|
| A | 65076 | 644 | 0.989612% |
| B | 64666 | 1007 | 1.557233% |
| C | 65360 | 407 | 0.622705% |
| D | 65120 | 1298 | 1.993243% |
Noise dominated data is calculated using 1-second bins in cleaned event files. If a bin has >2000 counts, and if more than 50% of those come from <1% of pixels, then it is considered to be noise-dominated and hence unusable.
| Quadrant | # 1 sec bins | Bins with >0 counts | Bins with >2000 counts | High rate bins dominated by noise | Noise dominated (total time) | Noise dominated (detector-on time) | Marked lightcurve |
|---|---|---|---|---|---|---|---|
| A | 102151 | 67306 | 0 | 0 | 0.00% | 0.00% |  |
| B | 102149 | 67024 | 0 | 0 | 0.00% | 0.00% |  |
| C | 102151 | 67534 | 0 | 0 | 0.00% | 0.00% |  |
| D | 102151 | 66121 | 0 | 0 | 0.00% | 0.00% |  |
Top three noisy pixels from each quadrant. If the there are fewer than three noisy pixels in the level2.evt file, extra rows are filled as -1
| Pixel properties | Quadrant properties | ||||||
|---|---|---|---|---|---|---|---|
| Quadrant | DetID | PixID | Counts | Sigma | Mean | Median | Sigma |
| A | 0 | 29 | 3580 | 11.42 | 944 | 886 | 235.9 |
| A | 7 | 110 | 3007 | 8.99 | 944 | 886 | 235.9 |
| A | 0 | 30 | 2744 | 7.88 | 944 | 886 | 235.9 |
| B | 2 | 9 | 2985 | 11.9 | 909 | 870 | 177.7 |
| B | 14 | 254 | 2339 | 8.27 | 909 | 870 | 177.7 |
| B | 12 | 226 | 2337 | 8.26 | 909 | 870 | 177.7 |
| C | 1 | 81 | 2724 | 7.59 | 936 | 873 | 243.7 |
| C | 1 | 80 | 2690 | 7.45 | 936 | 873 | 243.7 |
| C | 12 | 241 | 2477 | 6.58 | 936 | 873 | 243.7 |
| D | 6 | 231 | 2322 | 6.41 | 876 | 794 | 238.4 |
| D | 7 | 3 | 2237 | 6.05 | 876 | 794 | 238.4 |
| D | 3 | 14 | 2230 | 6.02 | 876 | 794 | 238.4 |
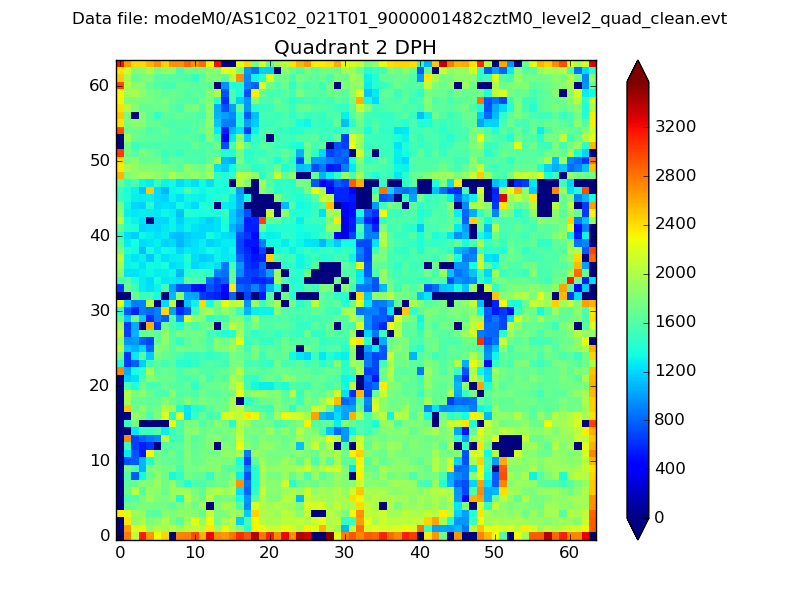
Histogram calculated using DETX and DETY for each event in the final _common_clean file
| Quadrant A |  |
 |
Quadrant B |
|---|---|---|---|
| Quadrant D | 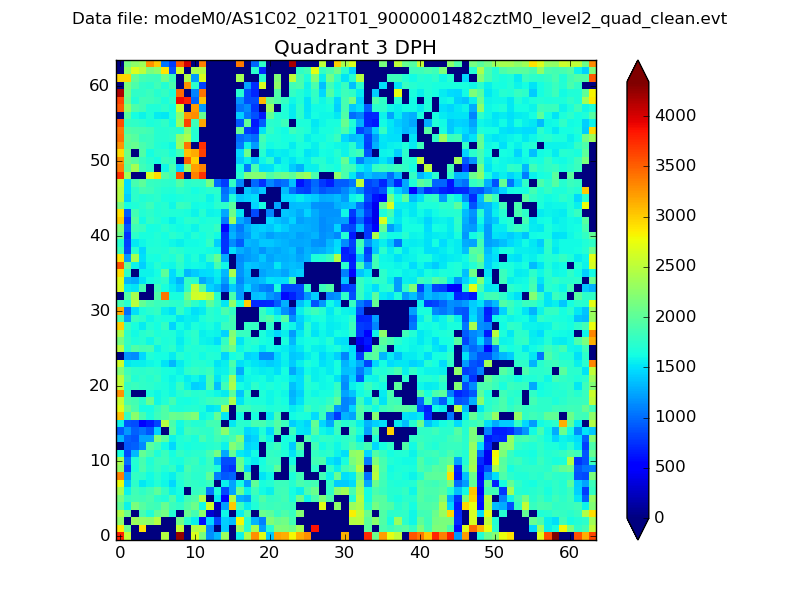 |
 |
Quadrant C |
| Plot type | Count rate plots | Images |
|---|---|---|
| Comparison with Poisson distribution Blue bars denote a histogram of data divided into 1 sec bins. Red curve is a Poisson curve with rate = median count rate of data. |
 |
 |
| Quadrant-wise count rates Data is divided into 100 sec bins |
 |
|
| Module-wise count rates for Quadrant A Data is divided into 100 sec bins |
 |
 |
| Module-wise count rates for Quadrant B Data is divided into 100 sec bins |
 |
 |
| Module-wise count rates for Quadrant C Data is divided into 100 sec bins |
 |
 |
| Module-wise count rates for Quadrant D Data is divided into 100 sec bins |
 |
 |
| Parameter | Plot |
|---|---|
| CZT HV Monitor |  |
| D_VDD |  |
| Temperature 1 |  |
| Veto HV Monitor |  |
| Veto LLD |  |
| Alpha Counter |  |
| _CPM_Rate |  |
| CZT Counter |  |
| +2.5 Volts monitor |  |
| +5 Volts monitor |  |
| _ROLL_ROT |  |
| _Roll_DEC |  |
| _Roll_RA |  |
| Veto Counter |  |