| Param | Original file | Final file |
|---|---|---|
| Filename | modeM0/AS1C02_021T01_9000001482_10271cztM0_level2.evt | modeM0/AS1C02_021T01_9000001482_10271cztM0_level2_quad_clean.evt |
| Size (bytes) | 462,614,400 | 84,240,000 |
| Size | 441.2 MB | 80.3 MB |
| Events in quadrant A | 3,094,753 | 524,409 |
| Events in quadrant B | 3,514,996 | 530,496 |
| Events in quadrant C | 2,949,269 | 525,181 |
| Events in quadrant D | 3,988,349 | 496,076 |
| Mode M9 | |||
|---|---|---|---|
| Quadrant | BADHDUFLAG | Total packets | Discarded packets |
| A | 0 | 15 | 0 |
| B | 0 | 15 | 0 |
| C | 0 | 15 | 0 |
| D | 0 | 15 | 0 |
| Mode SS | |||
|---|---|---|---|
| Quadrant | BADHDUFLAG | Total packets | Discarded packets |
| A | 0 | 140 | 0 |
| B | 0 | 140 | 0 |
| C | 0 | 140 | 0 |
| D | 0 | 140 | 0 |
| Mode M0 | |||
|---|---|---|---|
| Quadrant | BADHDUFLAG | Total packets | Discarded packets |
| A | 0 | 14020 | 7 |
| B | 0 | 15065 | 4 |
| C | 0 | 13730 | 2 |
| D | 0 | 16573 | 5 |
| Quadrant | Total seconds | Saturated seconds | Saturation percentage |
|---|---|---|---|
| A | 6805 | 44 | 0.646583% |
| B | 6806 | 97 | 1.425213% |
| C | 6807 | 13 | 0.190980% |
| D | 6806 | 279 | 4.099324% |
Noise dominated data is calculated using 1-second bins in cleaned event files. If a bin has >2000 counts, and if more than 50% of those come from <1% of pixels, then it is considered to be noise-dominated and hence unusable.
| Quadrant | # 1 sec bins | Bins with >0 counts | Bins with >2000 counts | High rate bins dominated by noise | Noise dominated (total time) | Noise dominated (detector-on time) | Marked lightcurve |
|---|---|---|---|---|---|---|---|
| A | 7732 | 6808 | 15 | 15 | 0.19% | 0.22% | 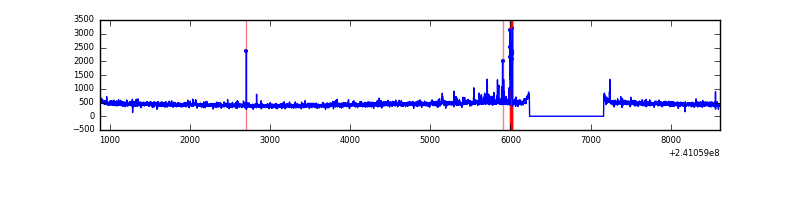 |
| B | 7732 | 6808 | 39 | 39 | 0.50% | 0.57% | 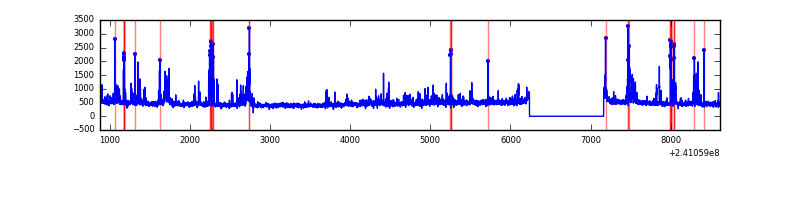 |
| C | 7732 | 6808 | 0 | 0 | 0.00% | 0.00% | 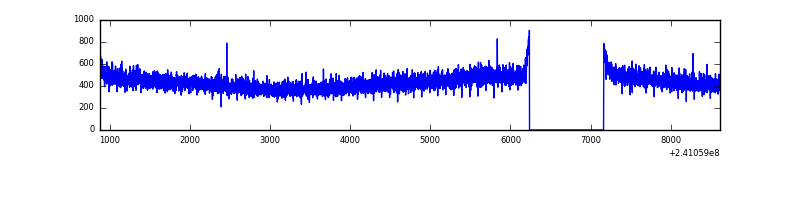 |
| D | 7732 | 6808 | 257 | 257 | 3.32% | 3.77% | 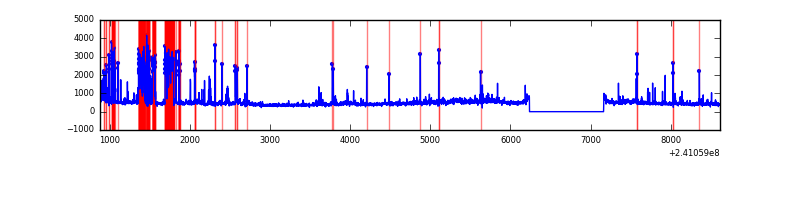 |
Top three noisy pixels from each quadrant. If the there are fewer than three noisy pixels in the level2.evt file, extra rows are filled as -1
| Pixel properties | Quadrant properties | ||||||
|---|---|---|---|---|---|---|---|
| Quadrant | DetID | PixID | Counts | Sigma | Mean | Median | Sigma |
| A | 14 | 238 | 92926 | 592.58 | 770 | 754 | 155.5 |
| A | 8 | 15 | 14816 | 90.41 | 770 | 754 | 155.5 |
| A | 3 | 1 | 11843 | 71.29 | 770 | 754 | 155.5 |
| B | 4 | 239 | 390825 | 2653.7 | 774 | 756 | 147.0 |
| B | 11 | 51 | 56226 | 377.37 | 774 | 756 | 147.0 |
| B | 0 | 214 | 35183 | 234.21 | 774 | 756 | 147.0 |
| C | 13 | 61 | 5721 | 28.45 | 754 | 756 | 174.5 |
| C | 14 | 67 | 4407 | 20.92 | 754 | 756 | 174.5 |
| C | 8 | 222 | 2035 | 7.33 | 754 | 756 | 174.5 |
| D | 1 | 52 | 851703 | 4840.64 | 733 | 711 | 175.8 |
| D | 8 | 195 | 142023 | 803.82 | 733 | 711 | 175.8 |
| D | 2 | 14 | 79907 | 450.49 | 733 | 711 | 175.8 |
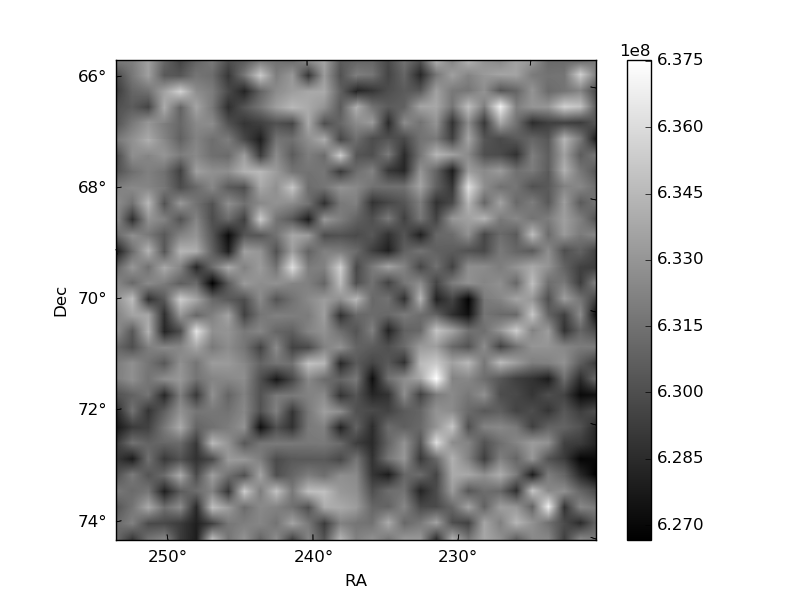
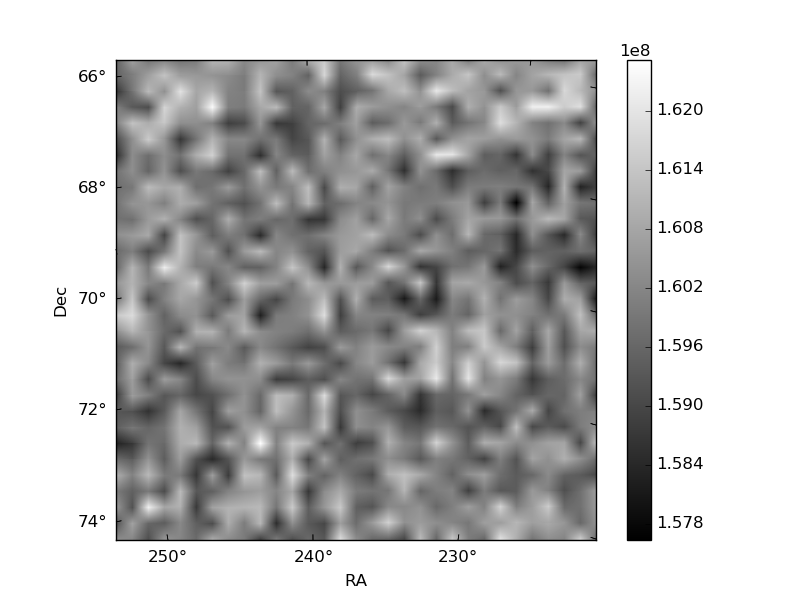
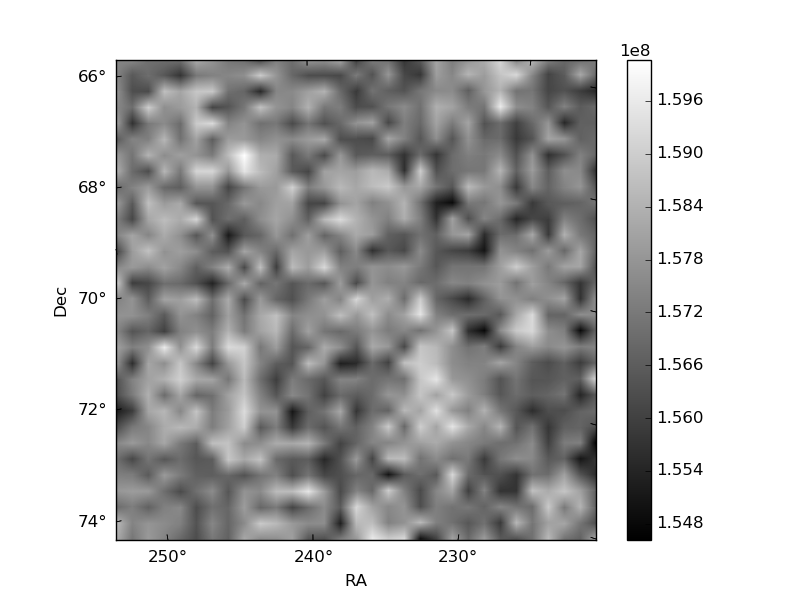
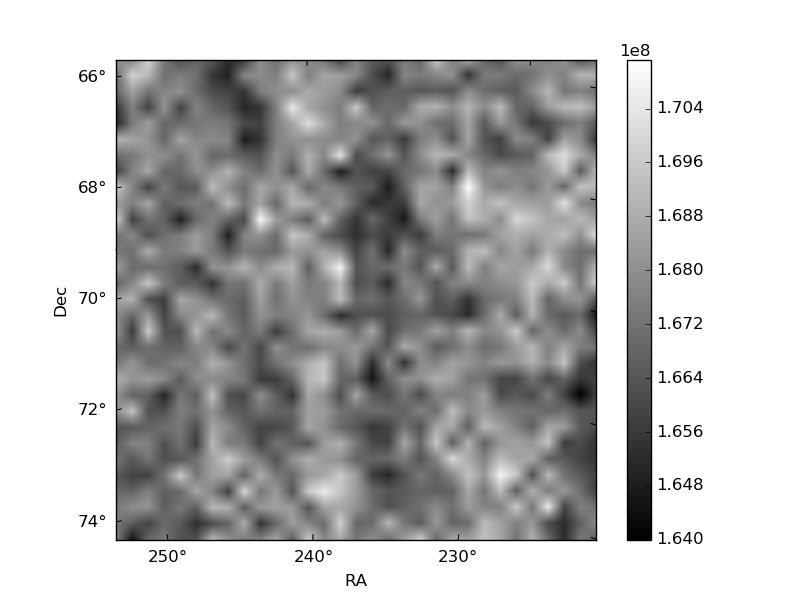
Histogram calculated using DETX and DETY for each event in the final _common_clean file
| Quadrant A | 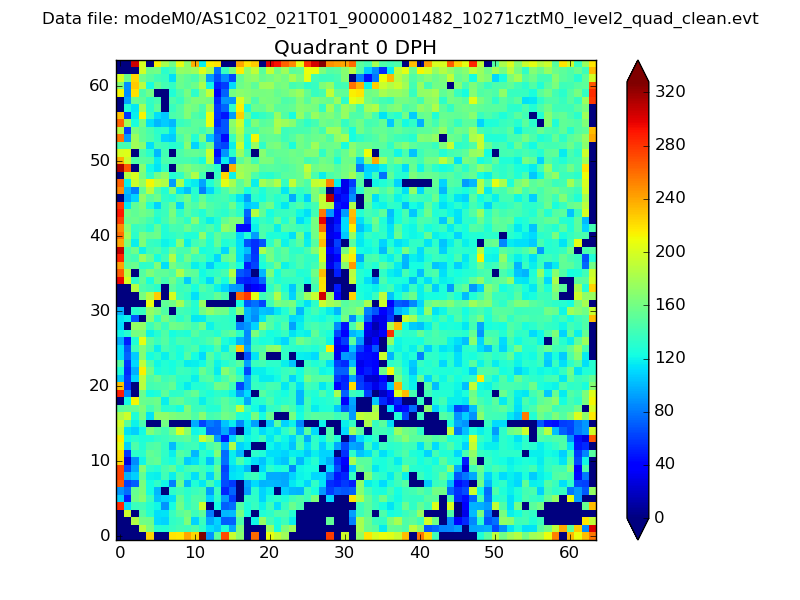 |
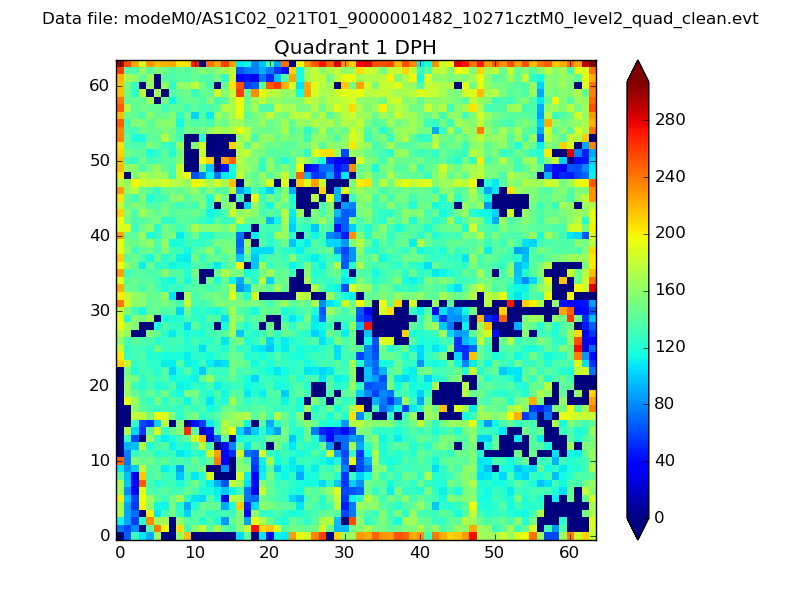 |
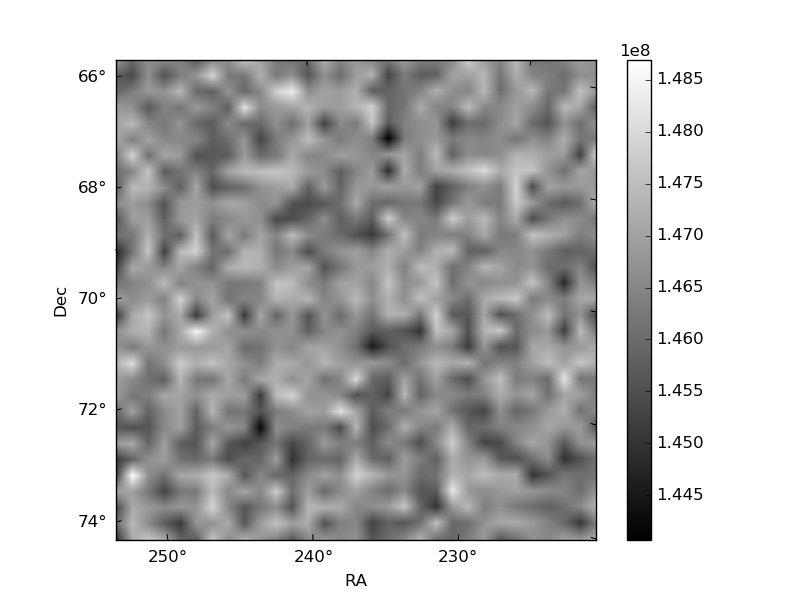
Quadrant B |
|---|---|---|---|
| Quadrant D |  |
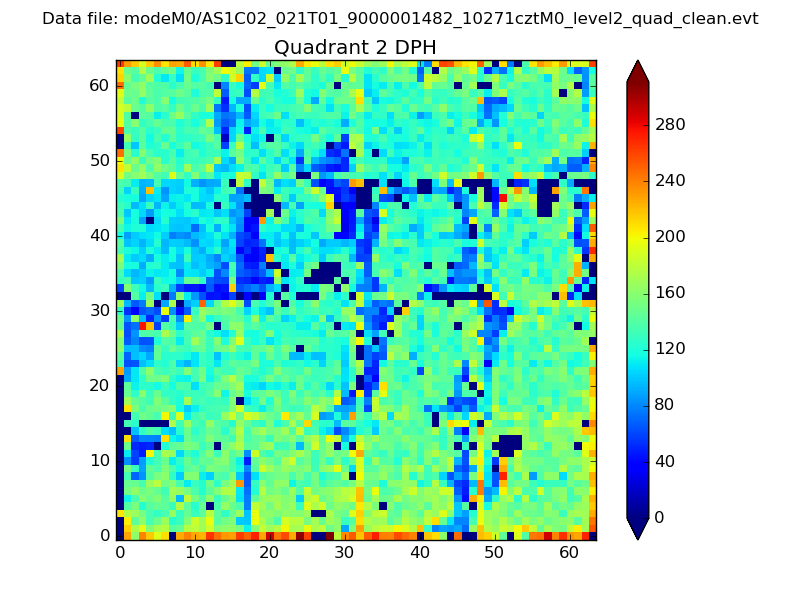 |
Quadrant C |
| Plot type | Count rate plots | Images |
|---|---|---|
| Comparison with Poisson distribution Blue bars denote a histogram of data divided into 1 sec bins. Red curve is a Poisson curve with rate = median count rate of data. |
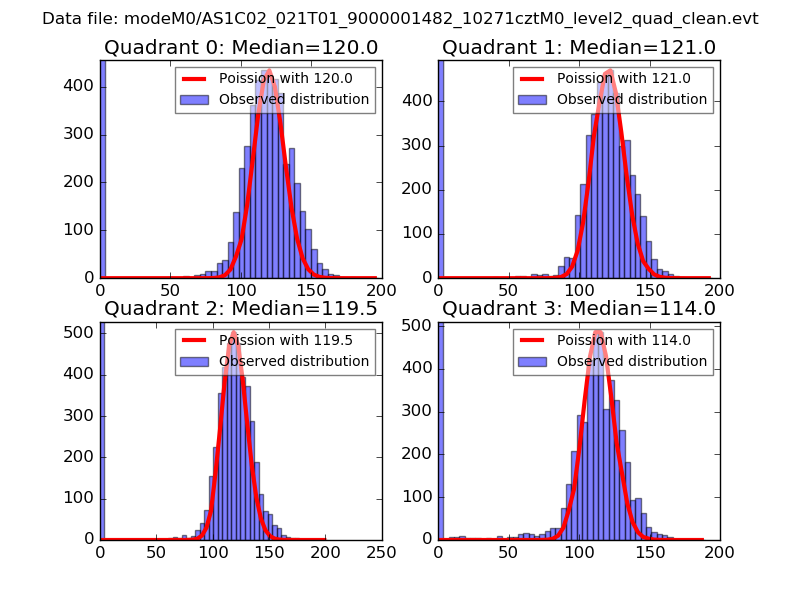 |
 |
| Quadrant-wise count rates Data is divided into 100 sec bins |
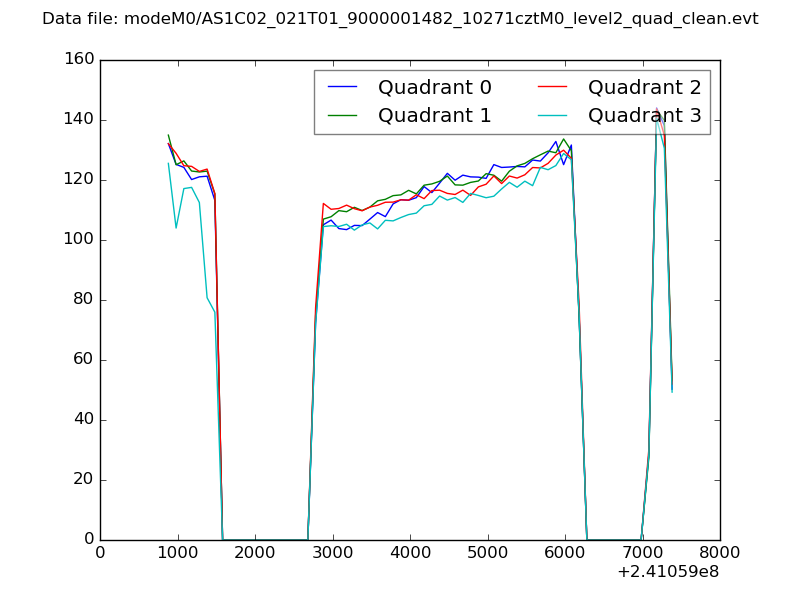 |
|
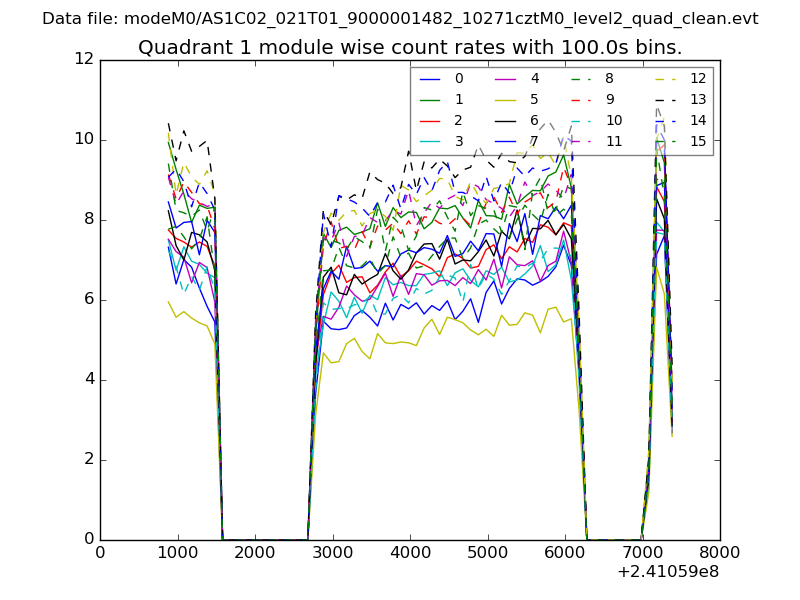
| Module-wise count rates for Quadrant A Data is divided into 100 sec bins |
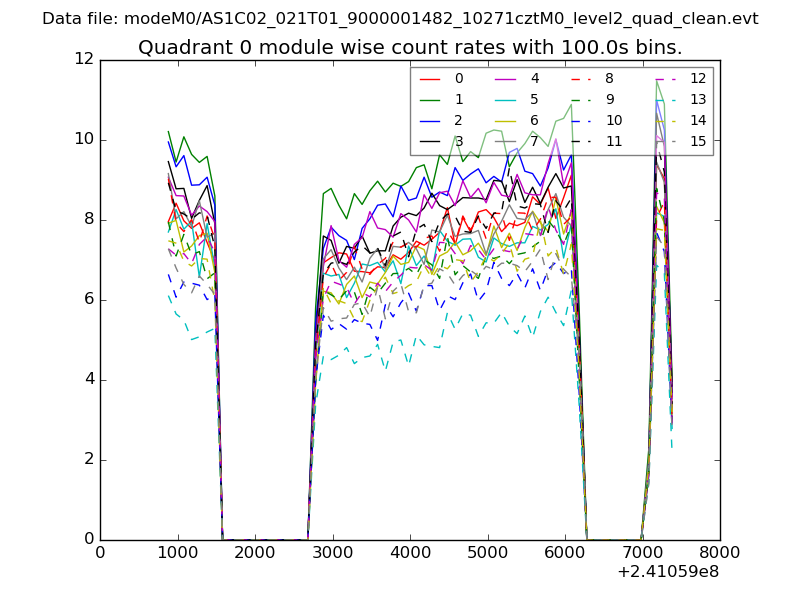 |
 |
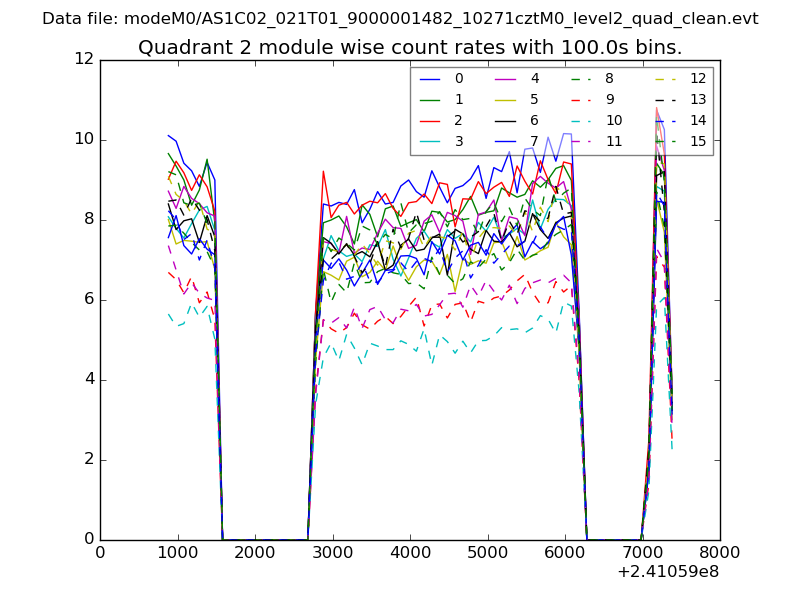
| Module-wise count rates for Quadrant B Data is divided into 100 sec bins |
 |
 |
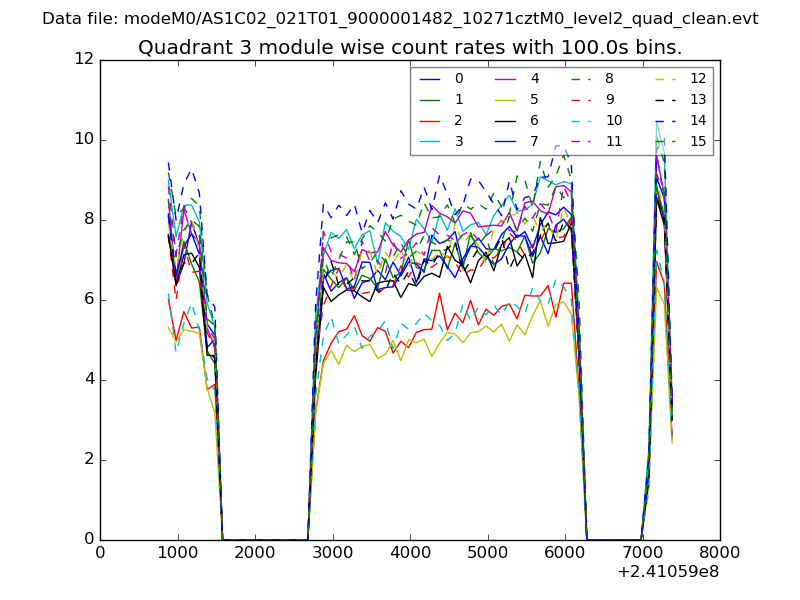
| Module-wise count rates for Quadrant C Data is divided into 100 sec bins |
 |
 |
| Module-wise count rates for Quadrant D Data is divided into 100 sec bins |
 |
 |
| Parameter | Plot |
|---|---|
| CZT HV Monitor | 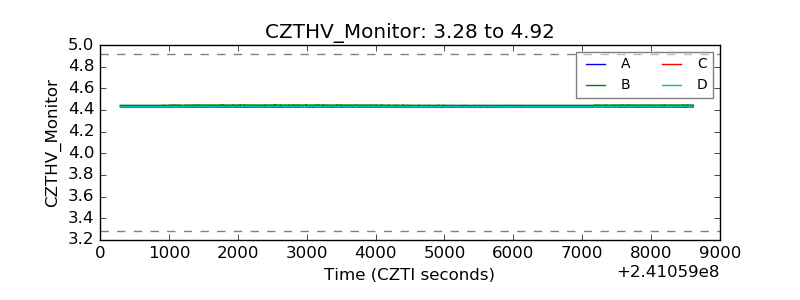 |
| D_VDD | 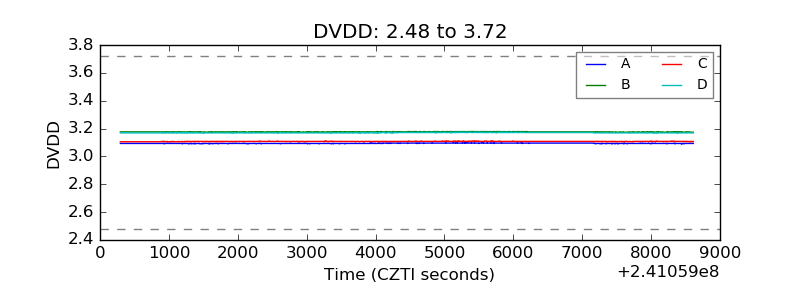 |
| Temperature 1 | 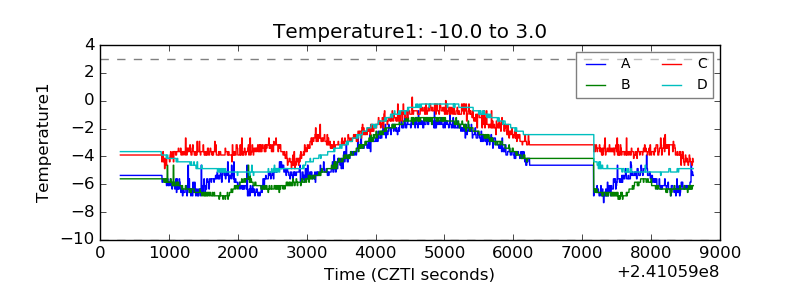 |
| Veto HV Monitor | 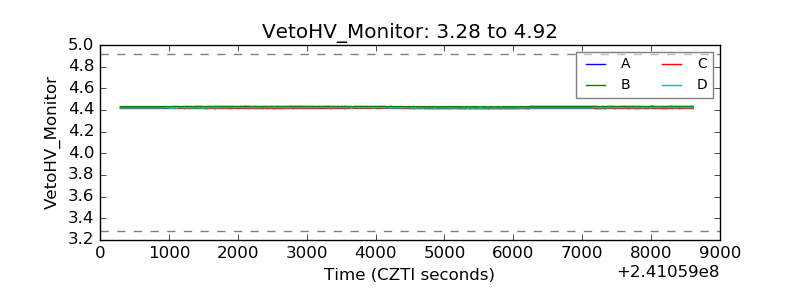 |
| Veto LLD | 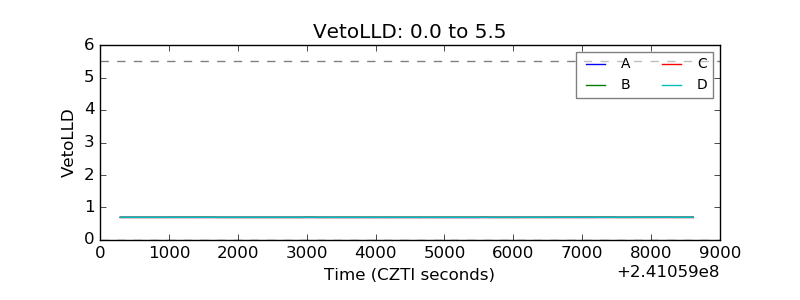 |
| Alpha Counter | 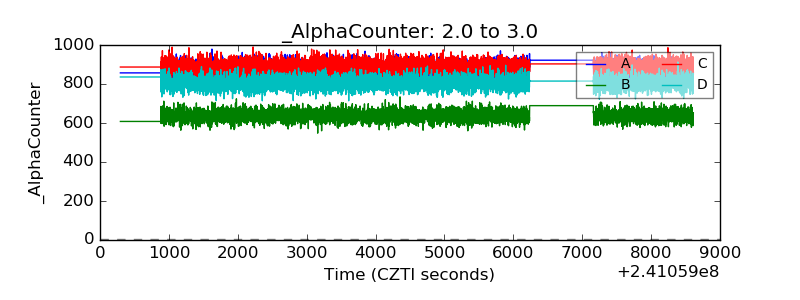 |
| _CPM_Rate | 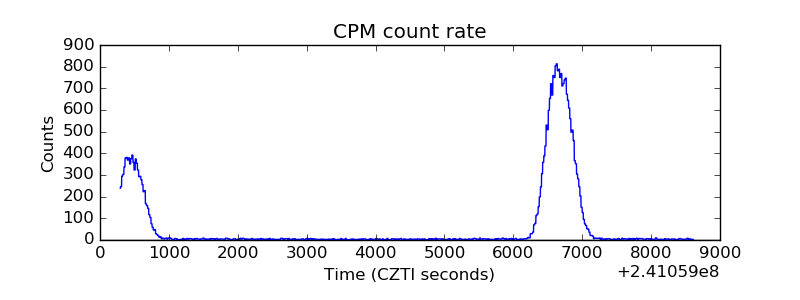 |
| CZT Counter | 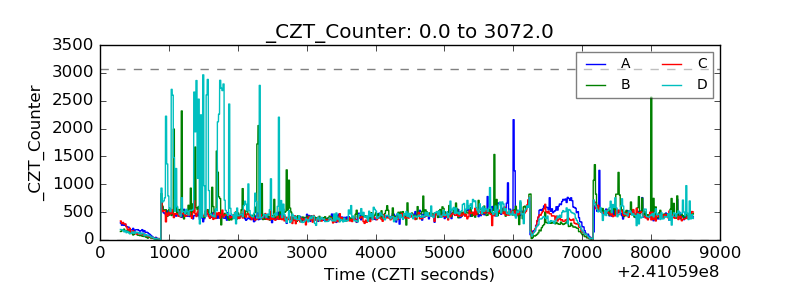 |
| +2.5 Volts monitor |  |
| +5 Volts monitor |  |
| _ROLL_ROT | 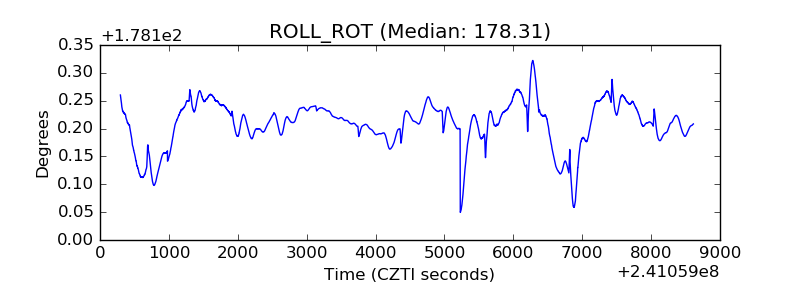 |
| _Roll_DEC | 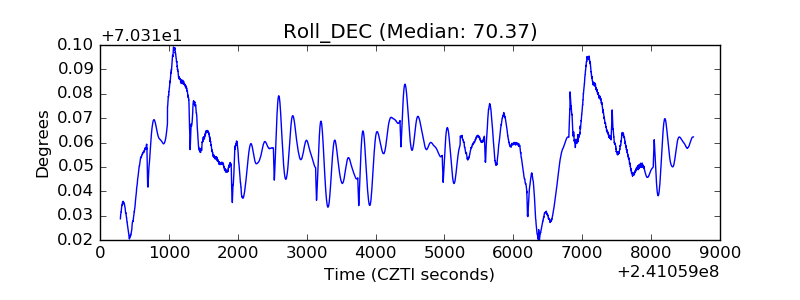 |
| _Roll_RA | 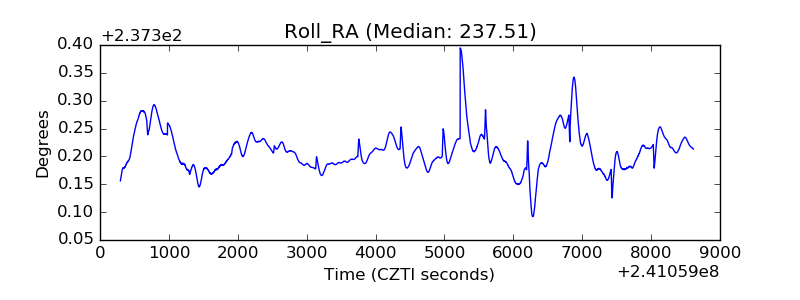 |
| Veto Counter | 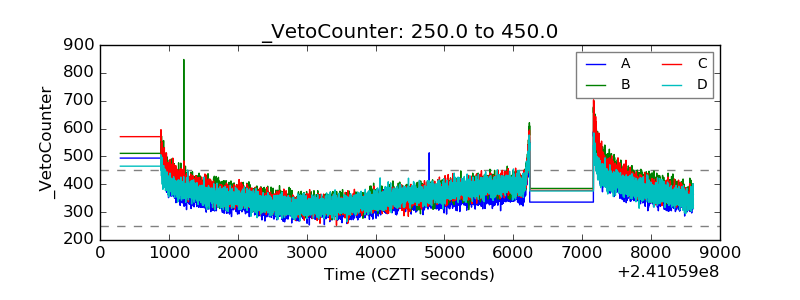 |