| Param | Original file | Final file |
|---|---|---|
| Filename | modeM0/AS1C02_021T01_9000001482_10273cztM0_level2.evt | modeM0/AS1C02_021T01_9000001482_10273cztM0_level2_quad_clean.evt |
| Size (bytes) | 428,791,680 | 82,080,000 |
| Size | 408.9 MB | 78.3 MB |
| Events in quadrant A | 2,984,775 | 514,239 |
| Events in quadrant B | 3,382,766 | 516,410 |
| Events in quadrant C | 2,866,281 | 509,387 |
| Events in quadrant D | 3,308,291 | 490,232 |
| Mode M9 | |||
|---|---|---|---|
| Quadrant | BADHDUFLAG | Total packets | Discarded packets |
| A | 0 | 13 | 0 |
| B | 0 | 13 | 0 |
| C | 0 | 13 | 0 |
| D | 0 | 14 | 0 |
| Mode SS | |||
|---|---|---|---|
| Quadrant | BADHDUFLAG | Total packets | Discarded packets |
| A | 0 | 132 | 0 |
| B | 0 | 132 | 0 |
| C | 0 | 132 | 0 |
| D | 0 | 132 | 0 |
| Mode M0 | |||
|---|---|---|---|
| Quadrant | BADHDUFLAG | Total packets | Discarded packets |
| A | 0 | 13313 | 3 |
| B | 0 | 14424 | 2 |
| C | 0 | 13223 | 2 |
| D | 0 | 14307 | 2 |
| Quadrant | Total seconds | Saturated seconds | Saturation percentage |
|---|---|---|---|
| A | 6528 | 31 | 0.474877% |
| B | 6528 | 94 | 1.439951% |
| C | 6528 | 14 | 0.214461% |
| D | 6528 | 76 | 1.164216% |
Noise dominated data is calculated using 1-second bins in cleaned event files. If a bin has >2000 counts, and if more than 50% of those come from <1% of pixels, then it is considered to be noise-dominated and hence unusable.
| Quadrant | # 1 sec bins | Bins with >0 counts | Bins with >2000 counts | High rate bins dominated by noise | Noise dominated (total time) | Noise dominated (detector-on time) | Marked lightcurve |
|---|---|---|---|---|---|---|---|
| A | 7618 | 6529 | 0 | 0 | 0.00% | 0.00% | 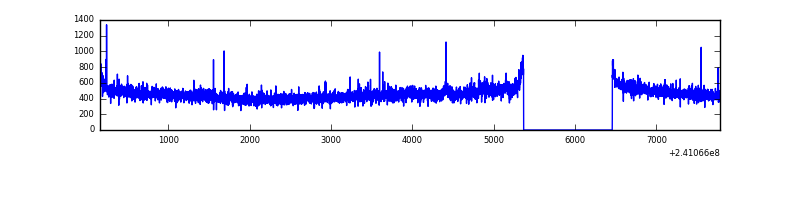 |
| B | 7618 | 6529 | 31 | 31 | 0.41% | 0.47% | 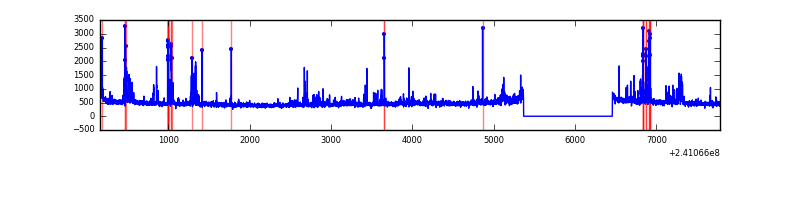 |
| C | 7618 | 6529 | 0 | 0 | 0.00% | 0.00% | 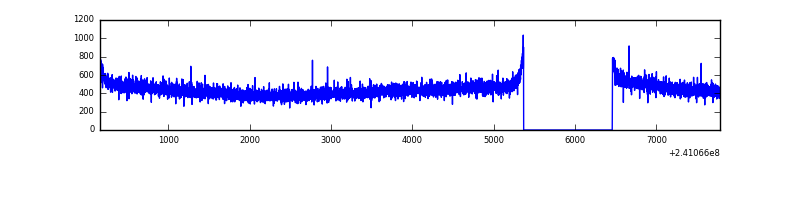 |
| D | 7618 | 6529 | 38 | 38 | 0.50% | 0.58% | 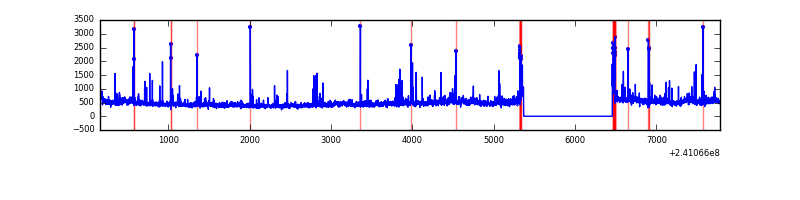 |
Top three noisy pixels from each quadrant. If the there are fewer than three noisy pixels in the level2.evt file, extra rows are filled as -1
| Pixel properties | Quadrant properties | ||||||
|---|---|---|---|---|---|---|---|
| Quadrant | DetID | PixID | Counts | Sigma | Mean | Median | Sigma |
| A | 8 | 15 | 46551 | 295.0 | 760 | 742 | 155.3 |
| A | 0 | 226 | 6939 | 39.91 | 760 | 742 | 155.3 |
| A | 3 | 1 | 6791 | 38.95 | 760 | 742 | 155.3 |
| B | 4 | 239 | 288600 | 1999.78 | 760 | 742 | 143.9 |
| B | 11 | 51 | 79036 | 543.92 | 760 | 742 | 143.9 |
| B | 0 | 214 | 24021 | 161.72 | 760 | 742 | 143.9 |
| C | 13 | 61 | 5452 | 27.72 | 734 | 736 | 170.1 |
| C | 14 | 67 | 3544 | 16.5 | 734 | 736 | 170.1 |
| C | 3 | 202 | 1804 | 6.28 | 734 | 736 | 170.1 |
| D | 8 | 195 | 136405 | 772.62 | 726 | 704 | 175.6 |
| D | 1 | 52 | 98965 | 559.45 | 726 | 704 | 175.6 |
| D | 2 | 14 | 89992 | 508.37 | 726 | 704 | 175.6 |
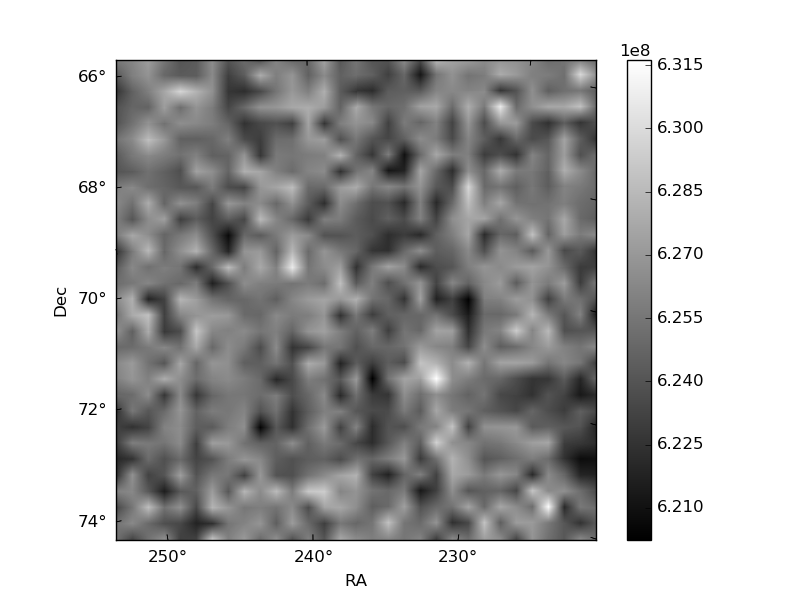
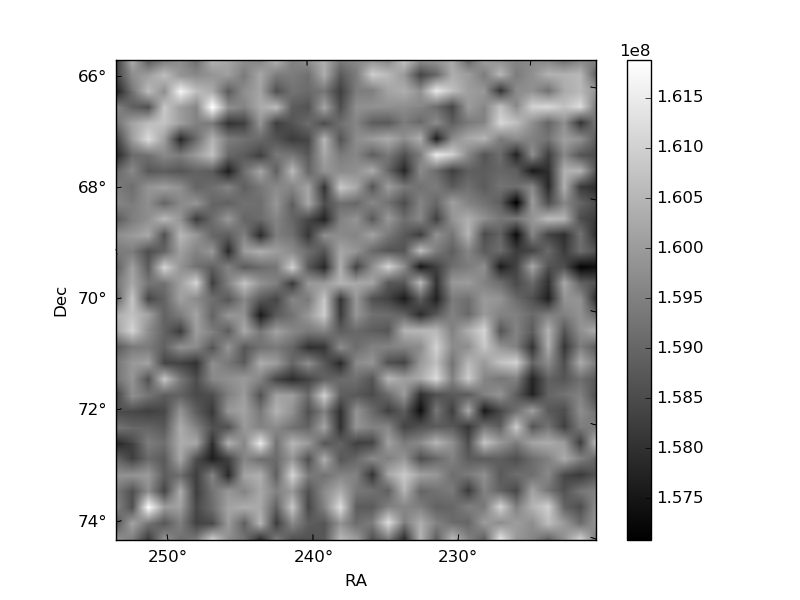
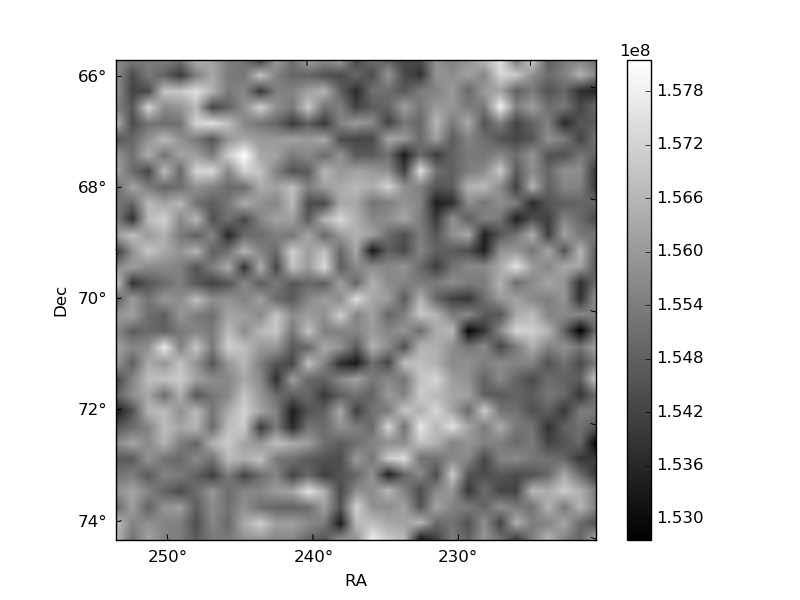
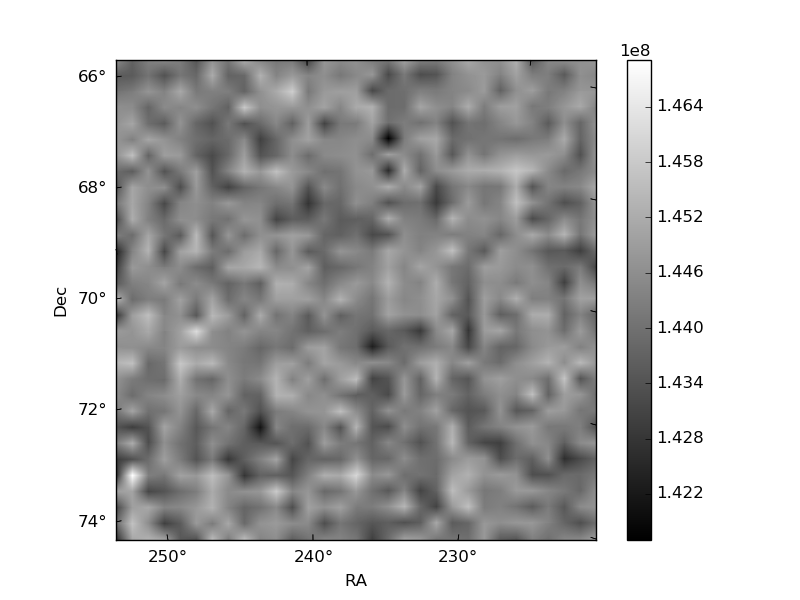
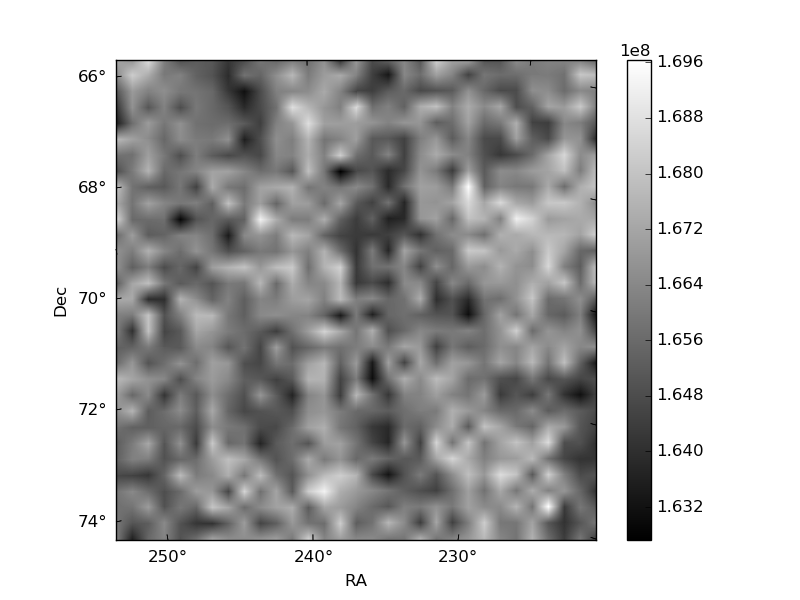
Histogram calculated using DETX and DETY for each event in the final _common_clean file
| Quadrant A | 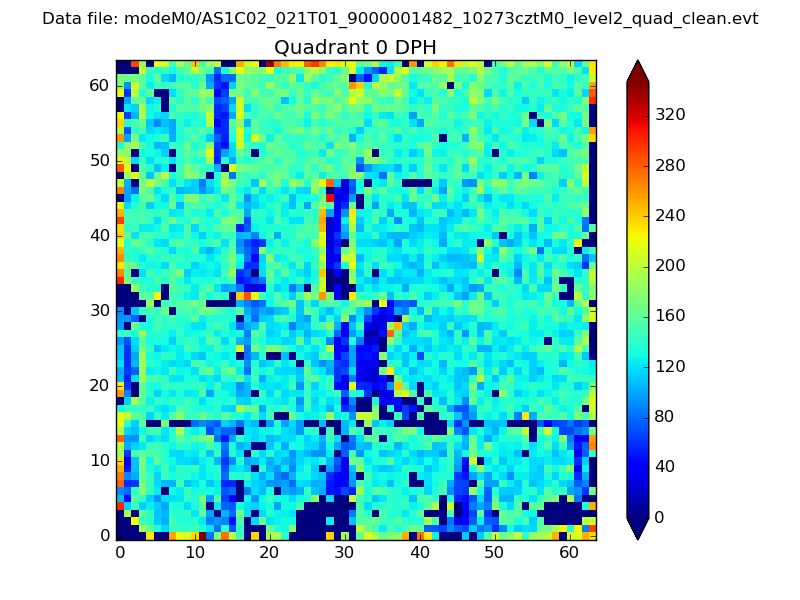 |
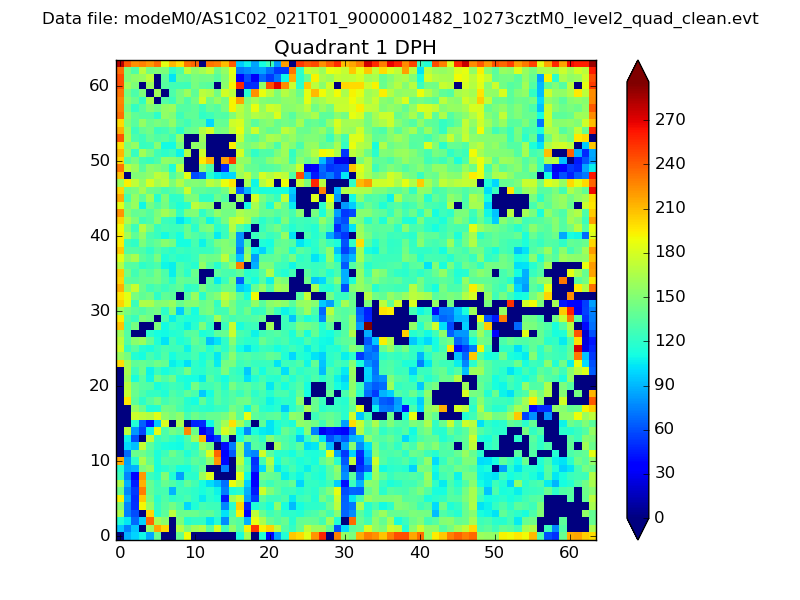 |
Quadrant B |
|---|---|---|---|
| Quadrant D | 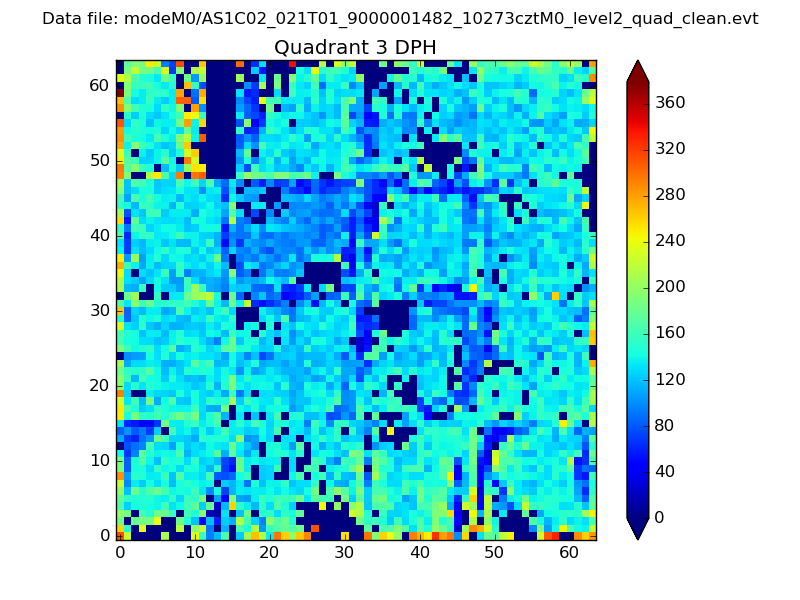 |
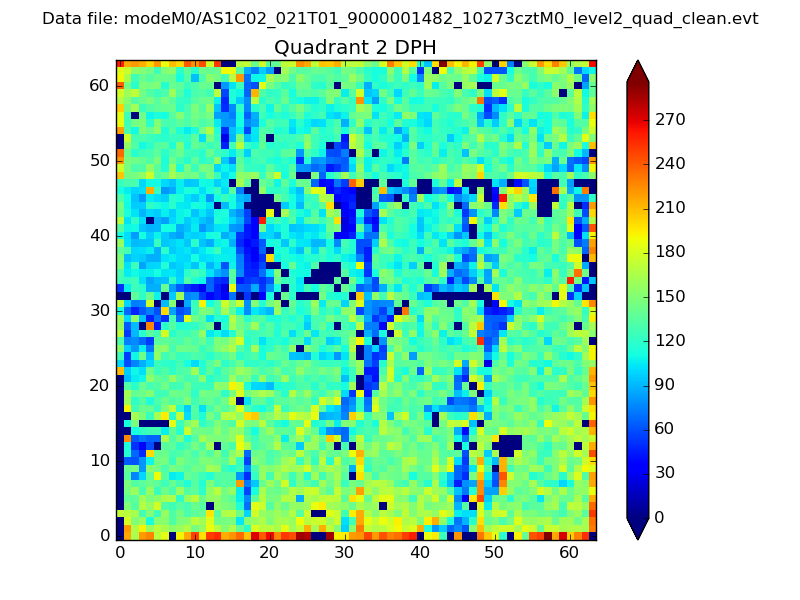 |
Quadrant C |
| Plot type | Count rate plots | Images |
|---|---|---|
| Comparison with Poisson distribution Blue bars denote a histogram of data divided into 1 sec bins. Red curve is a Poisson curve with rate = median count rate of data. |
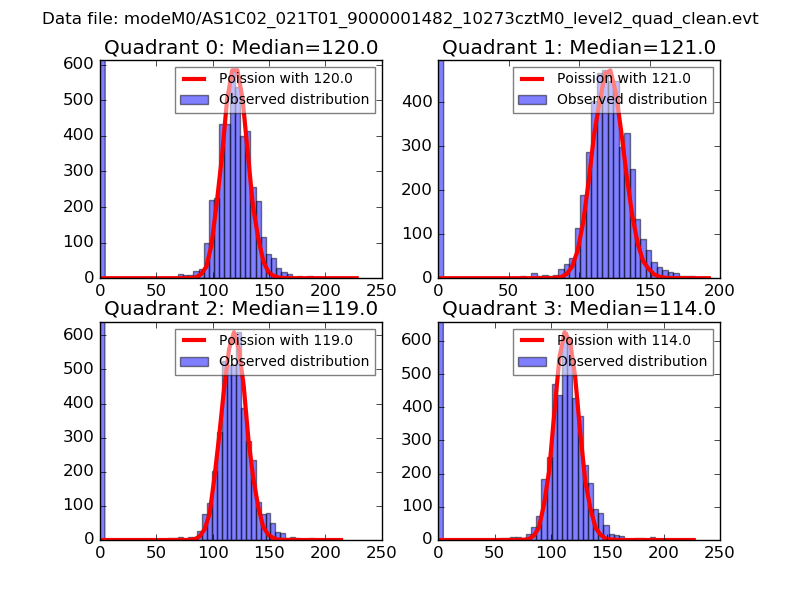 |
 |
| Quadrant-wise count rates Data is divided into 100 sec bins |
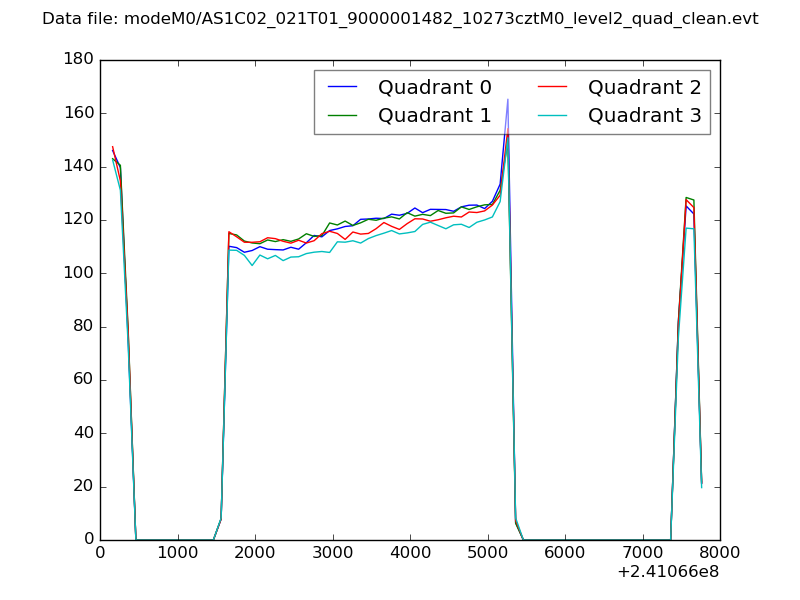 |
|
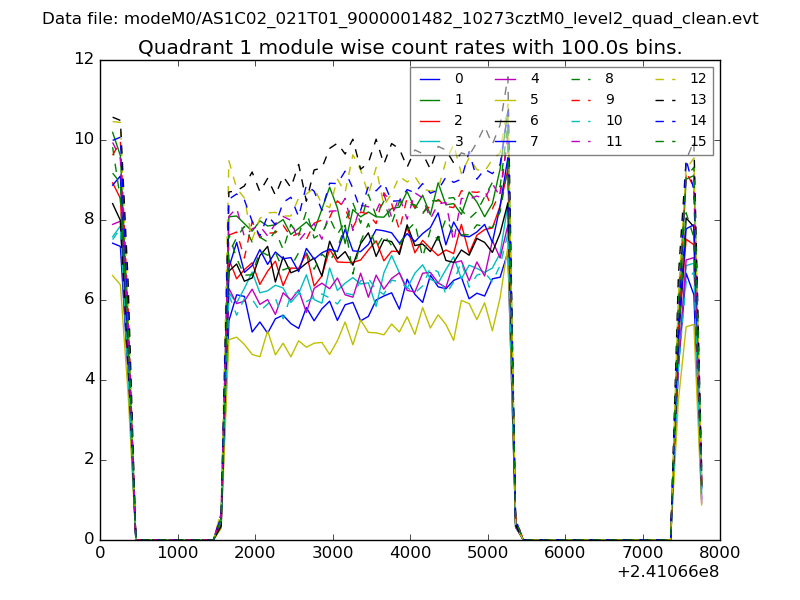
| Module-wise count rates for Quadrant A Data is divided into 100 sec bins |
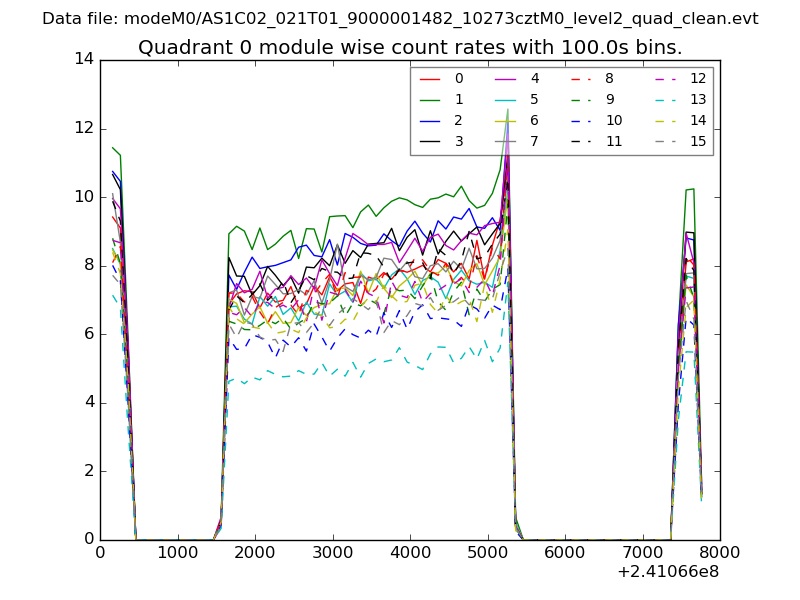 |
 |
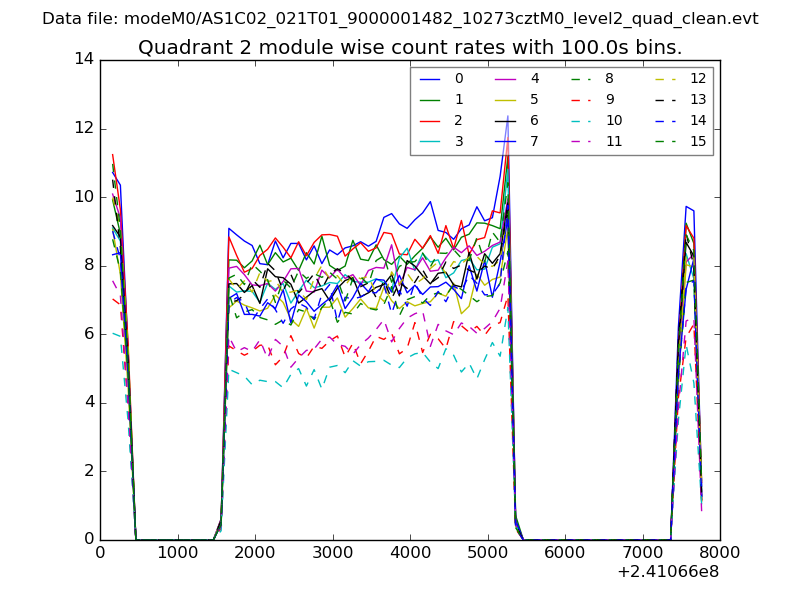
| Module-wise count rates for Quadrant B Data is divided into 100 sec bins |
 |
 |
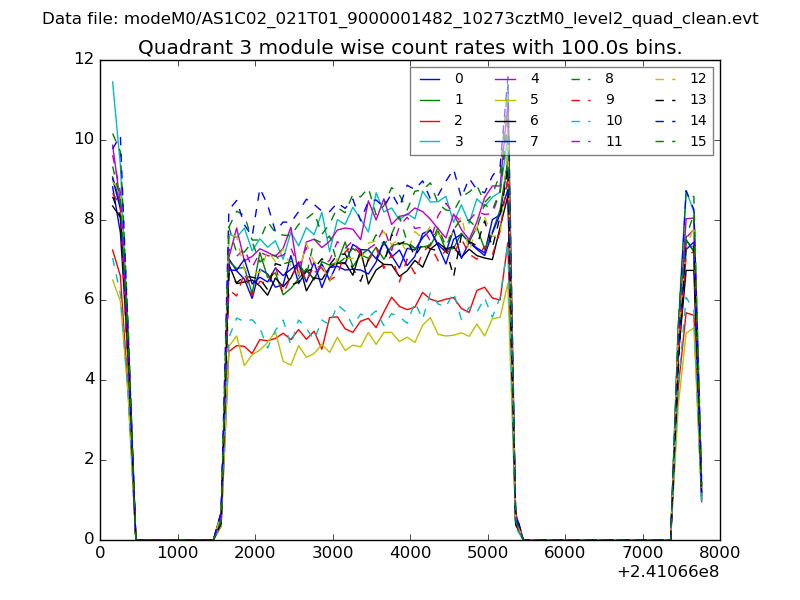
| Module-wise count rates for Quadrant C Data is divided into 100 sec bins |
 |
 |
| Module-wise count rates for Quadrant D Data is divided into 100 sec bins |
 |
 |
| Parameter | Plot |
|---|---|
| CZT HV Monitor | 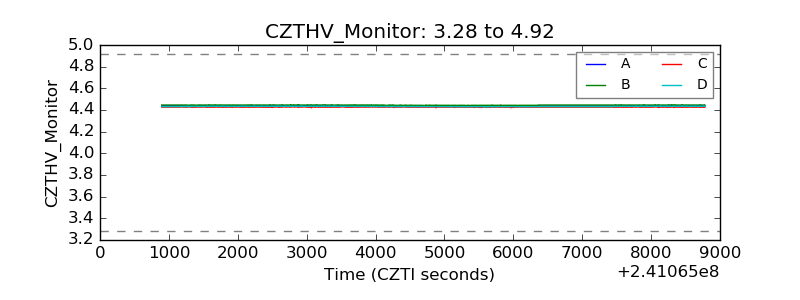 |
| D_VDD | 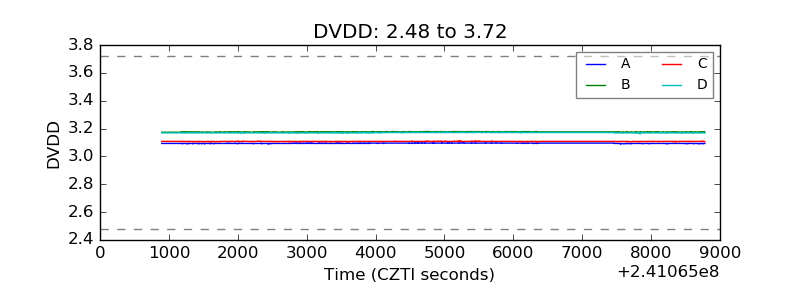 |
| Temperature 1 | 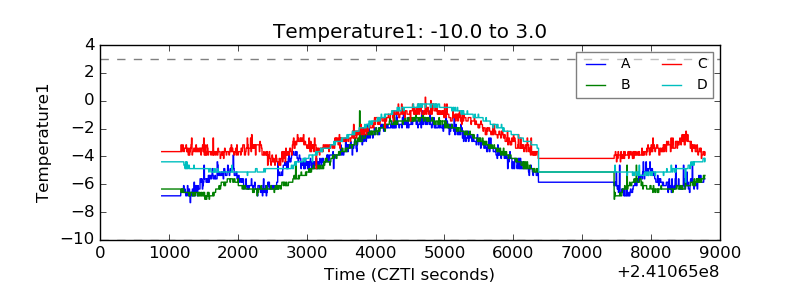 |
| Veto HV Monitor | 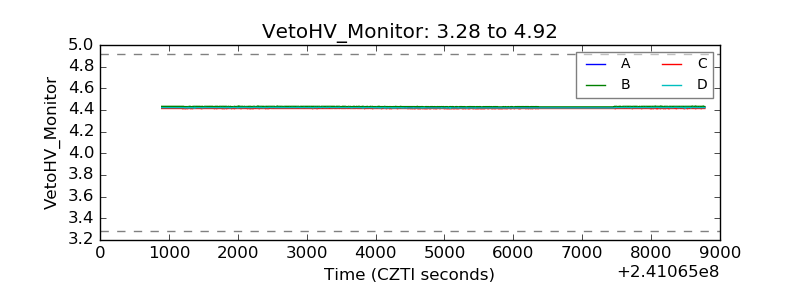 |
| Veto LLD | 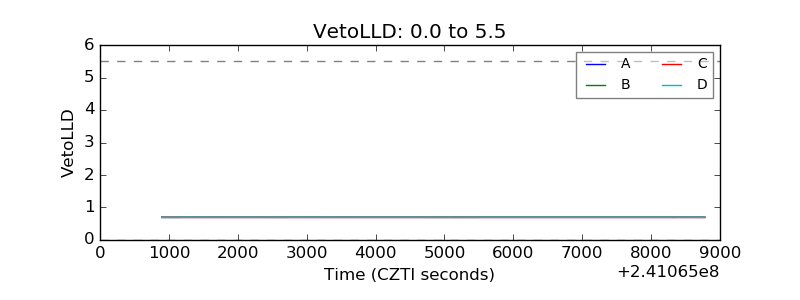 |
| Alpha Counter | 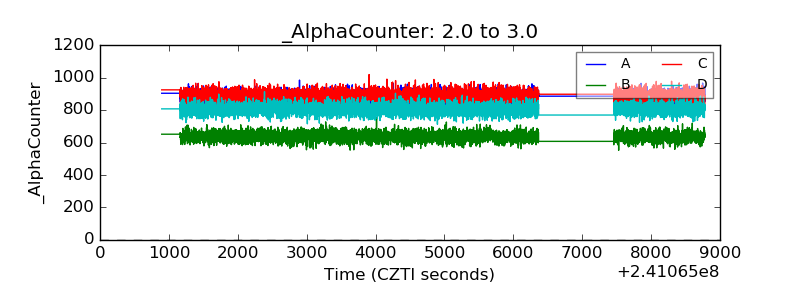 |
| _CPM_Rate | 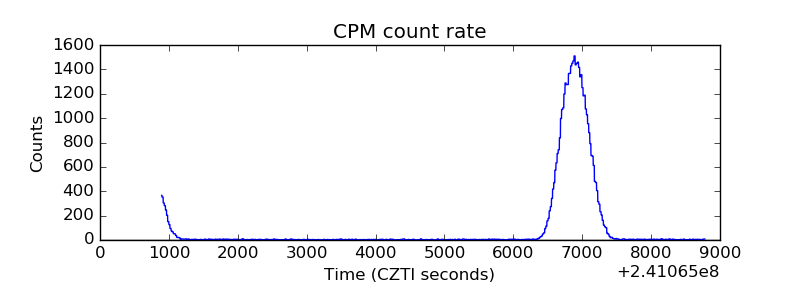 |
| CZT Counter | 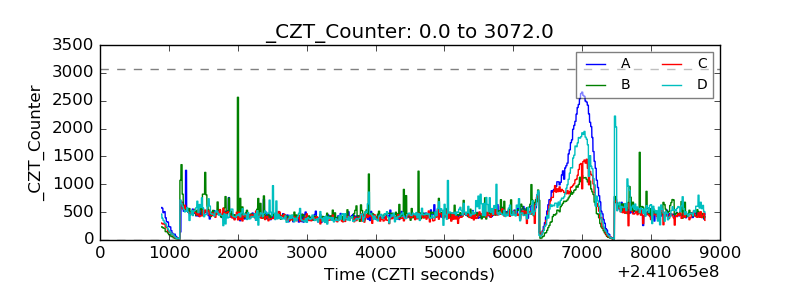 |
| +2.5 Volts monitor |  |
| +5 Volts monitor | 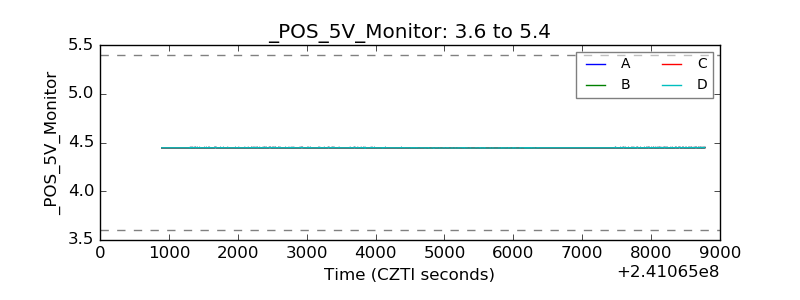 |
| _ROLL_ROT | 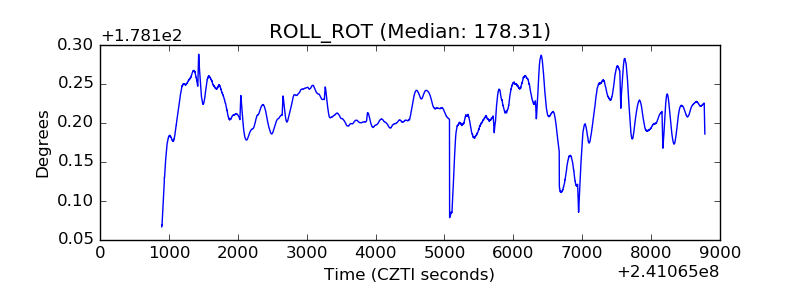 |
| _Roll_DEC | 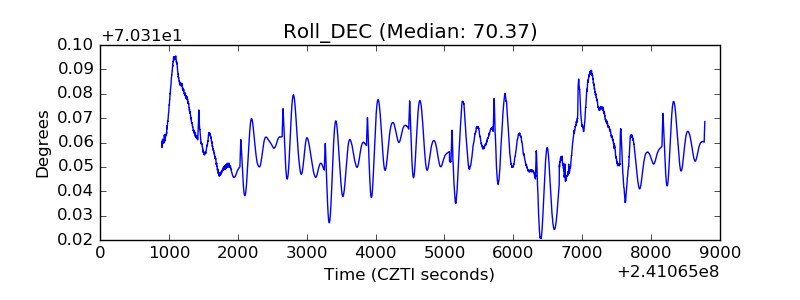 |
| _Roll_RA | 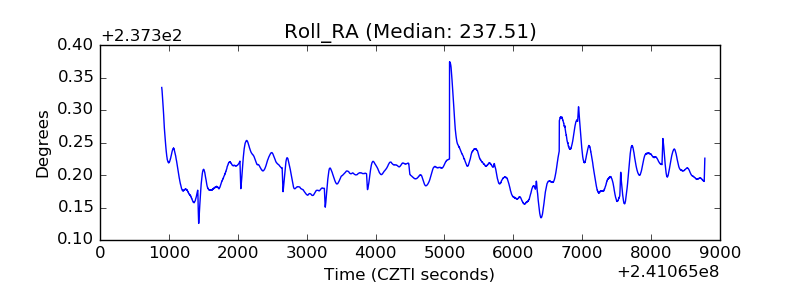 |
| Veto Counter | 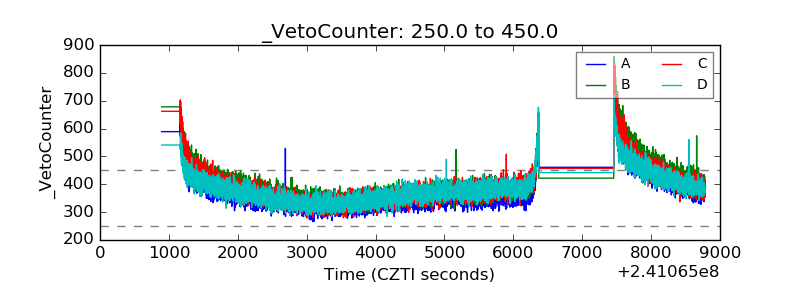 |