| Param | Original file | Final file |
|---|---|---|
| Filename | modeM0/AS1C02_021T01_9000001482_10274cztM0_level2.evt | modeM0/AS1C02_021T01_9000001482_10274cztM0_level2_quad_clean.evt |
| Size (bytes) | 478,411,200 | 90,881,280 |
| Size | 456.2 MB | 86.7 MB |
| Events in quadrant A | 3,312,449 | 580,838 |
| Events in quadrant B | 3,646,110 | 595,977 |
| Events in quadrant C | 3,051,292 | 580,709 |
| Events in quadrant D | 4,045,796 | 549,799 |
| Mode M9 | |||
|---|---|---|---|
| Quadrant | BADHDUFLAG | Total packets | Discarded packets |
| A | 0 | 15 | 0 |
| B | 0 | 15 | 0 |
| C | 0 | 15 | 0 |
| D | 0 | 16 | 0 |
| Mode SS | |||
|---|---|---|---|
| Quadrant | BADHDUFLAG | Total packets | Discarded packets |
| A | 0 | 130 | 0 |
| B | 0 | 130 | 0 |
| C | 0 | 130 | 0 |
| D | 0 | 130 | 0 |
| Mode M0 | |||
|---|---|---|---|
| Quadrant | BADHDUFLAG | Total packets | Discarded packets |
| A | 0 | 13961 | 3 |
| B | 0 | 14943 | 2 |
| C | 0 | 13522 | 2 |
| D | 0 | 15988 | 2 |
| Quadrant | Total seconds | Saturated seconds | Saturation percentage |
|---|---|---|---|
| A | 6374 | 140 | 2.196423% |
| B | 6374 | 164 | 2.572953% |
| C | 6374 | 84 | 1.317854% |
| D | 6374 | 198 | 3.106370% |
Noise dominated data is calculated using 1-second bins in cleaned event files. If a bin has >2000 counts, and if more than 50% of those come from <1% of pixels, then it is considered to be noise-dominated and hence unusable.
| Quadrant | # 1 sec bins | Bins with >0 counts | Bins with >2000 counts | High rate bins dominated by noise | Noise dominated (total time) | Noise dominated (detector-on time) | Marked lightcurve |
|---|---|---|---|---|---|---|---|
| A | 7554 | 6374 | 66 | 66 | 0.87% | 1.04% | 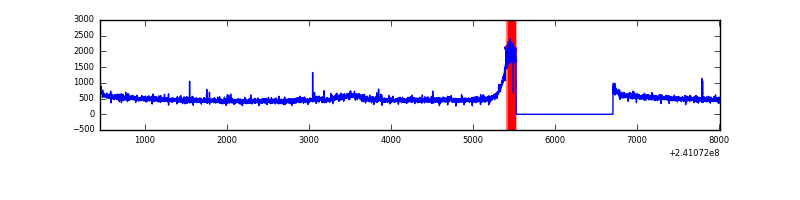 |
| B | 7554 | 6374 | 33 | 33 | 0.44% | 0.52% | 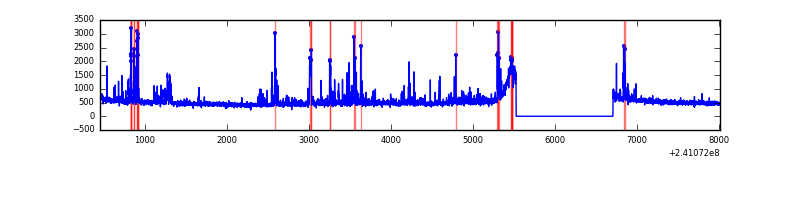 |
| C | 7554 | 6374 | 6 | 6 | 0.08% | 0.09% | 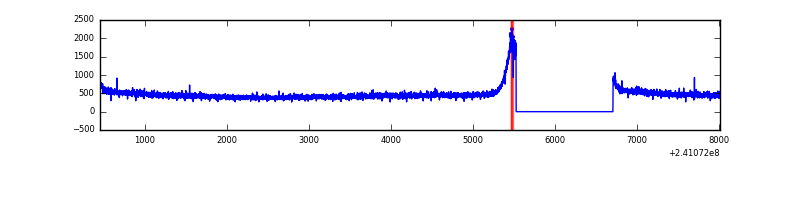 |
| D | 7554 | 6374 | 141 | 141 | 1.87% | 2.21% | 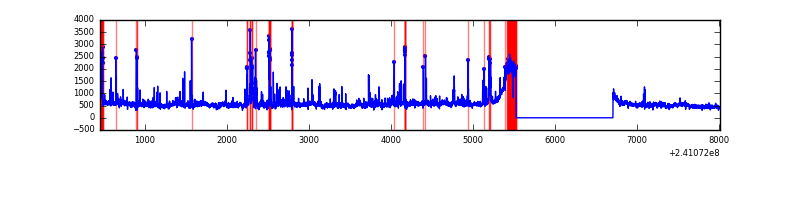 |
Top three noisy pixels from each quadrant. If the there are fewer than three noisy pixels in the level2.evt file, extra rows are filled as -1
| Pixel properties | Quadrant properties | ||||||
|---|---|---|---|---|---|---|---|
| Quadrant | DetID | PixID | Counts | Sigma | Mean | Median | Sigma |
| A | 8 | 15 | 97252 | 573.09 | 832 | 818 | 168.3 |
| A | 0 | 226 | 7745 | 41.17 | 832 | 818 | 168.3 |
| A | 3 | 1 | 7621 | 40.43 | 832 | 818 | 168.3 |
| B | 4 | 239 | 214975 | 1413.76 | 803 | 785 | 151.5 |
| B | 0 | 85 | 117831 | 772.56 | 803 | 785 | 151.5 |
| B | 11 | 51 | 94641 | 619.5 | 803 | 785 | 151.5 |
| C | 14 | 67 | 8895 | 44.56 | 780 | 786 | 182.0 |
| C | 13 | 61 | 5725 | 27.14 | 780 | 786 | 182.0 |
| C | 3 | 202 | 1963 | 6.47 | 780 | 786 | 182.0 |
| D | 8 | 195 | 422736 | 2192.8 | 797 | 775 | 192.4 |
| D | 2 | 14 | 185395 | 959.41 | 797 | 775 | 192.4 |
| D | 2 | 152 | 133951 | 692.07 | 797 | 775 | 192.4 |
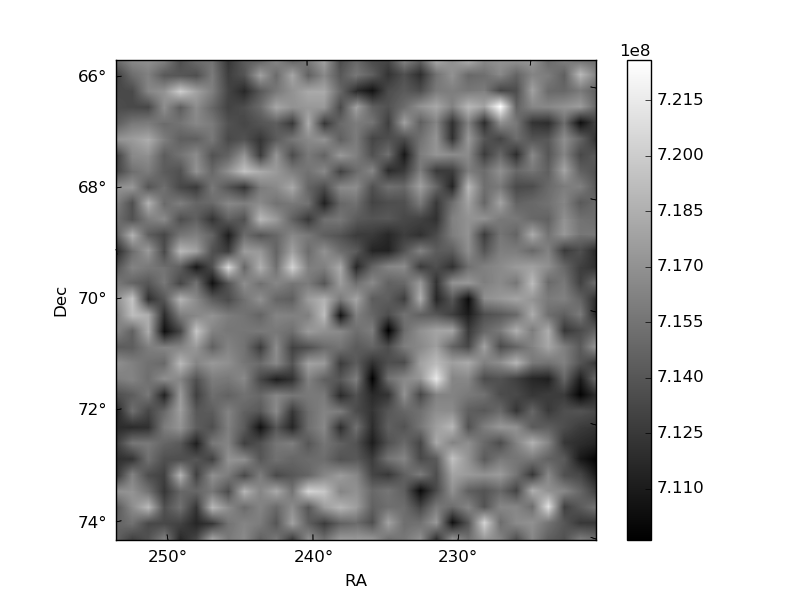
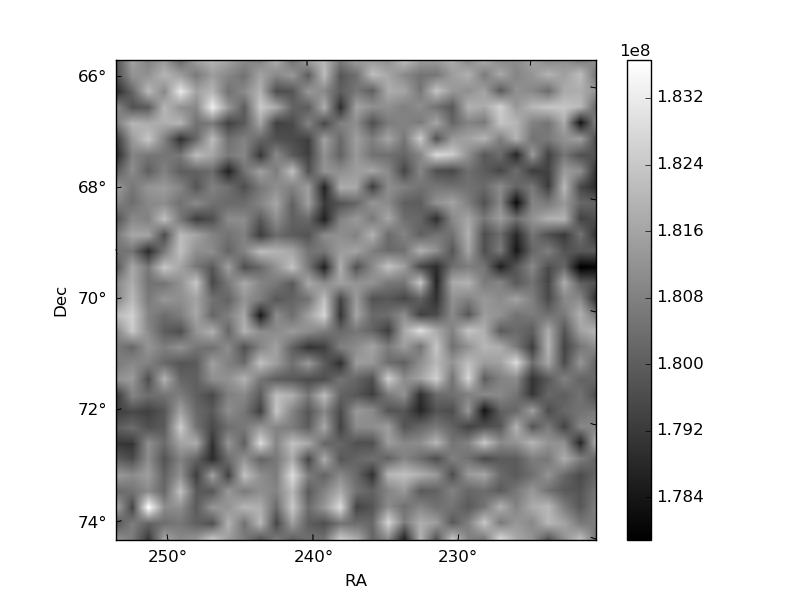
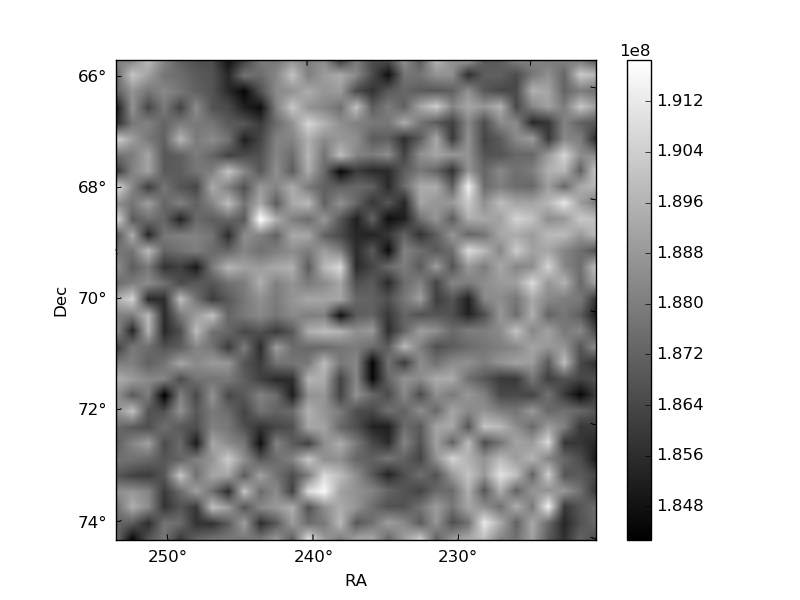
Histogram calculated using DETX and DETY for each event in the final _common_clean file
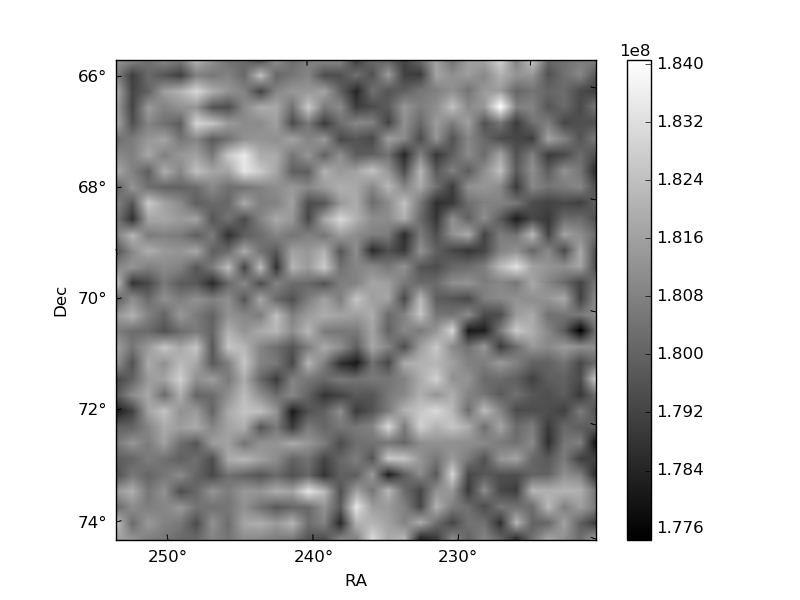
| Quadrant A | 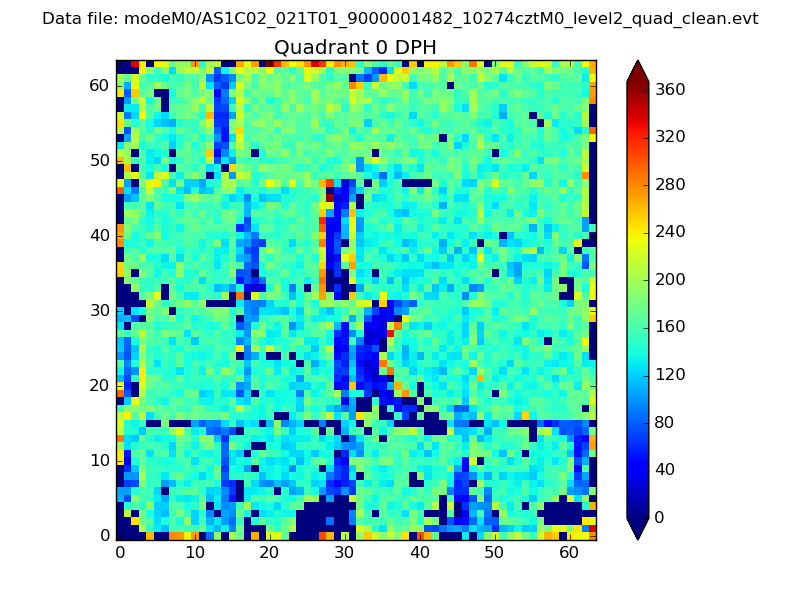 |
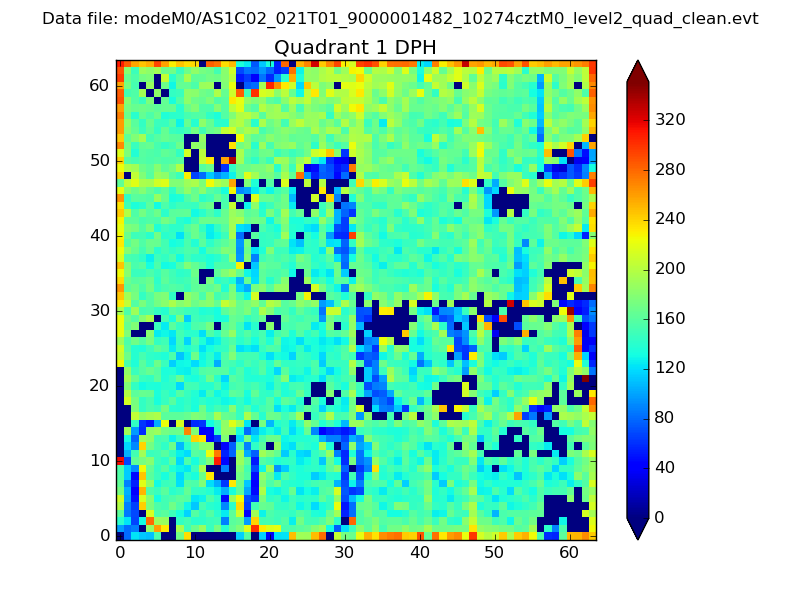 |
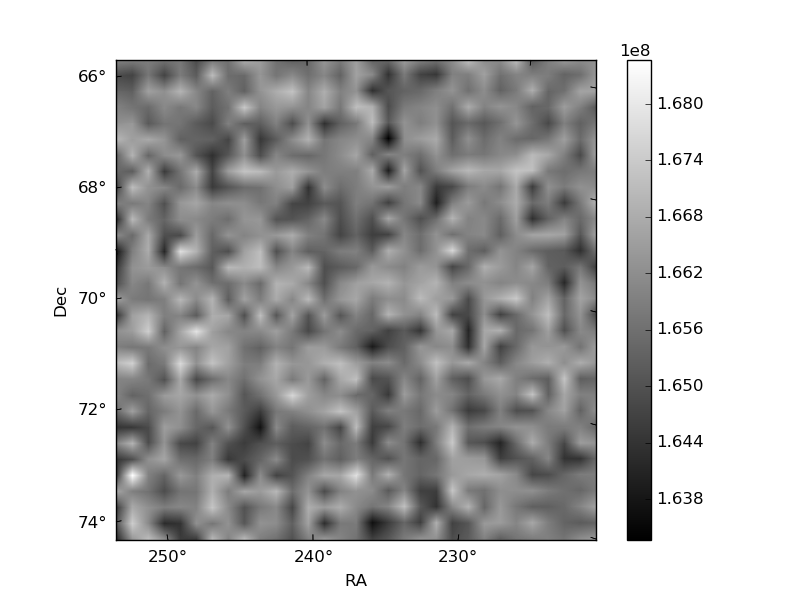
Quadrant B |
|---|---|---|---|
| Quadrant D | 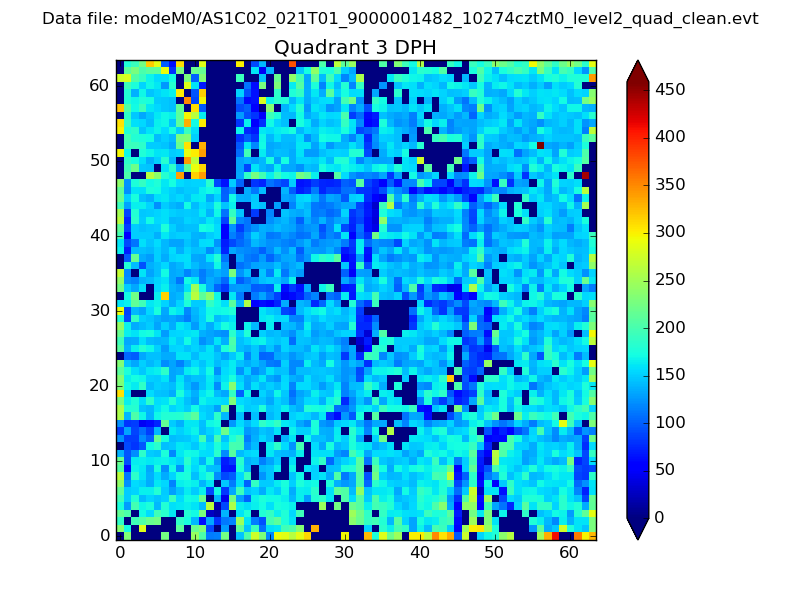 |
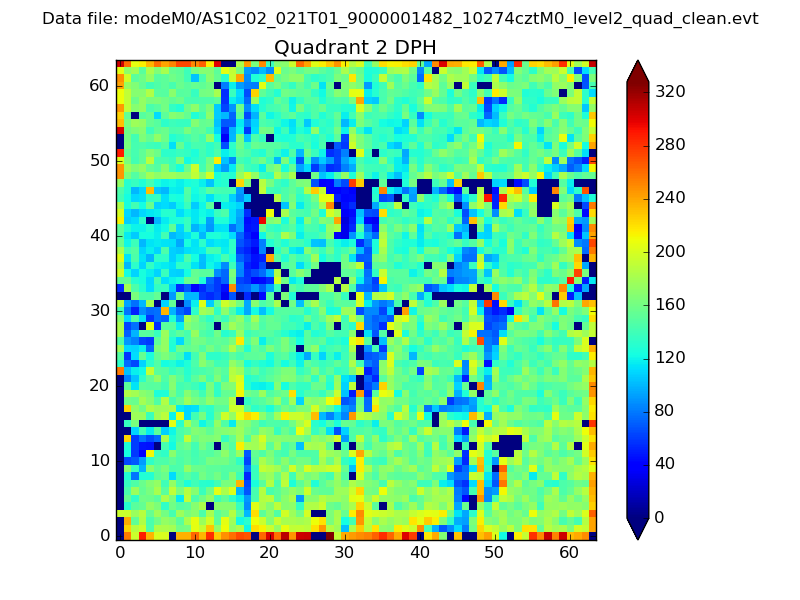 |
Quadrant C |
| Plot type | Count rate plots | Images |
|---|---|---|
| Comparison with Poisson distribution Blue bars denote a histogram of data divided into 1 sec bins. Red curve is a Poisson curve with rate = median count rate of data. |
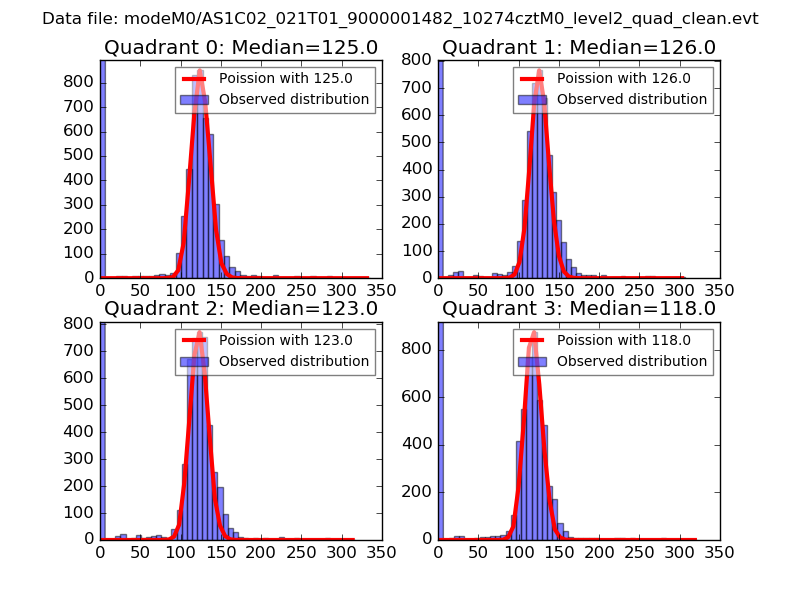 |
 |
| Quadrant-wise count rates Data is divided into 100 sec bins |
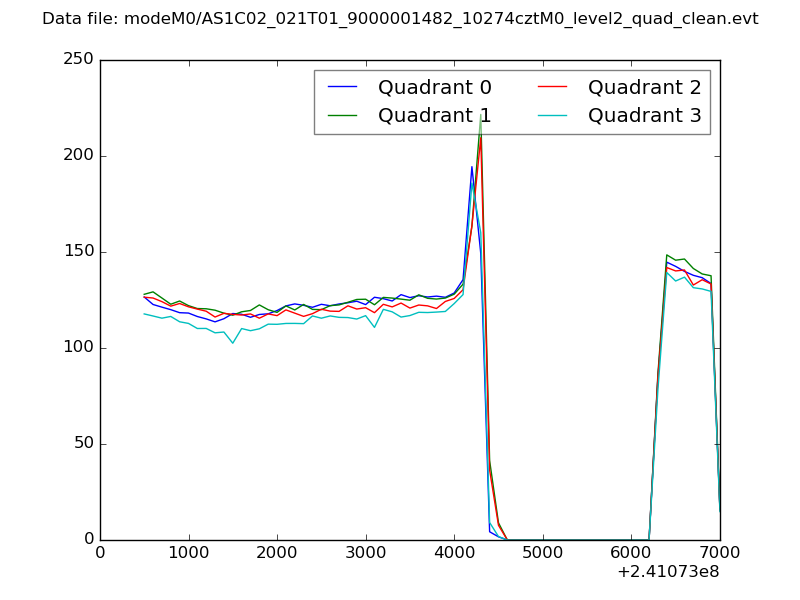 |
|
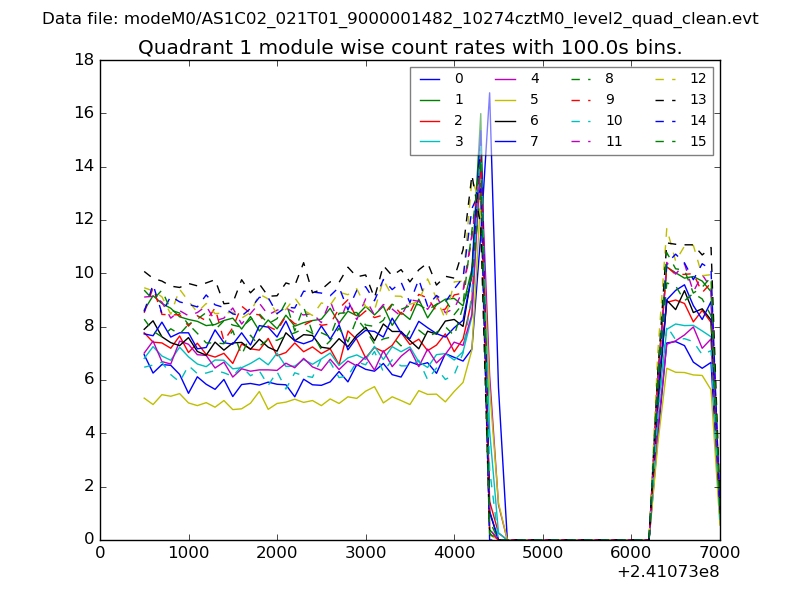
| Module-wise count rates for Quadrant A Data is divided into 100 sec bins |
 |
 |
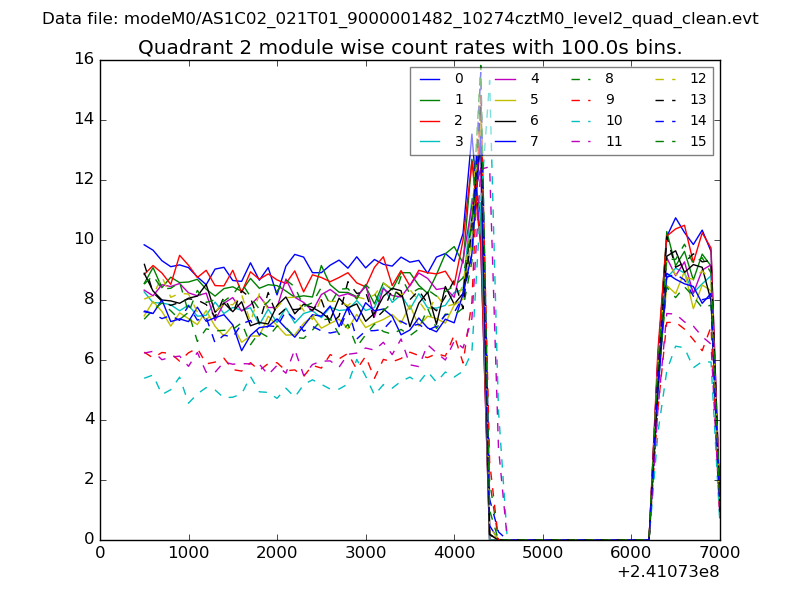
| Module-wise count rates for Quadrant B Data is divided into 100 sec bins |
 |
 |
| Module-wise count rates for Quadrant C Data is divided into 100 sec bins |
 |
 |
| Module-wise count rates for Quadrant D Data is divided into 100 sec bins |
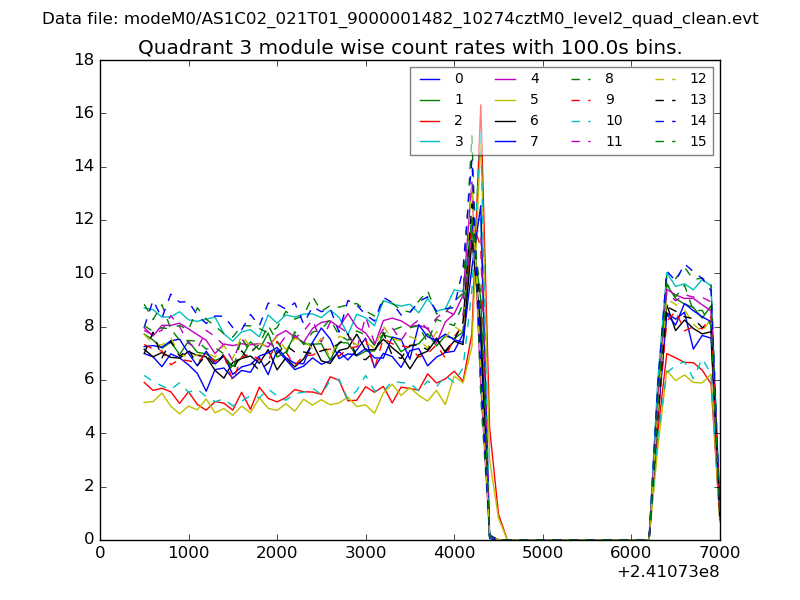 |
 |
| Parameter | Plot |
|---|---|
| CZT HV Monitor | 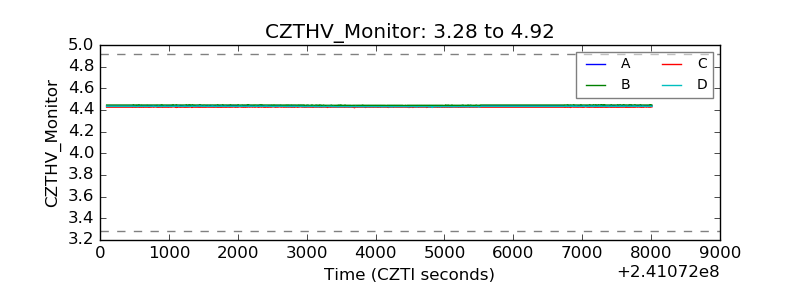 |
| D_VDD | 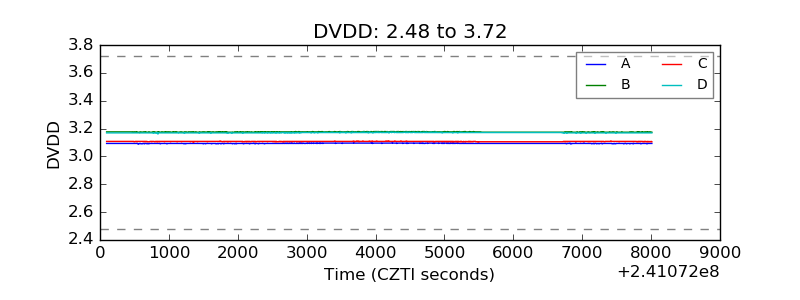 |
| Temperature 1 | 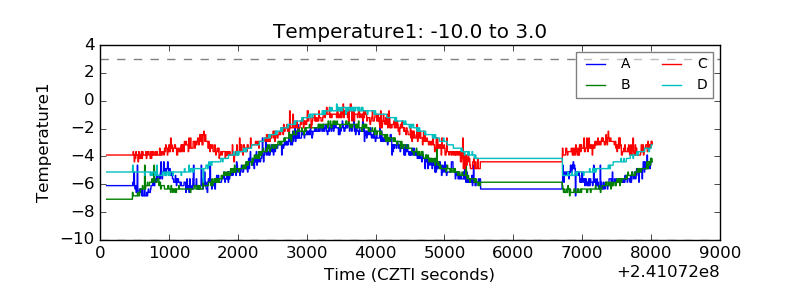 |
| Veto HV Monitor | 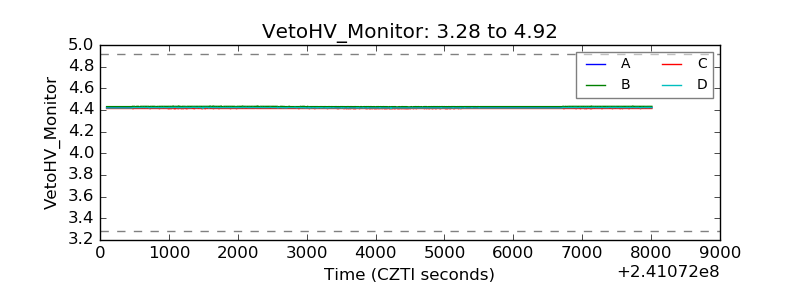 |
| Veto LLD |  |
| Alpha Counter | 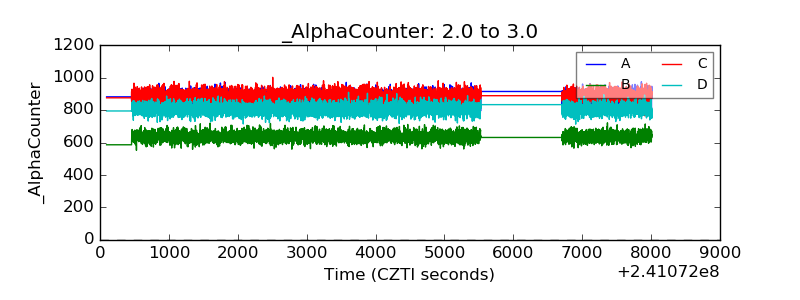 |
| _CPM_Rate | 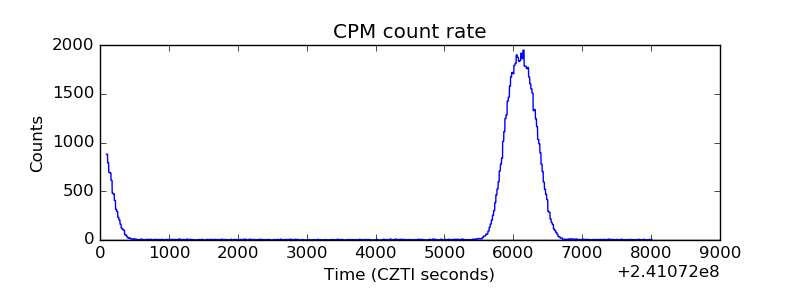 |
| CZT Counter | 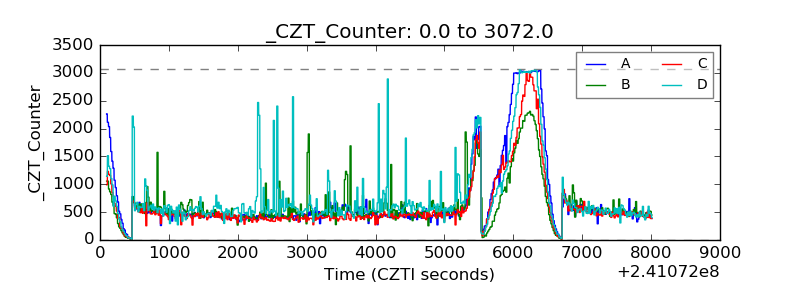 |
| +2.5 Volts monitor |  |
| +5 Volts monitor |  |
| _ROLL_ROT |  |
| _Roll_DEC | 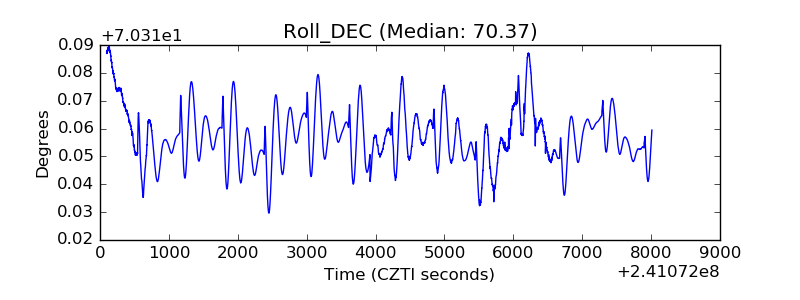 |
| _Roll_RA | 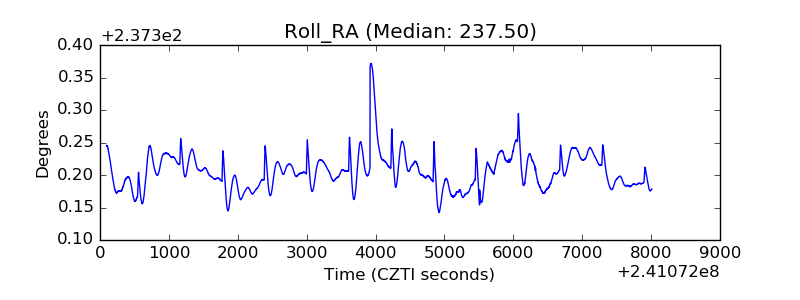 |
| Veto Counter | 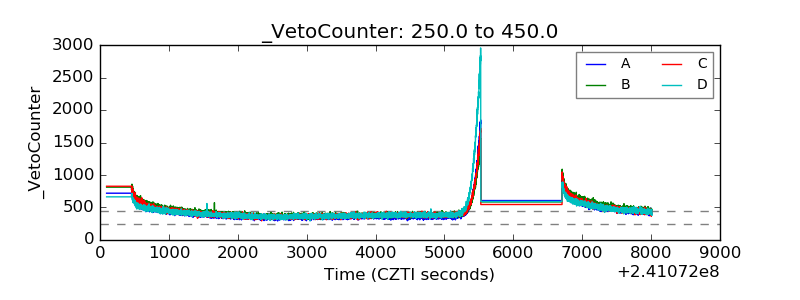 |