| Param | Original file | Final file |
|---|---|---|
| Filename | modeM0/AS1C02_021T01_9000001482_10276cztM0_level2.evt | modeM0/AS1C02_021T01_9000001482_10276cztM0_level2_quad_clean.evt |
| Size (bytes) | 447,226,560 | 124,548,480 |
| Size | 426.5 MB | 118.8 MB |
| Events in quadrant A | 3,073,386 | 862,448 |
| Events in quadrant B | 3,421,261 | 855,295 |
| Events in quadrant C | 2,864,544 | 826,732 |
| Events in quadrant D | 3,775,734 | 807,140 |
| Mode M9 | |||
|---|---|---|---|
| Quadrant | BADHDUFLAG | Total packets | Discarded packets |
| A | 0 | 13 | 0 |
| B | 0 | 13 | 0 |
| C | 0 | 13 | 0 |
| D | 0 | 13 | 0 |
| Mode SS | |||
|---|---|---|---|
| Quadrant | BADHDUFLAG | Total packets | Discarded packets |
| A | 0 | 122 | 0 |
| B | 0 | 122 | 0 |
| C | 0 | 122 | 0 |
| D | 0 | 122 | 0 |
| Mode M0 | |||
|---|---|---|---|
| Quadrant | BADHDUFLAG | Total packets | Discarded packets |
| A | 0 | 12856 | 11 |
| B | 0 | 13878 | 4 |
| C | 0 | 12484 | 9 |
| D | 0 | 15042 | 8 |
| Quadrant | Total seconds | Saturated seconds | Saturation percentage |
|---|---|---|---|
| A | 6027 | 128 | 2.123776% |
| B | 6030 | 163 | 2.703151% |
| C | 6027 | 87 | 1.443504% |
| D | 6028 | 175 | 2.903119% |
Noise dominated data is calculated using 1-second bins in cleaned event files. If a bin has >2000 counts, and if more than 50% of those come from <1% of pixels, then it is considered to be noise-dominated and hence unusable.
| Quadrant | # 1 sec bins | Bins with >0 counts | Bins with >2000 counts | High rate bins dominated by noise | Noise dominated (total time) | Noise dominated (detector-on time) | Marked lightcurve |
|---|---|---|---|---|---|---|---|
| A | 7336 | 6031 | 0 | 0 | 0.00% | 0.00% | 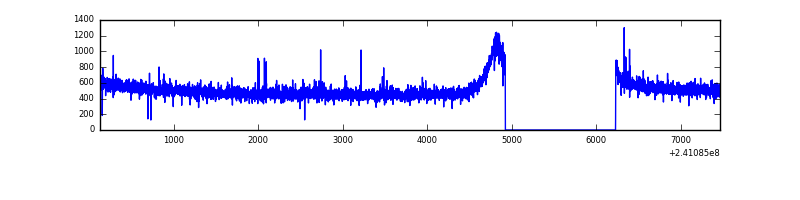 |
| B | 7336 | 6031 | 28 | 28 | 0.38% | 0.46% | 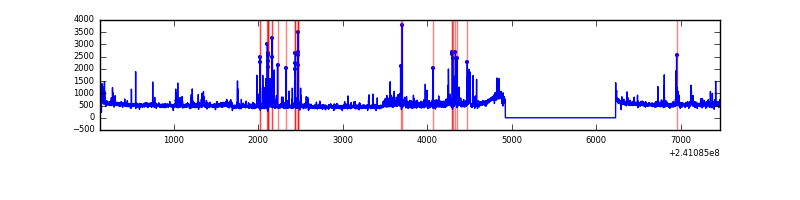 |
| C | 7336 | 6031 | 0 | 0 | 0.00% | 0.00% | 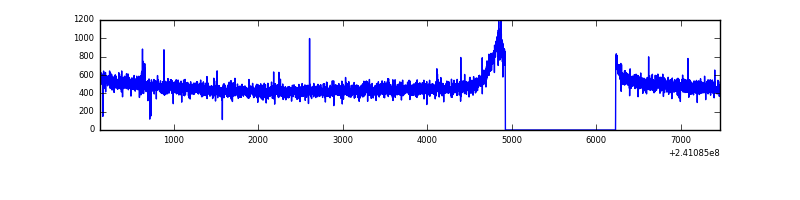 |
| D | 7336 | 6031 | 65 | 65 | 0.89% | 1.08% | 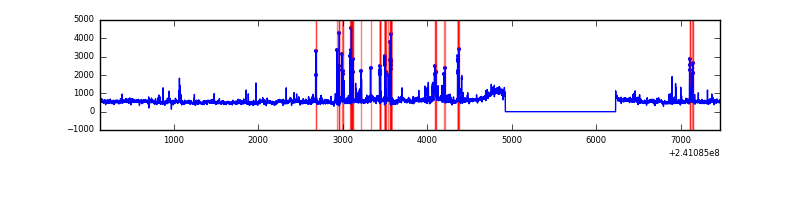 |
Top three noisy pixels from each quadrant. If the there are fewer than three noisy pixels in the level2.evt file, extra rows are filled as -1
| Pixel properties | Quadrant properties | ||||||
|---|---|---|---|---|---|---|---|
| Quadrant | DetID | PixID | Counts | Sigma | Mean | Median | Sigma |
| A | 8 | 5 | 24257 | 147.86 | 787 | 774 | 158.8 |
| A | 8 | 15 | 13894 | 82.61 | 787 | 774 | 158.8 |
| A | 0 | 226 | 7418 | 41.83 | 787 | 774 | 158.8 |
| B | 4 | 239 | 155249 | 1094.51 | 760 | 744 | 141.2 |
| B | 11 | 51 | 114483 | 805.72 | 760 | 744 | 141.2 |
| B | 0 | 85 | 60373 | 422.41 | 760 | 744 | 141.2 |
| C | 13 | 61 | 5519 | 28.42 | 733 | 737 | 168.2 |
| C | 14 | 234 | 4251 | 20.89 | 733 | 737 | 168.2 |
| C | 3 | 202 | 1895 | 6.88 | 733 | 737 | 168.2 |
| D | 8 | 195 | 365582 | 2026.12 | 752 | 734 | 180.1 |
| D | 12 | 233 | 245764 | 1360.73 | 752 | 734 | 180.1 |
| D | 2 | 152 | 124793 | 688.94 | 752 | 734 | 180.1 |
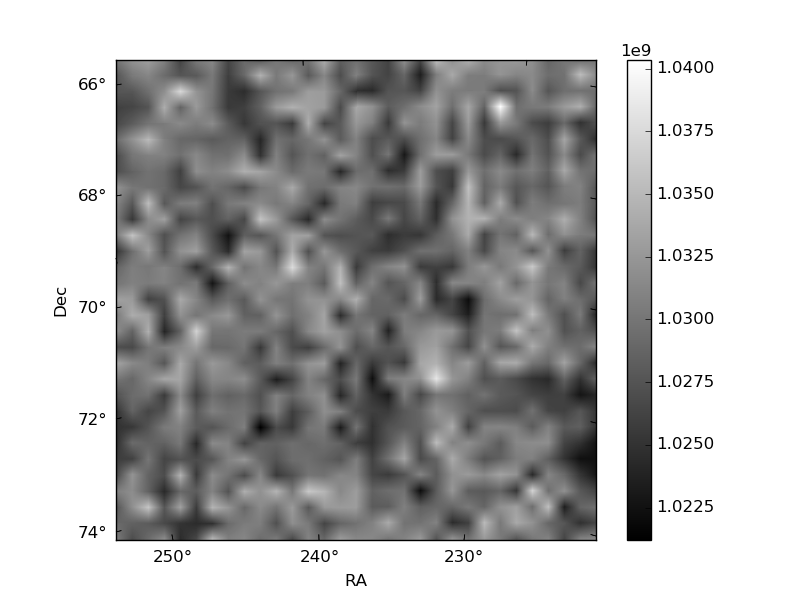
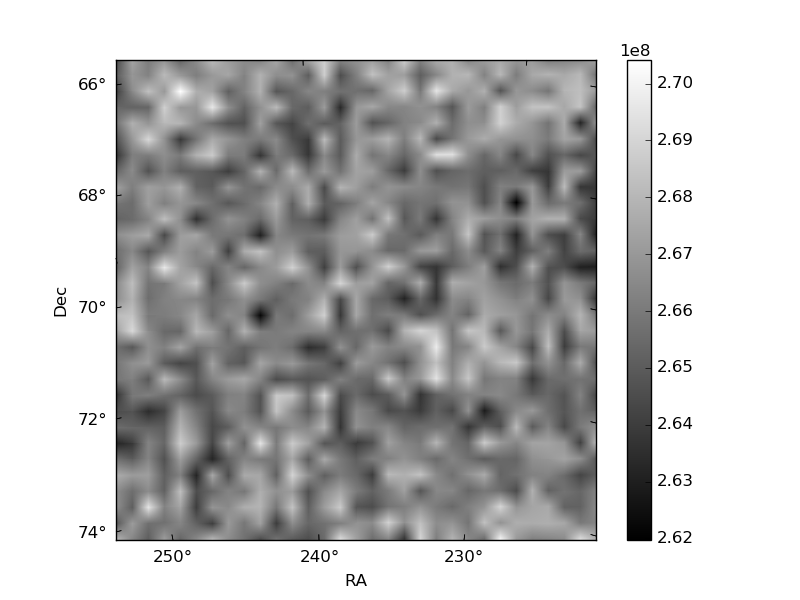
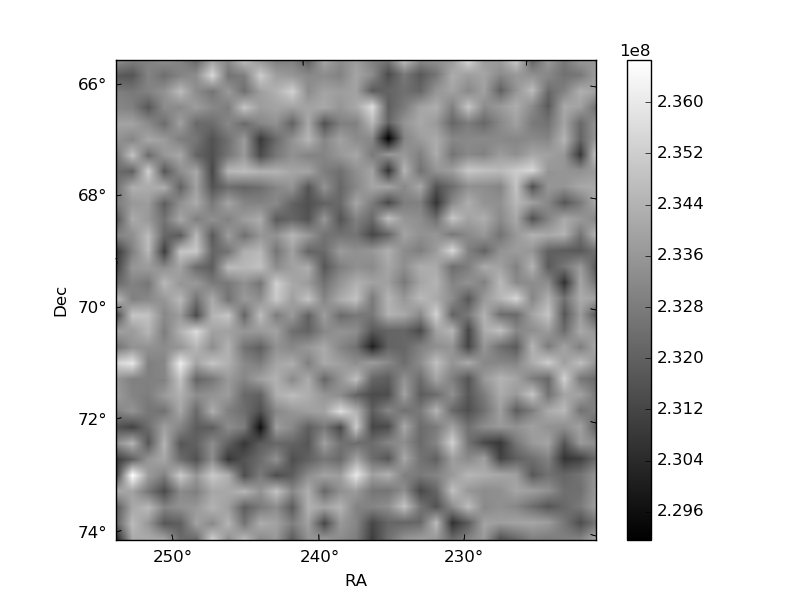
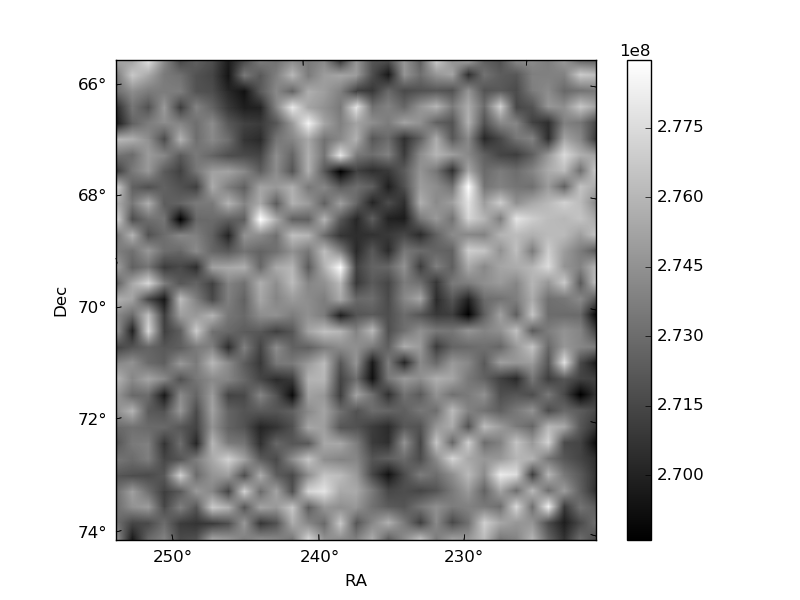
Histogram calculated using DETX and DETY for each event in the final _common_clean file
| Quadrant A | 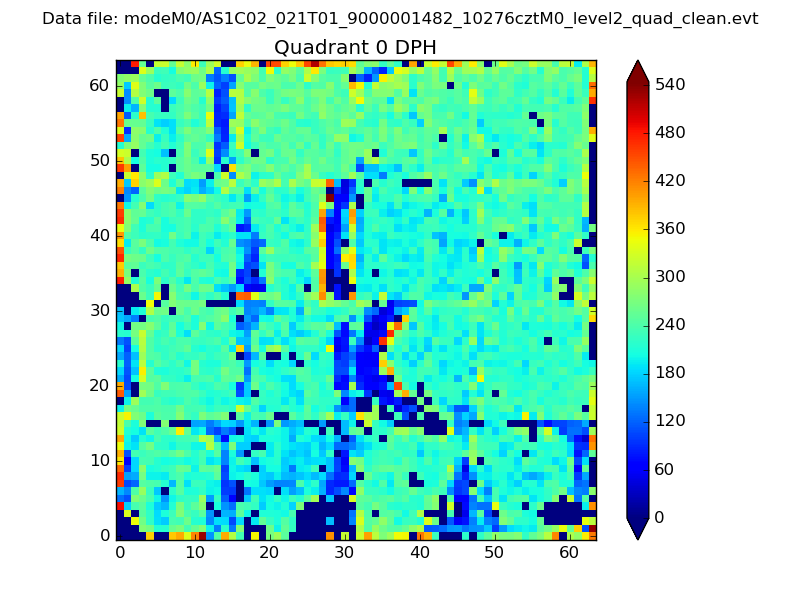 |
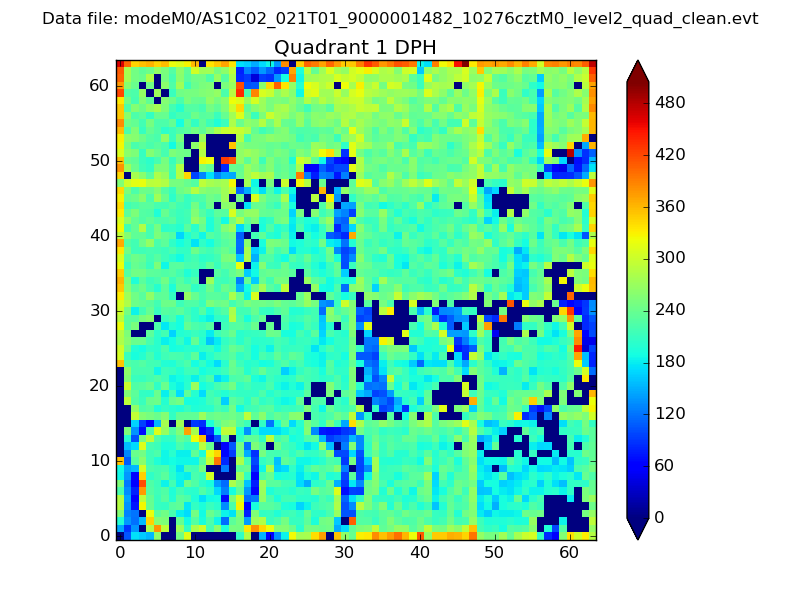 |
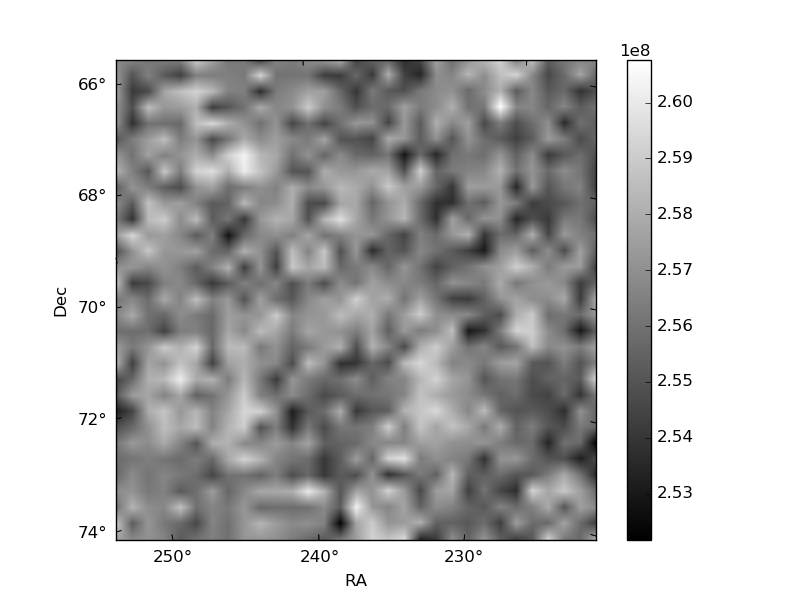
Quadrant B |
|---|---|---|---|
| Quadrant D | 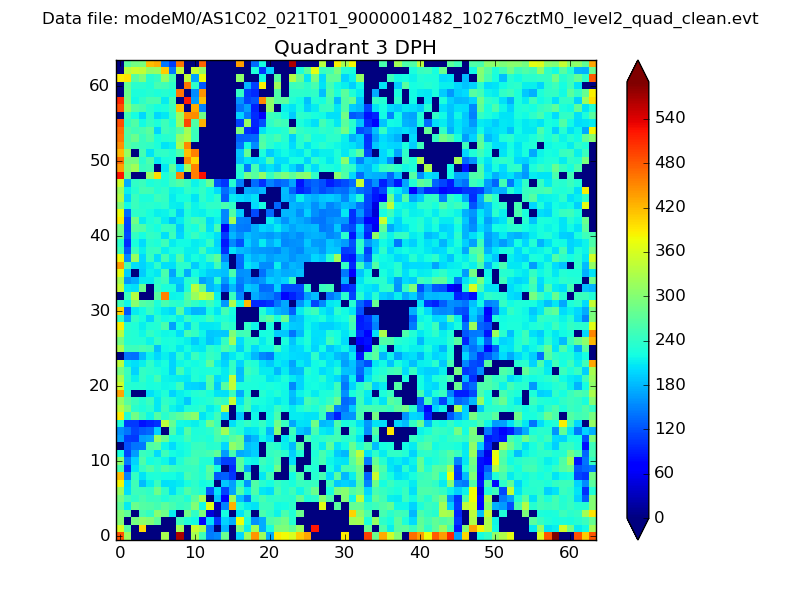 |
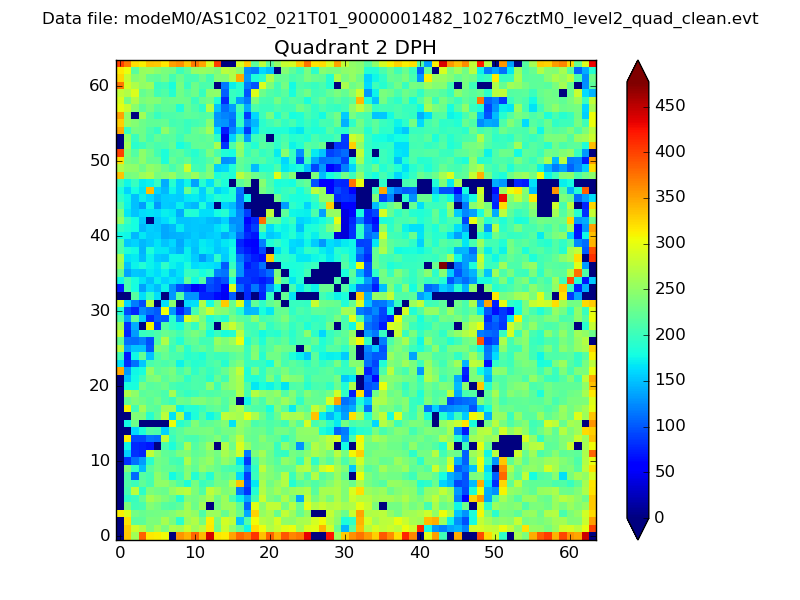 |
Quadrant C |
| Plot type | Count rate plots | Images |
|---|---|---|
| Comparison with Poisson distribution Blue bars denote a histogram of data divided into 1 sec bins. Red curve is a Poisson curve with rate = median count rate of data. |
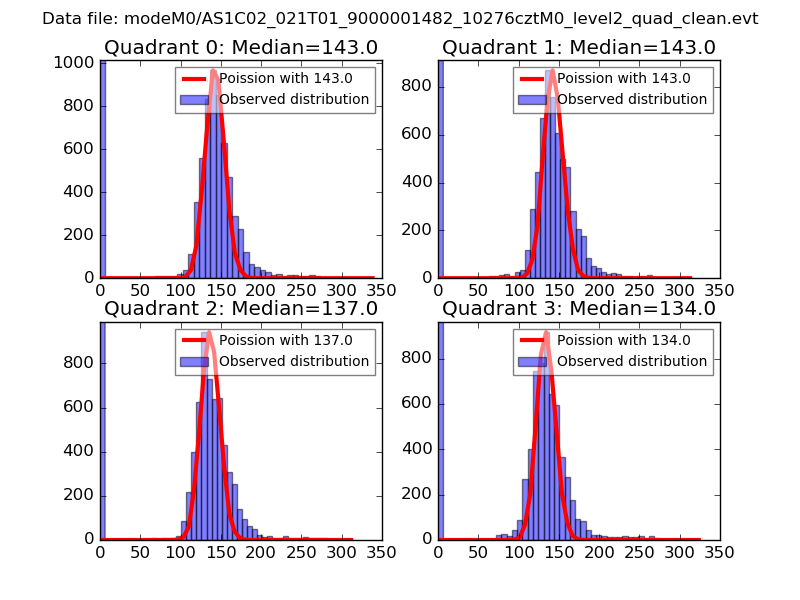 |
 |
| Quadrant-wise count rates Data is divided into 100 sec bins |
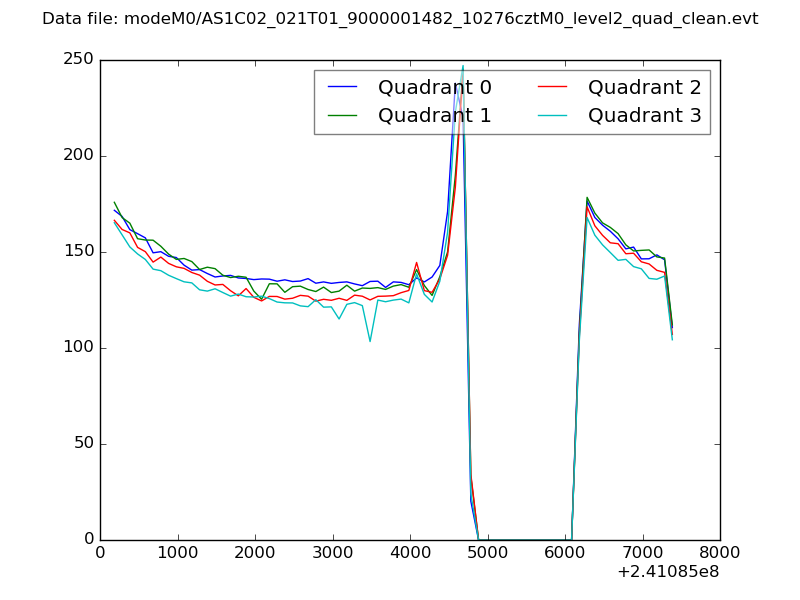 |
|
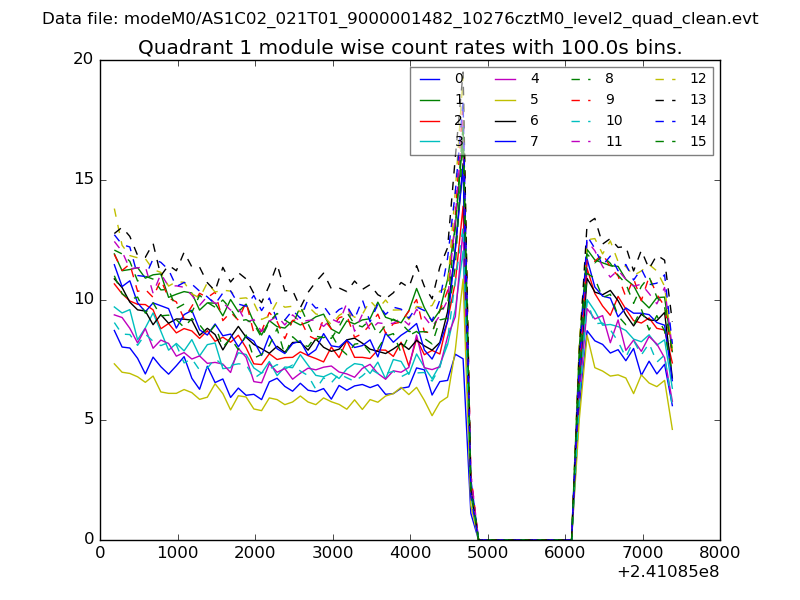
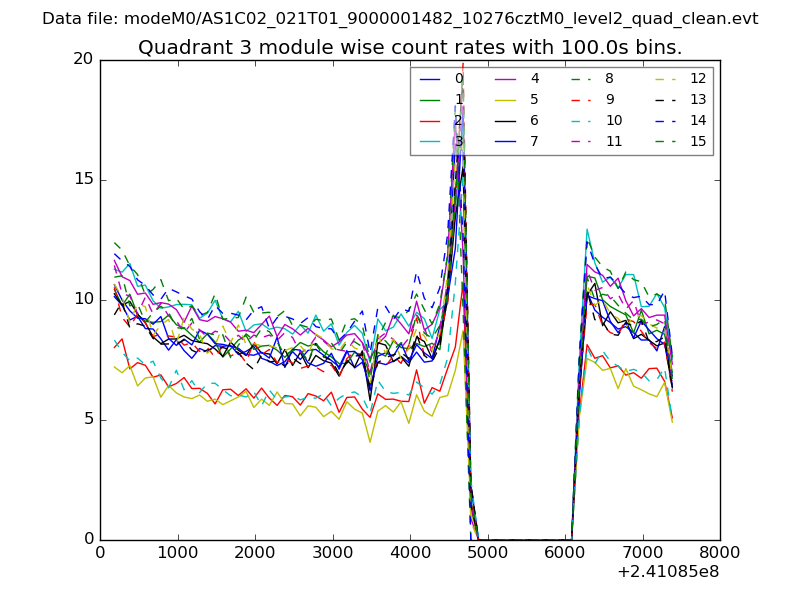
| Module-wise count rates for Quadrant A Data is divided into 100 sec bins |
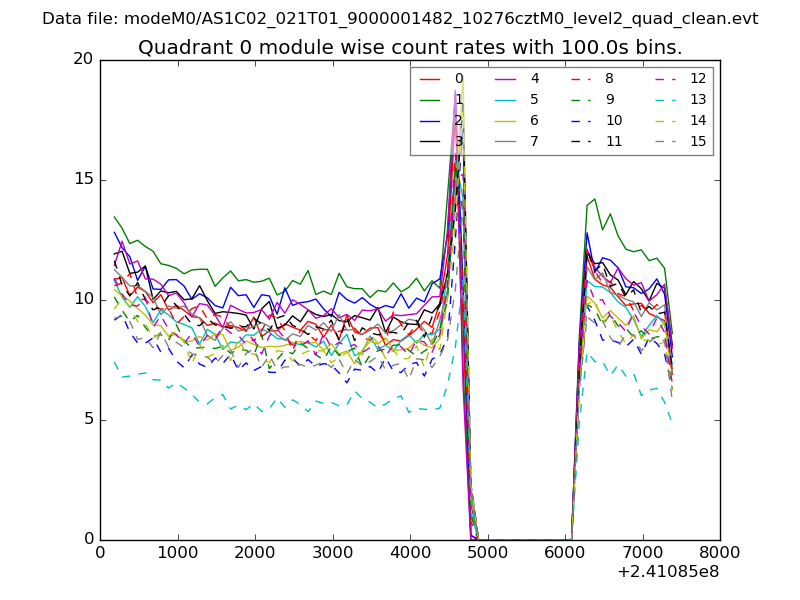 |
 |
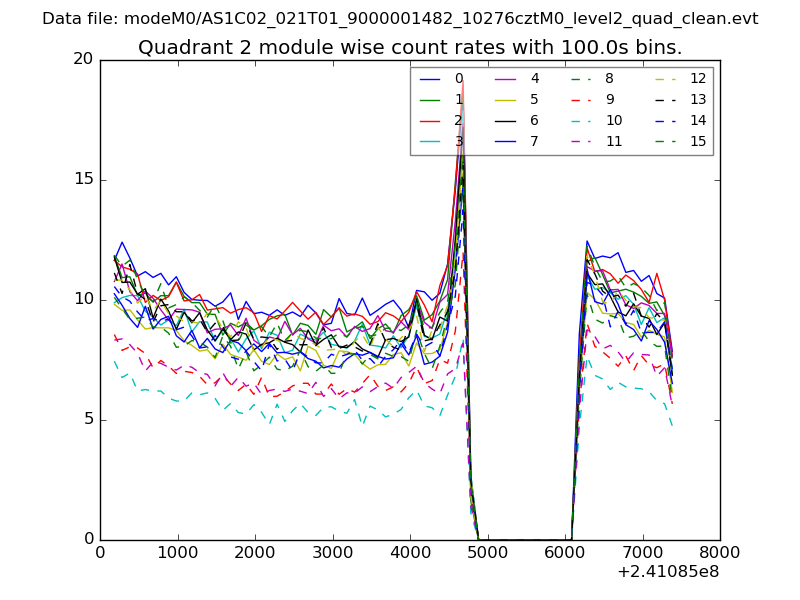
| Module-wise count rates for Quadrant B Data is divided into 100 sec bins |
 |
 |
| Module-wise count rates for Quadrant C Data is divided into 100 sec bins |
 |
 |
| Module-wise count rates for Quadrant D Data is divided into 100 sec bins |
 |
 |
| Parameter | Plot |
|---|---|
| CZT HV Monitor | 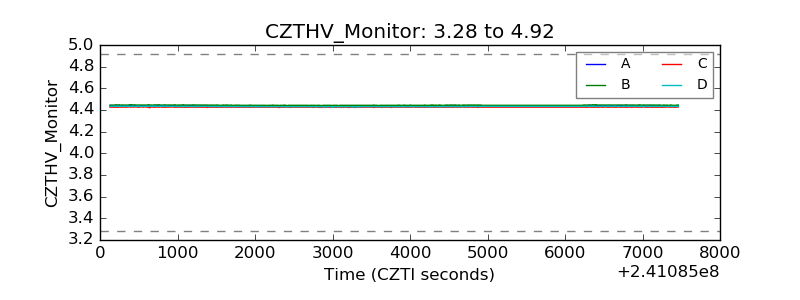 |
| D_VDD | 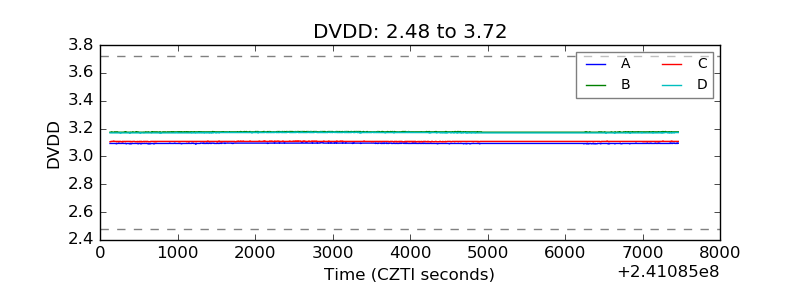 |
| Temperature 1 | 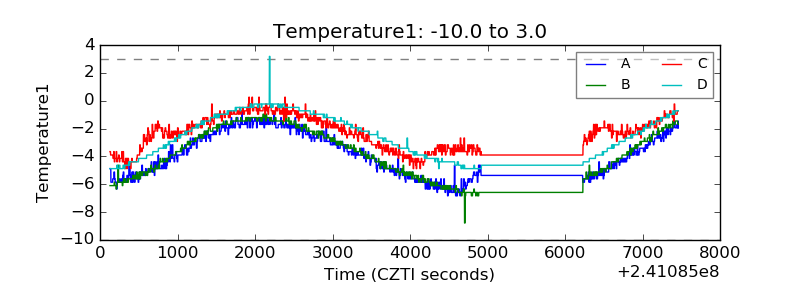 |
| Veto HV Monitor | 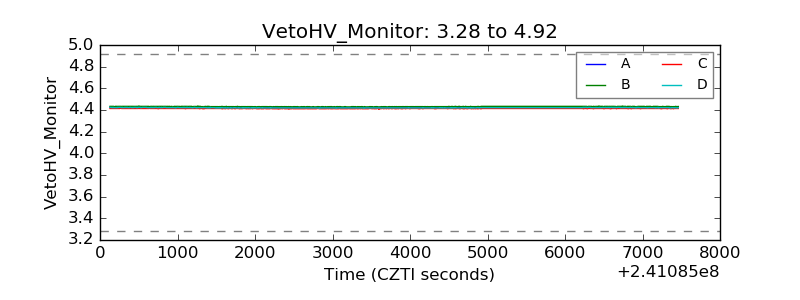 |
| Veto LLD | 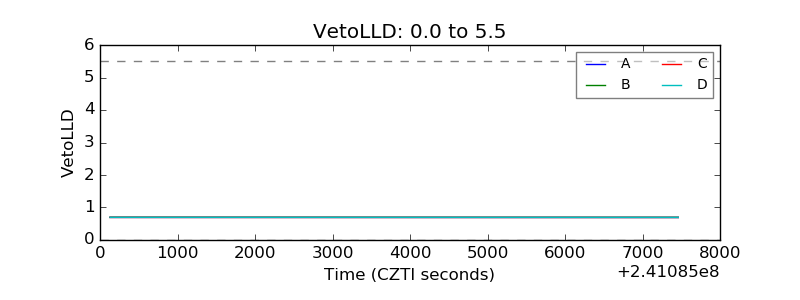 |
| Alpha Counter | 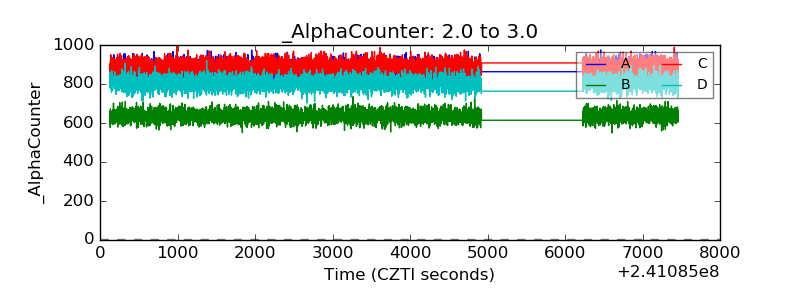 |
| _CPM_Rate | 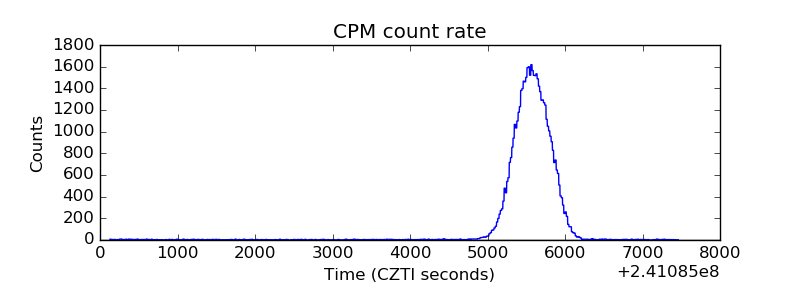 |
| CZT Counter | 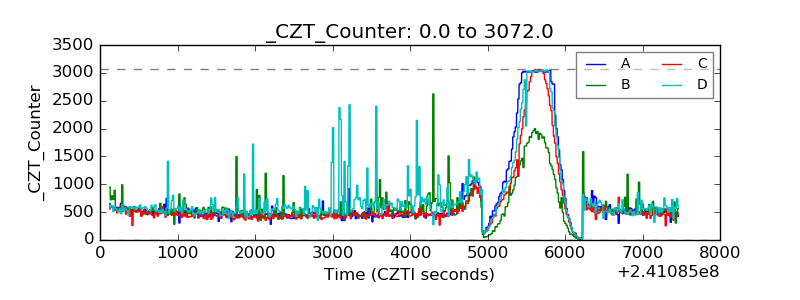 |
| +2.5 Volts monitor | 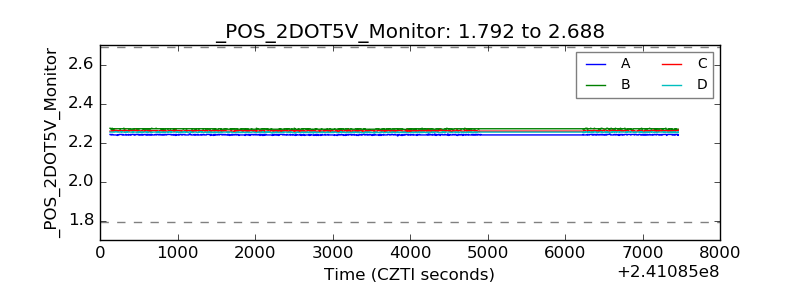 |
| +5 Volts monitor |  |
| _ROLL_ROT | 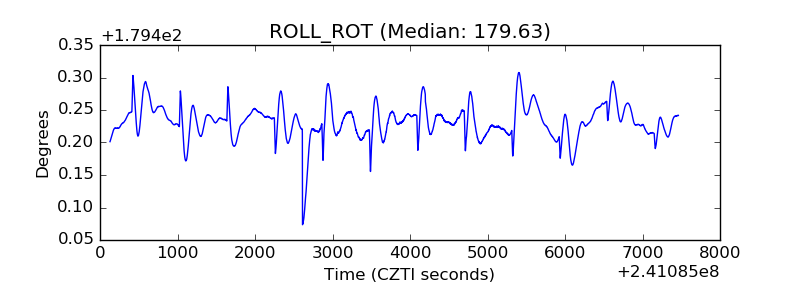 |
| _Roll_DEC | 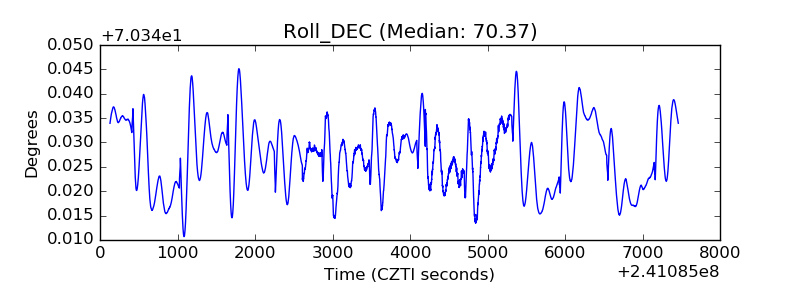 |
| _Roll_RA | 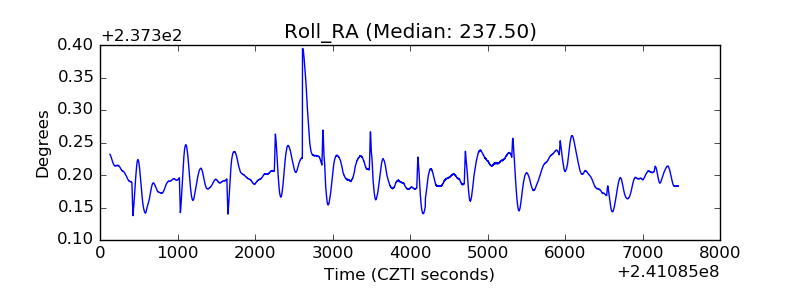 |
| Veto Counter | 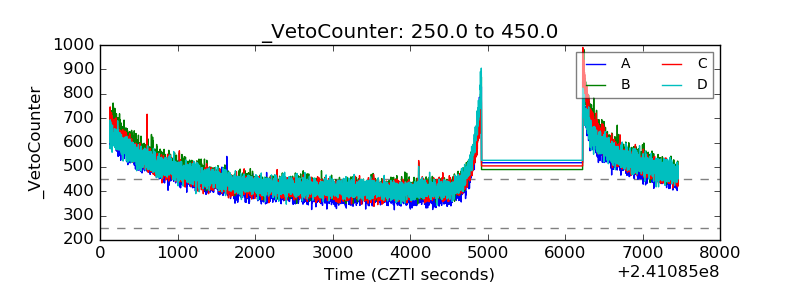 |