| Param | Original file | Final file |
|---|---|---|
| Filename | modeM0/AS1C02_021T01_9000001482_10278cztM0_level2.evt | modeM0/AS1C02_021T01_9000001482_10278cztM0_level2_quad_clean.evt |
| Size (bytes) | 461,551,680 | 109,195,200 |
| Size | 440.2 MB | 104.1 MB |
| Events in quadrant A | 3,065,182 | 732,489 |
| Events in quadrant B | 3,745,365 | 720,236 |
| Events in quadrant C | 2,929,288 | 709,121 |
| Events in quadrant D | 3,793,020 | 688,111 |
| Mode M9 | |||
|---|---|---|---|
| Quadrant | BADHDUFLAG | Total packets | Discarded packets |
| A | 0 | 12 | 0 |
| B | 0 | 12 | 0 |
| C | 0 | 12 | 0 |
| D | 0 | 12 | 0 |
| Mode SS | |||
|---|---|---|---|
| Quadrant | BADHDUFLAG | Total packets | Discarded packets |
| A | 0 | 132 | 0 |
| B | 0 | 132 | 0 |
| C | 0 | 132 | 0 |
| D | 0 | 132 | 0 |
| Mode M0 | |||
|---|---|---|---|
| Quadrant | BADHDUFLAG | Total packets | Discarded packets |
| A | 0 | 13384 | 2 |
| B | 0 | 15266 | 1 |
| C | 0 | 13277 | 1 |
| D | 0 | 15264 | 1 |
| Quadrant | Total seconds | Saturated seconds | Saturation percentage |
|---|---|---|---|
| A | 6559 | 33 | 0.503125% |
| B | 6559 | 111 | 1.692331% |
| C | 6559 | 29 | 0.442141% |
| D | 6559 | 88 | 1.341668% |
Noise dominated data is calculated using 1-second bins in cleaned event files. If a bin has >2000 counts, and if more than 50% of those come from <1% of pixels, then it is considered to be noise-dominated and hence unusable.
| Quadrant | # 1 sec bins | Bins with >0 counts | Bins with >2000 counts | High rate bins dominated by noise | Noise dominated (total time) | Noise dominated (detector-on time) | Marked lightcurve |
|---|---|---|---|---|---|---|---|
| A | 7749 | 6560 | 0 | 0 | 0.00% | 0.00% | 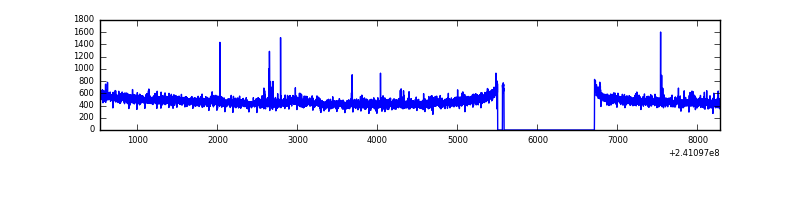 |
| B | 7749 | 6561 | 48 | 48 | 0.62% | 0.73% | 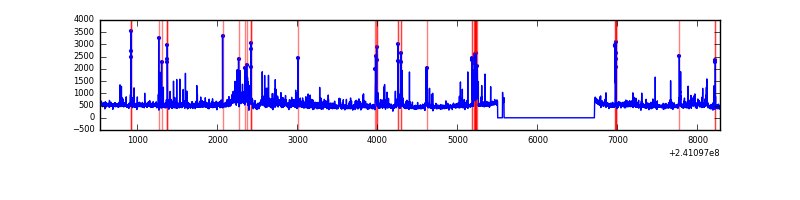 |
| C | 7749 | 6561 | 0 | 0 | 0.00% | 0.00% | 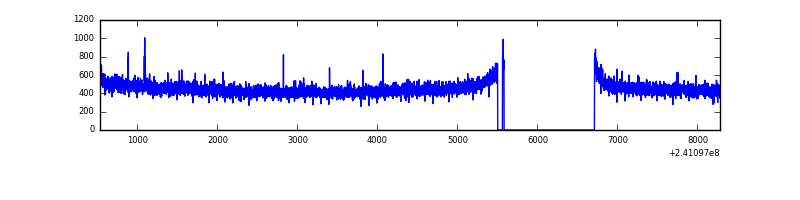 |
| D | 7749 | 6560 | 52 | 52 | 0.67% | 0.79% | 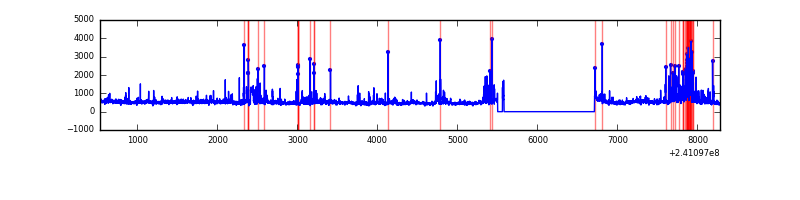 |
Top three noisy pixels from each quadrant. If the there are fewer than three noisy pixels in the level2.evt file, extra rows are filled as -1
| Pixel properties | Quadrant properties | ||||||
|---|---|---|---|---|---|---|---|
| Quadrant | DetID | PixID | Counts | Sigma | Mean | Median | Sigma |
| A | 8 | 5 | 30484 | 189.71 | 780 | 765 | 156.7 |
| A | 15 | 174 | 27015 | 167.56 | 780 | 765 | 156.7 |
| A | 0 | 226 | 7287 | 41.63 | 780 | 765 | 156.7 |
| B | 4 | 239 | 266138 | 1841.7 | 769 | 751 | 144.1 |
| B | 11 | 51 | 140406 | 969.16 | 769 | 751 | 144.1 |
| B | 0 | 85 | 104136 | 717.46 | 769 | 751 | 144.1 |
| C | 13 | 61 | 5705 | 28.96 | 749 | 751 | 171.1 |
| C | 14 | 234 | 5012 | 24.9 | 749 | 751 | 171.1 |
| C | 14 | 67 | 3259 | 14.66 | 749 | 751 | 171.1 |
| D | 8 | 195 | 287758 | 1602.4 | 753 | 733 | 179.1 |
| D | 12 | 233 | 283388 | 1578.01 | 753 | 733 | 179.1 |
| D | 2 | 16 | 94037 | 520.9 | 753 | 733 | 179.1 |
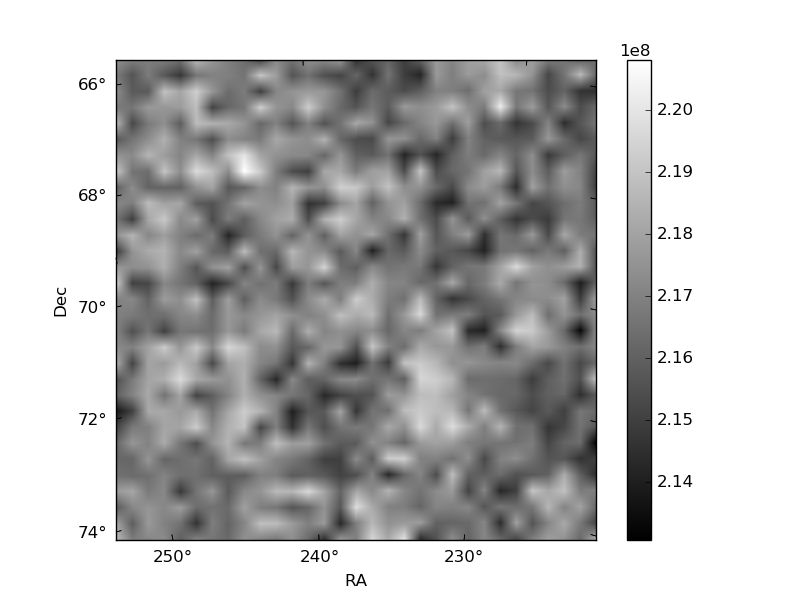
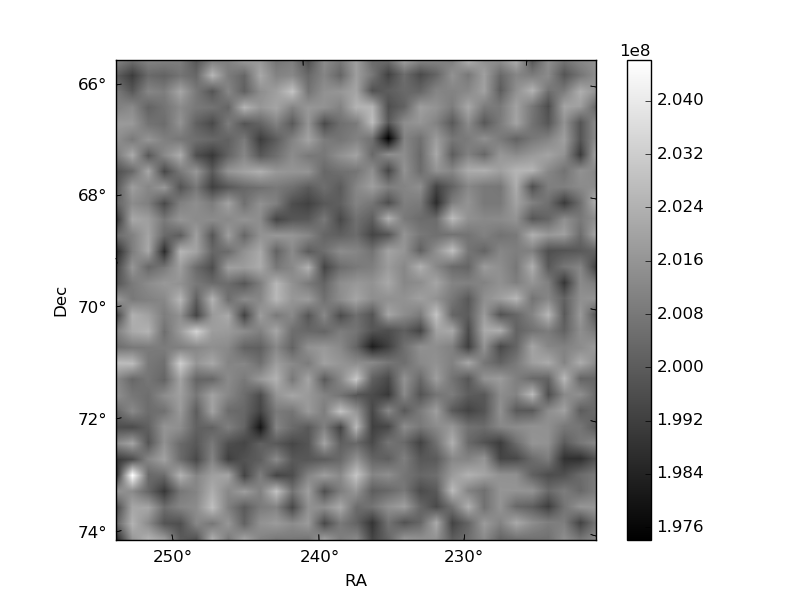
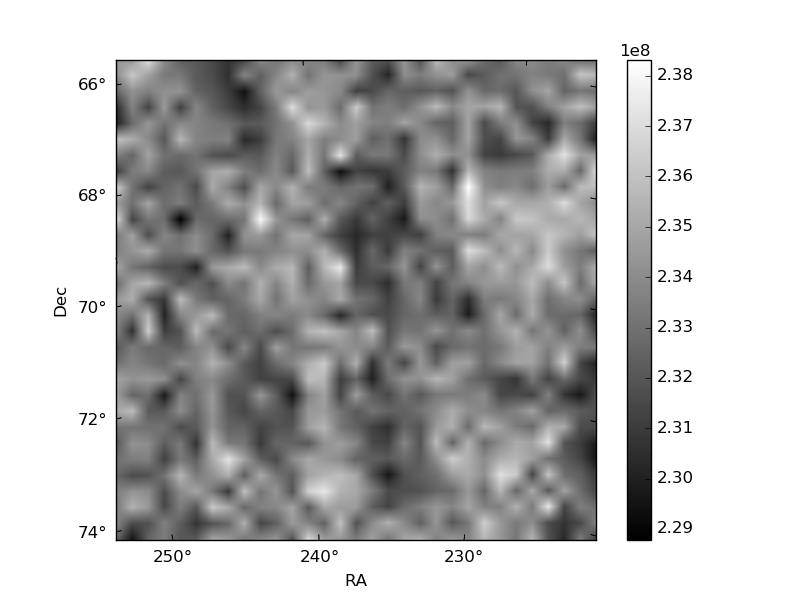
Histogram calculated using DETX and DETY for each event in the final _common_clean file
| Quadrant A | 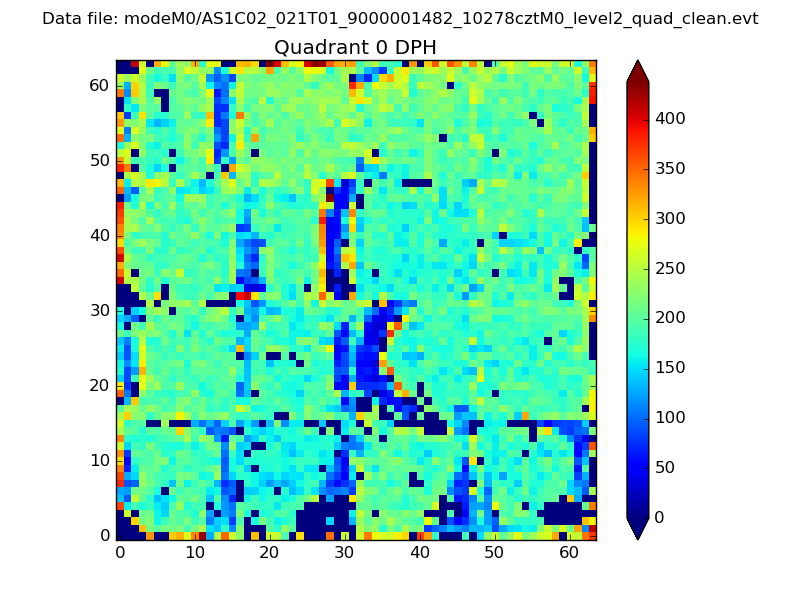 |
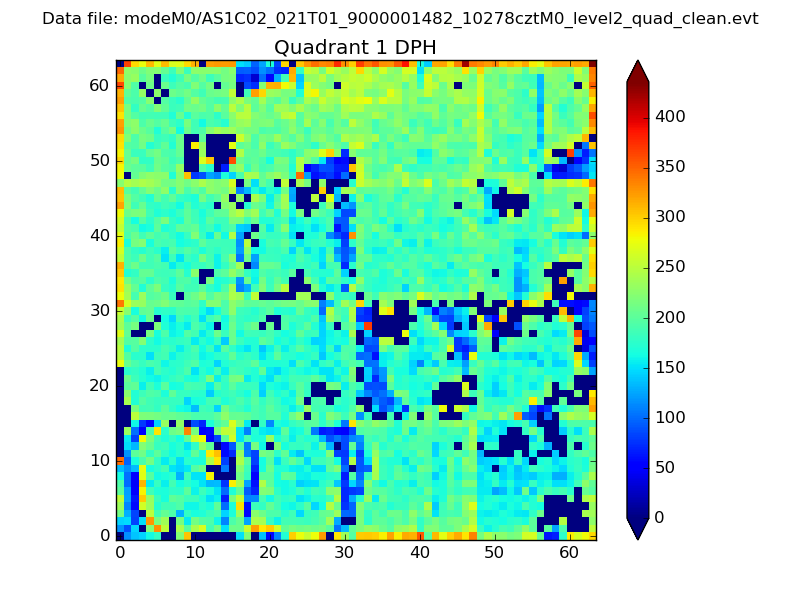 |
Quadrant B |
|---|---|---|---|
| Quadrant D | 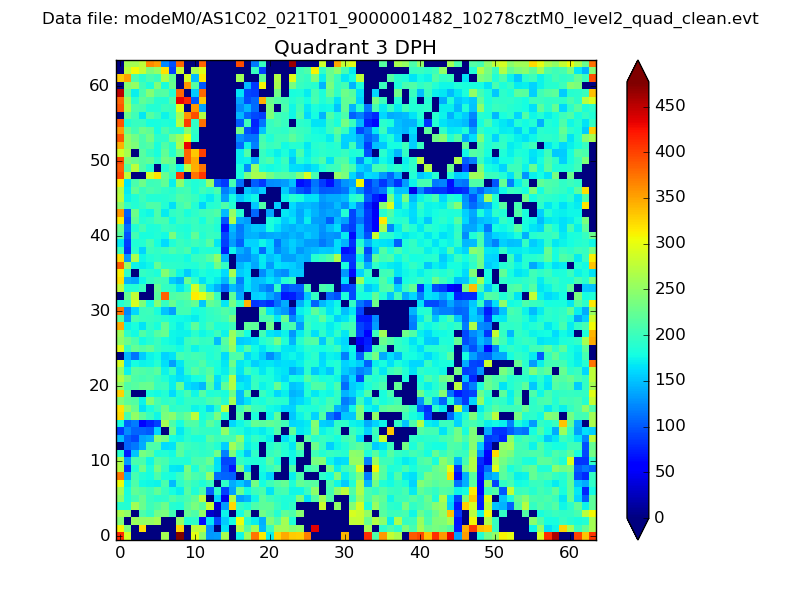 |
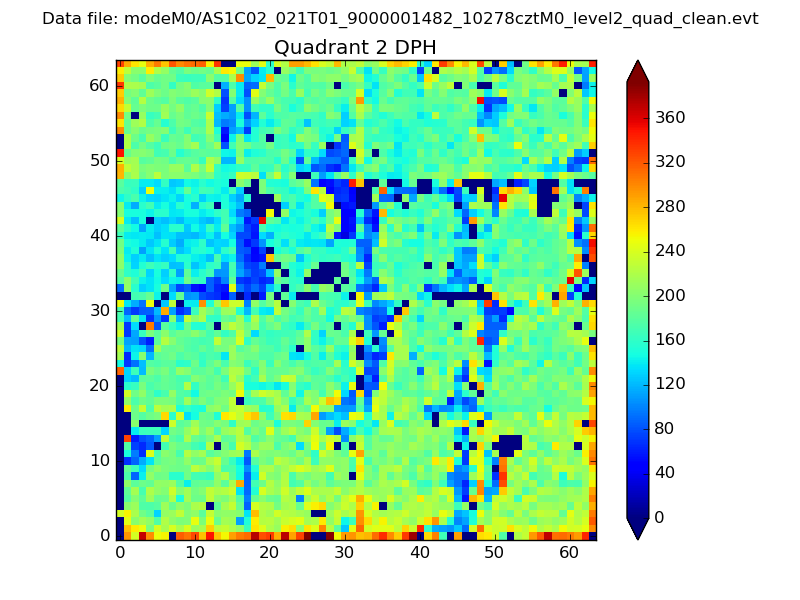 |
Quadrant C |
| Plot type | Count rate plots | Images |
|---|---|---|
| Comparison with Poisson distribution Blue bars denote a histogram of data divided into 1 sec bins. Red curve is a Poisson curve with rate = median count rate of data. |
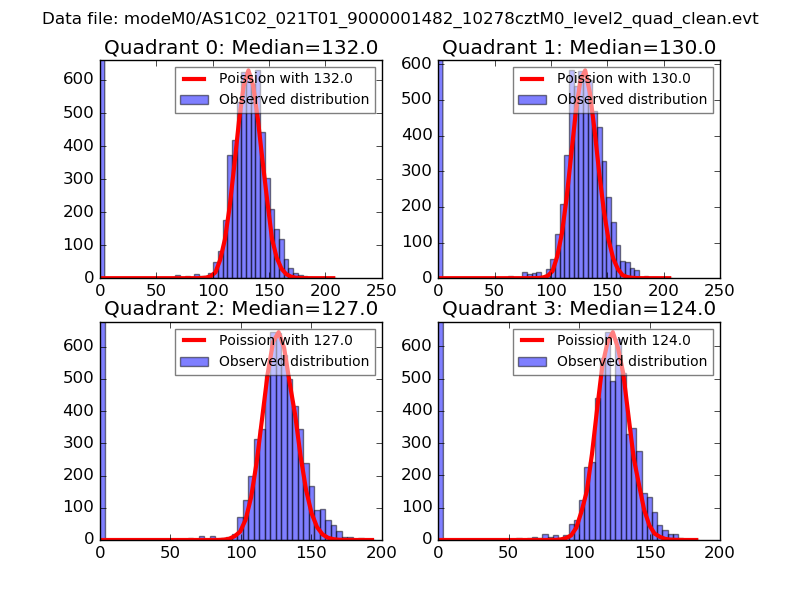 |
 |
| Quadrant-wise count rates Data is divided into 100 sec bins |
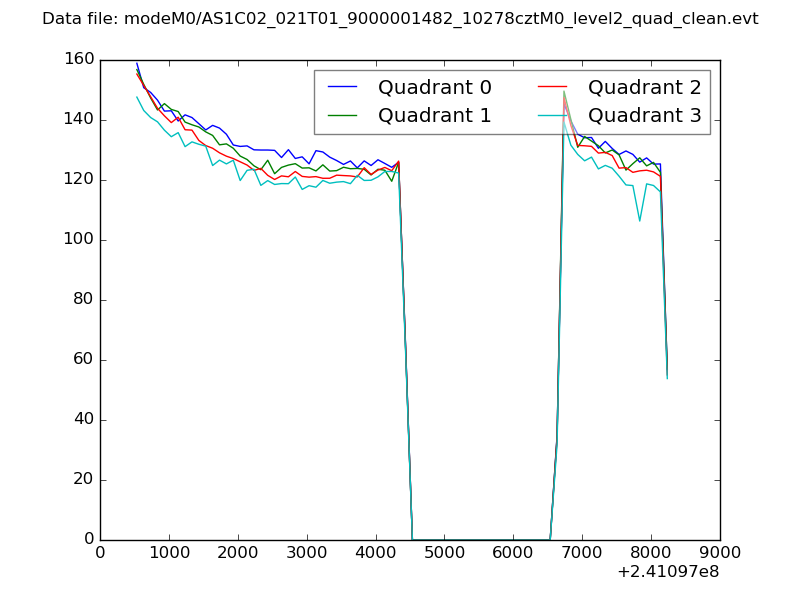 |
|
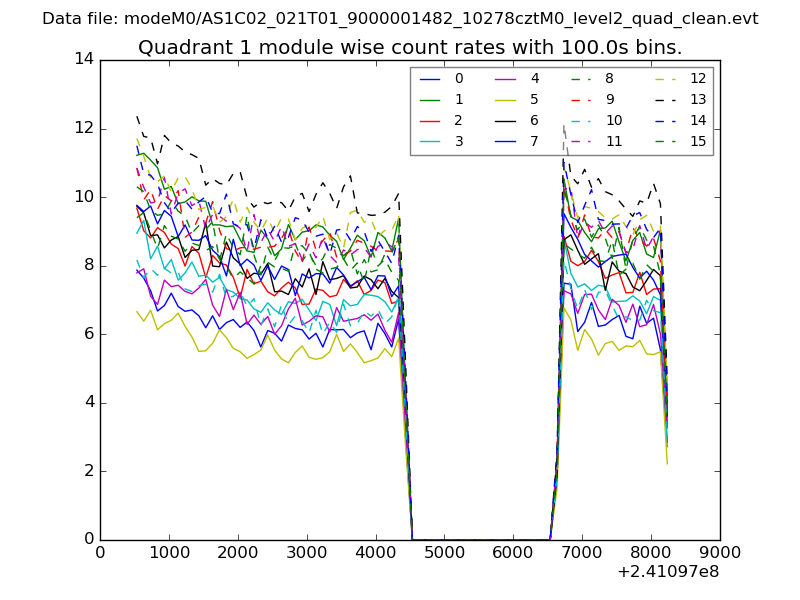
| Module-wise count rates for Quadrant A Data is divided into 100 sec bins |
 |
 |
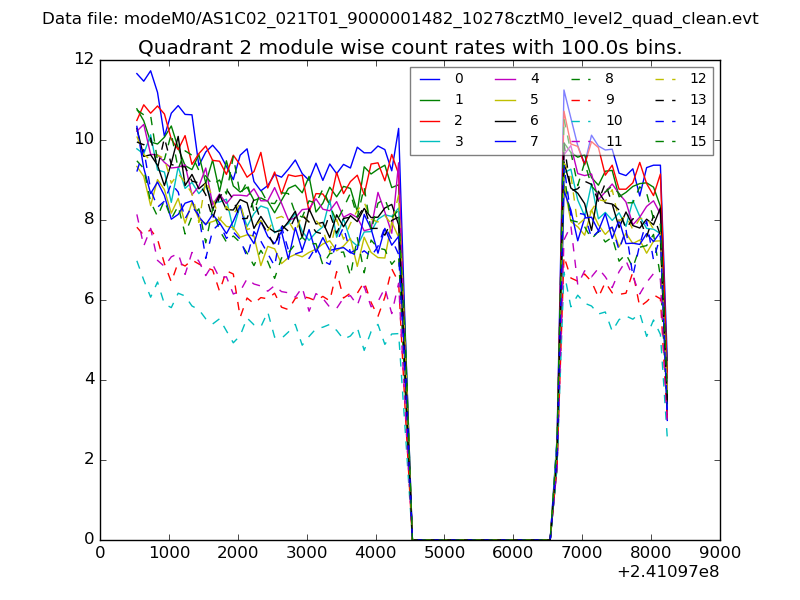
| Module-wise count rates for Quadrant B Data is divided into 100 sec bins |
 |
 |
| Module-wise count rates for Quadrant C Data is divided into 100 sec bins |
 |
 |
| Module-wise count rates for Quadrant D Data is divided into 100 sec bins |
 |
 |
| Parameter | Plot |
|---|---|
| CZT HV Monitor | 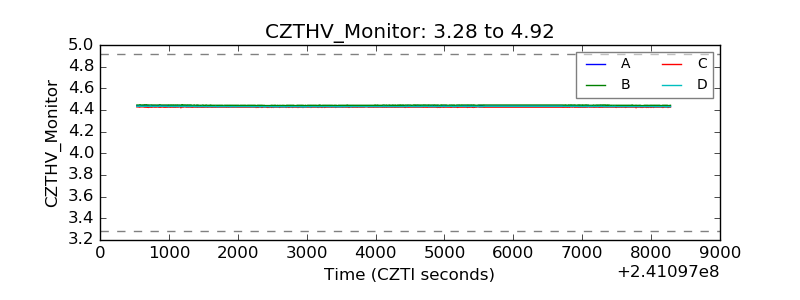 |
| D_VDD | 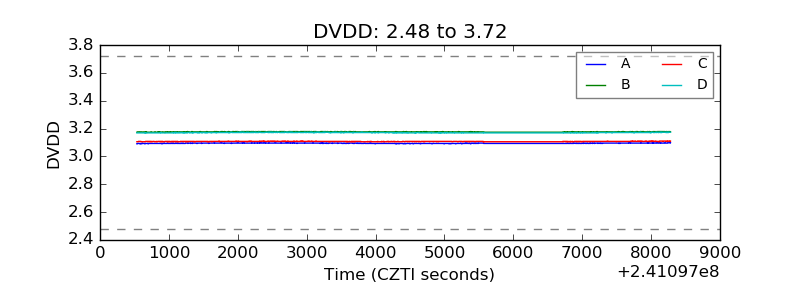 |
| Temperature 1 | 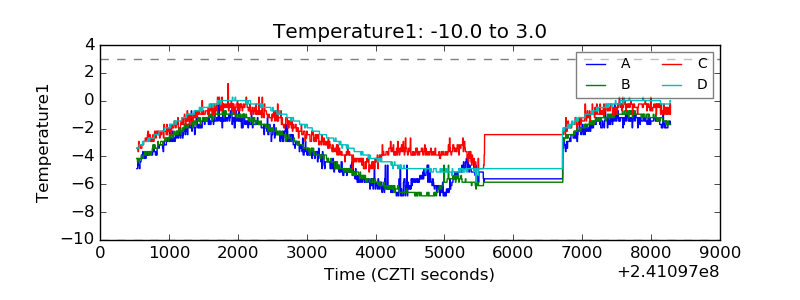 |
| Veto HV Monitor | 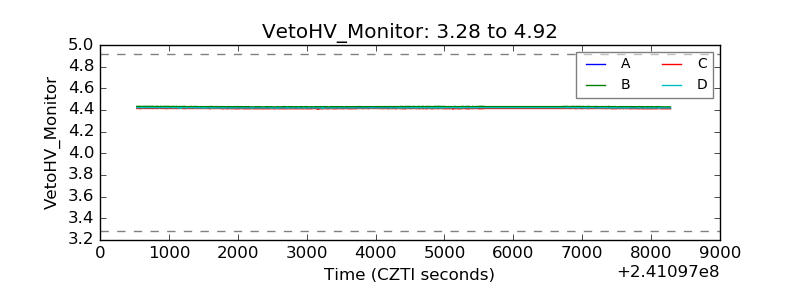 |
| Veto LLD |  |
| Alpha Counter | 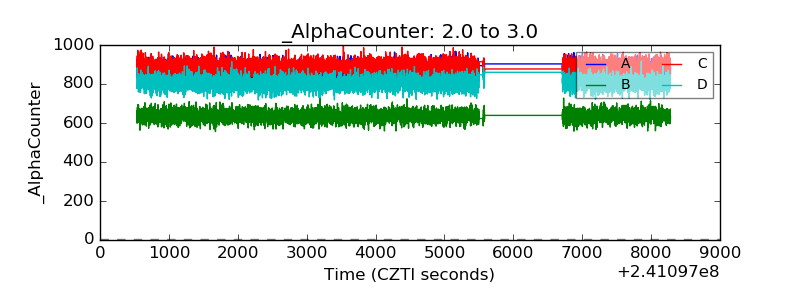 |
| _CPM_Rate | 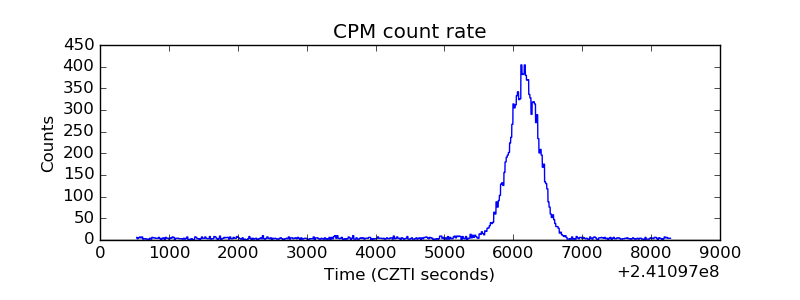 |
| CZT Counter | 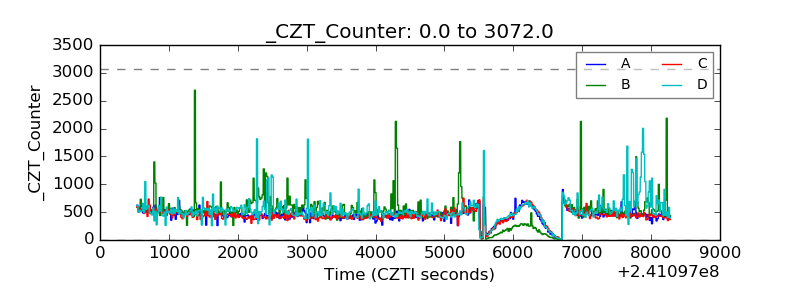 |
| +2.5 Volts monitor |  |
| +5 Volts monitor |  |
| _ROLL_ROT | 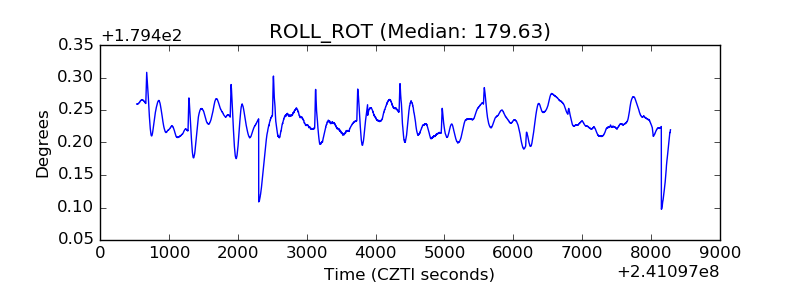 |
| _Roll_DEC | 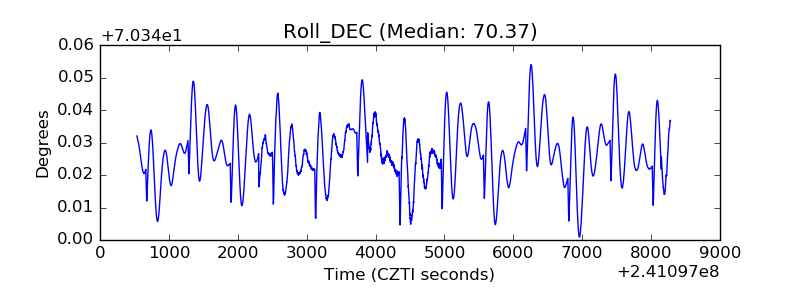 |
| _Roll_RA | 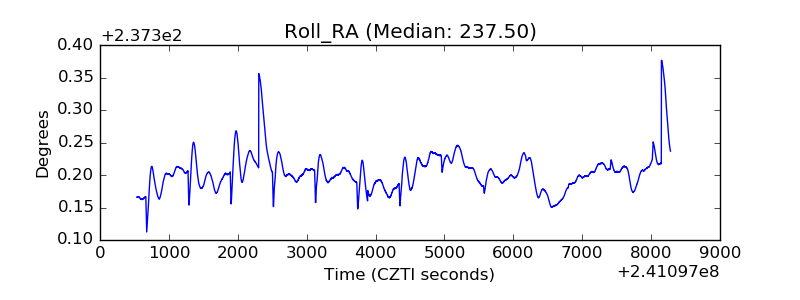 |
| Veto Counter |  |