| Param | Original file | Final file |
|---|---|---|
| Filename | modeM0/AS1C02_021T01_9000001482_10281cztM0_level2.evt | modeM0/AS1C02_021T01_9000001482_10281cztM0_level2_quad_clean.evt |
| Size (bytes) | 1,144,823,040 | 248,497,920 |
| Size | 1.1 GB | 237.0 MB |
| Events in quadrant A | 7,951,605 | 1,607,851 |
| Events in quadrant B | 8,411,022 | 1,583,074 |
| Events in quadrant C | 7,270,717 | 1,602,616 |
| Events in quadrant D | 9,905,774 | 1,580,271 |
| Mode M9 | |||
|---|---|---|---|
| Quadrant | BADHDUFLAG | Total packets | Discarded packets |
| A | 0 | 15 | 1 |
| B | 0 | 16 | 2 |
| C | 0 | 16 | 2 |
| D | 0 | 16 | 2 |
| Mode SS | |||
|---|---|---|---|
| Quadrant | BADHDUFLAG | Total packets | Discarded packets |
| A | 0 | 518 | 166 |
| B | 0 | 518 | 165 |
| C | 0 | 518 | 171 |
| D | 0 | 509 | 154 |
| Mode M0 | |||
|---|---|---|---|
| Quadrant | BADHDUFLAG | Total packets | Discarded packets |
| A | 0 | 54660 | 19339 |
| B | 0 | 57973 | 22075 |
| C | 0 | 52723 | 18628 |
| D | 0 | 64383 | 23829 |
| Quadrant | Total seconds | Saturated seconds | Saturation percentage |
|---|---|---|---|
| A | 16555 | 126 | 0.761099% |
| B | 16383 | 166 | 1.013245% |
| C | 16722 | 66 | 0.394690% |
| D | 17136 | 210 | 1.225490% |
Noise dominated data is calculated using 1-second bins in cleaned event files. If a bin has >2000 counts, and if more than 50% of those come from <1% of pixels, then it is considered to be noise-dominated and hence unusable.
| Quadrant | # 1 sec bins | Bins with >0 counts | Bins with >2000 counts | High rate bins dominated by noise | Noise dominated (total time) | Noise dominated (detector-on time) | Marked lightcurve |
|---|---|---|---|---|---|---|---|
| A | 19370 | 17714 | 14 | 14 | 0.07% | 0.08% | 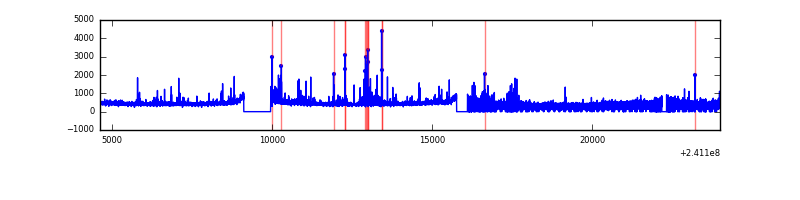 |
| B | 19370 | 17561 | 33 | 33 | 0.17% | 0.19% | 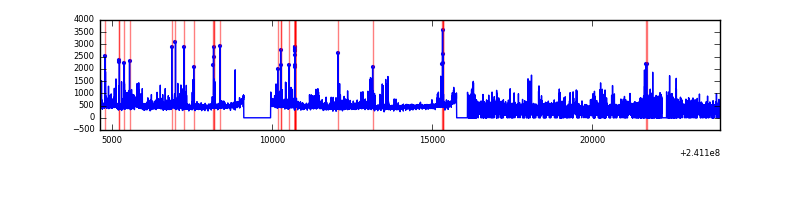 |
| C | 19370 | 17778 | 0 | 0 | 0.00% | 0.00% | 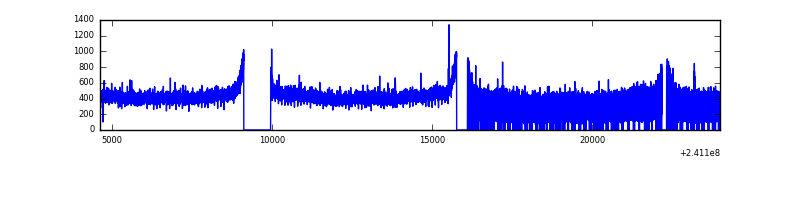 |
| D | 19370 | 17646 | 106 | 106 | 0.55% | 0.60% | 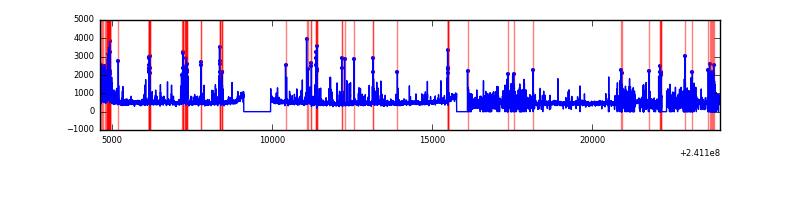 |
Top three noisy pixels from each quadrant. If the there are fewer than three noisy pixels in the level2.evt file, extra rows are filled as -1
| Pixel properties | Quadrant properties | ||||||
|---|---|---|---|---|---|---|---|
| Quadrant | DetID | PixID | Counts | Sigma | Mean | Median | Sigma |
| A | 8 | 5 | 487823 | 1289.94 | 1880 | 1837 | 376.8 |
| A | 8 | 15 | 130333 | 341.06 | 1880 | 1837 | 376.8 |
| A | 15 | 174 | 77099 | 199.77 | 1880 | 1837 | 376.8 |
| B | 11 | 51 | 385715 | 1105.17 | 1861 | 1816 | 347.4 |
| B | 4 | 239 | 320739 | 918.11 | 1861 | 1816 | 347.4 |
| B | 0 | 85 | 99728 | 281.87 | 1861 | 1816 | 347.4 |
| C | 13 | 61 | 14013 | 28.43 | 1857 | 1862 | 427.4 |
| C | 9 | 68 | 10953 | 21.27 | 1857 | 1862 | 427.4 |
| C | 14 | 67 | 10763 | 20.83 | 1857 | 1862 | 427.4 |
| D | 8 | 195 | 938525 | 2072.01 | 1898 | 1845 | 452.1 |
| D | 12 | 233 | 458443 | 1010.03 | 1898 | 1845 | 452.1 |
| D | 1 | 52 | 335345 | 737.73 | 1898 | 1845 | 452.1 |
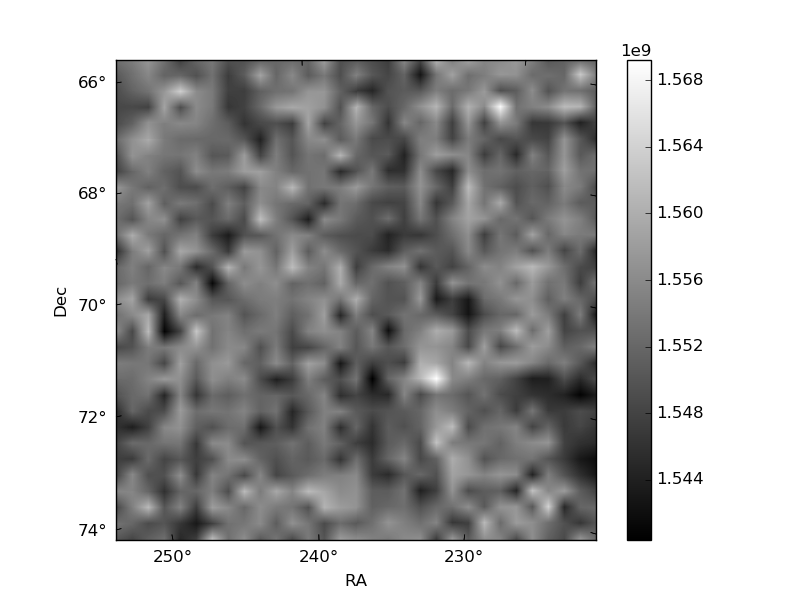
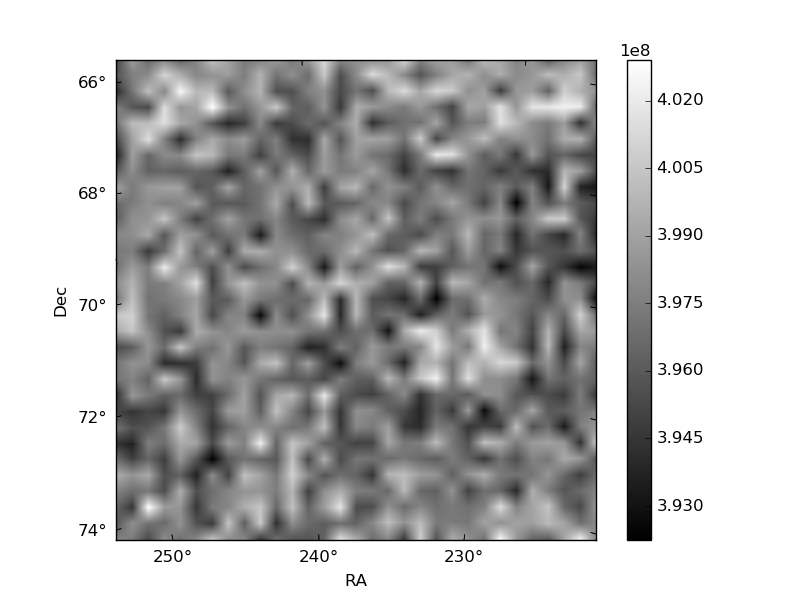
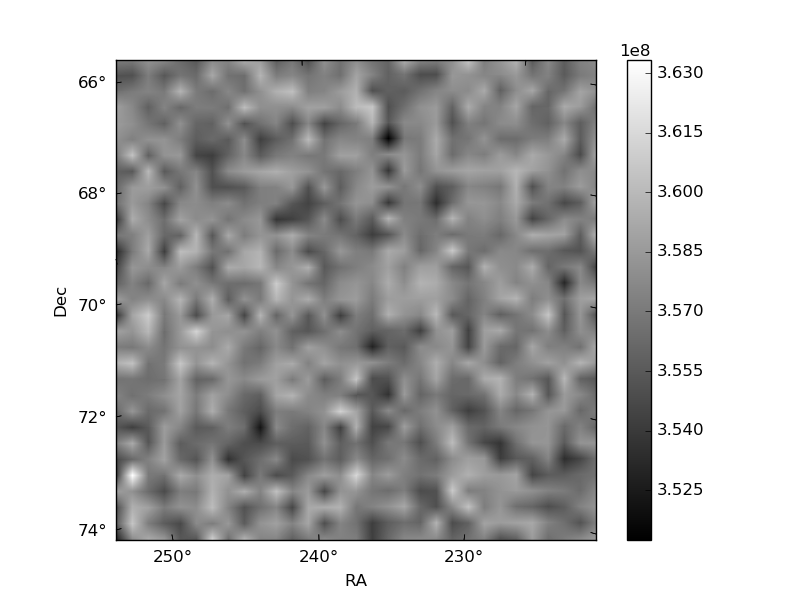
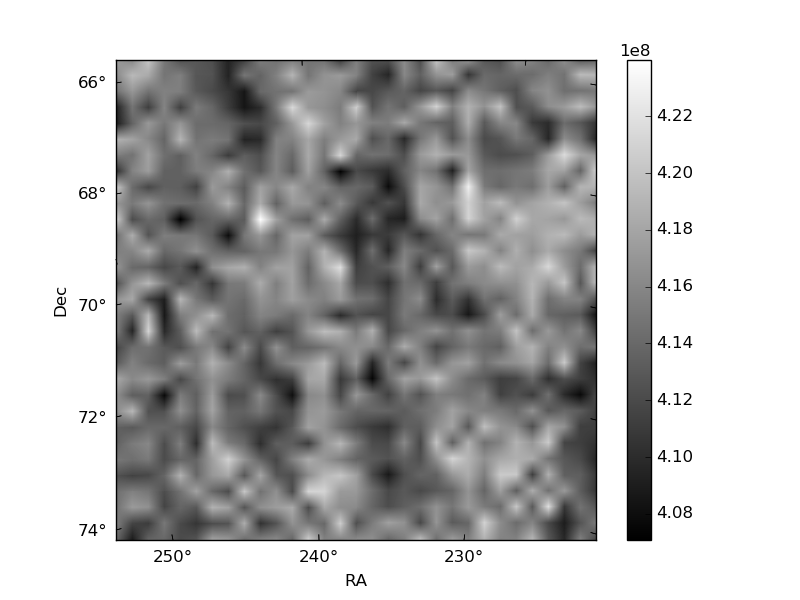
Histogram calculated using DETX and DETY for each event in the final _common_clean file
| Quadrant A | 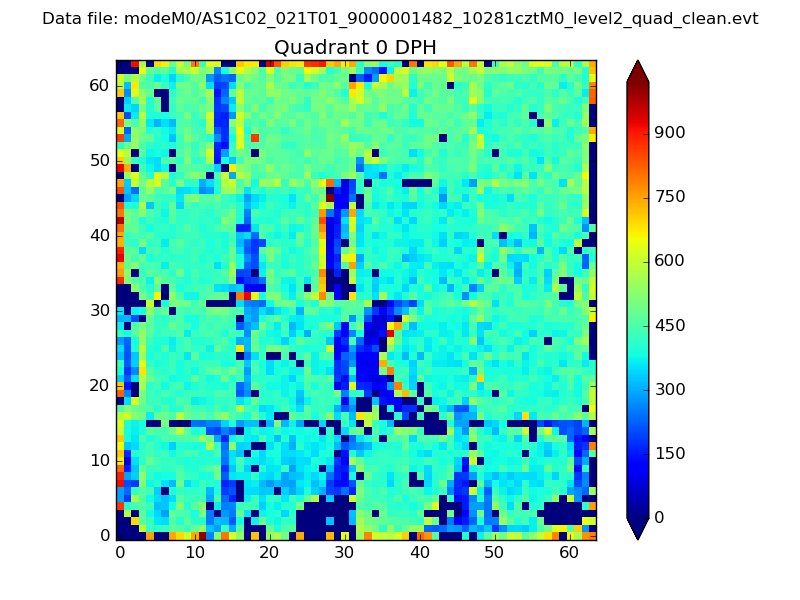 |
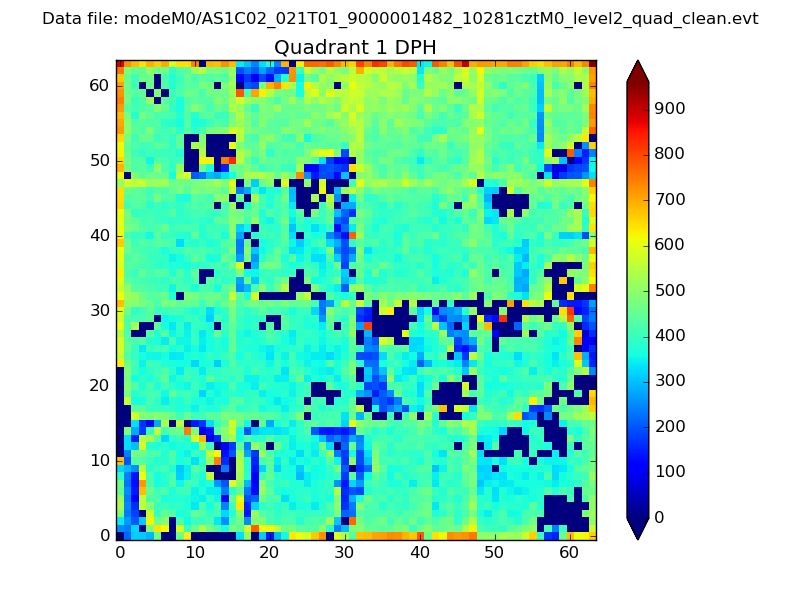 |
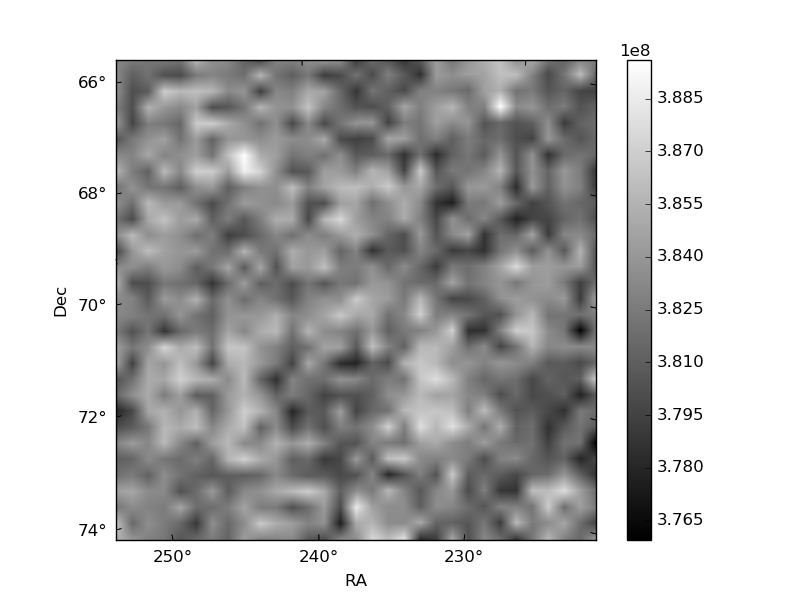
Quadrant B |
|---|---|---|---|
| Quadrant D | 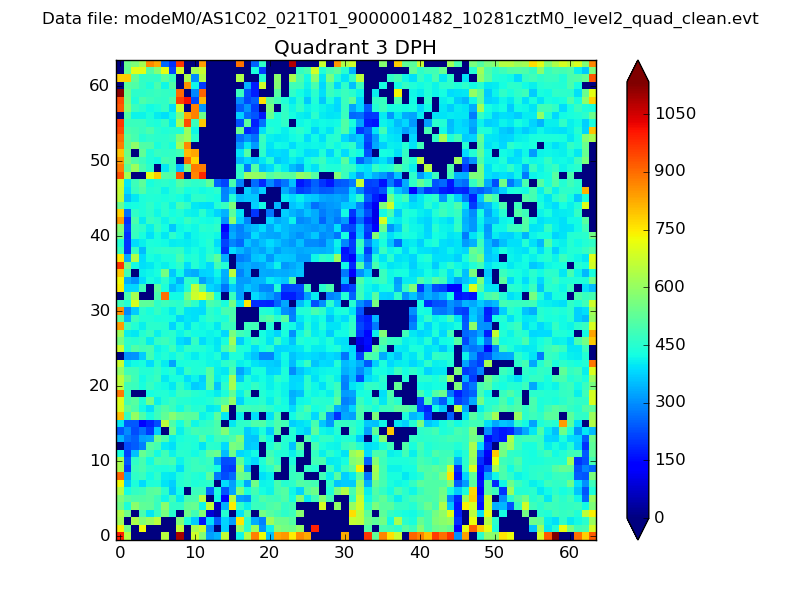 |
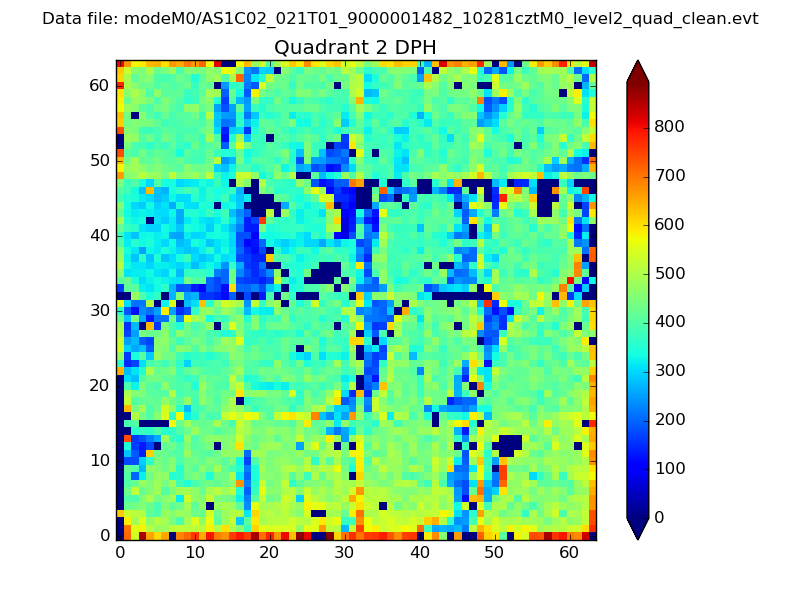 |
Quadrant C |
| Plot type | Count rate plots | Images |
|---|---|---|
| Comparison with Poisson distribution Blue bars denote a histogram of data divided into 1 sec bins. Red curve is a Poisson curve with rate = median count rate of data. |
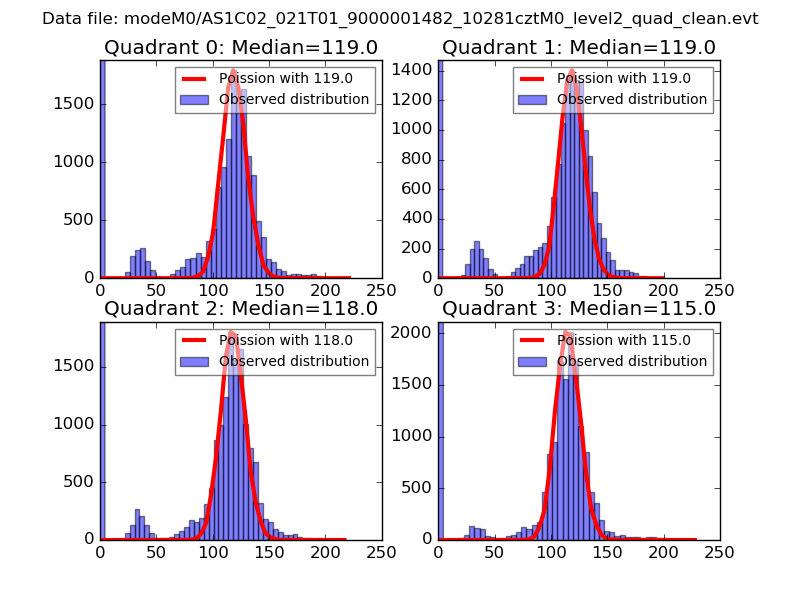 |
 |
| Quadrant-wise count rates Data is divided into 100 sec bins |
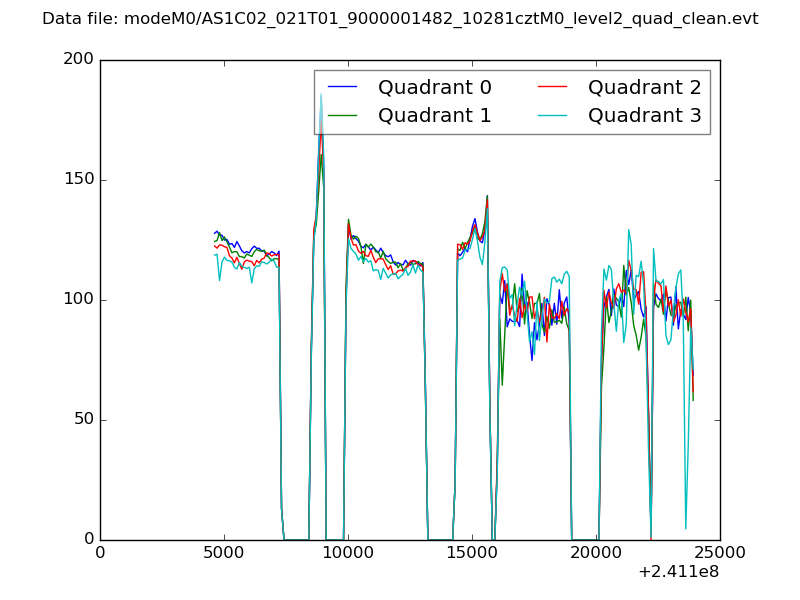 |
|
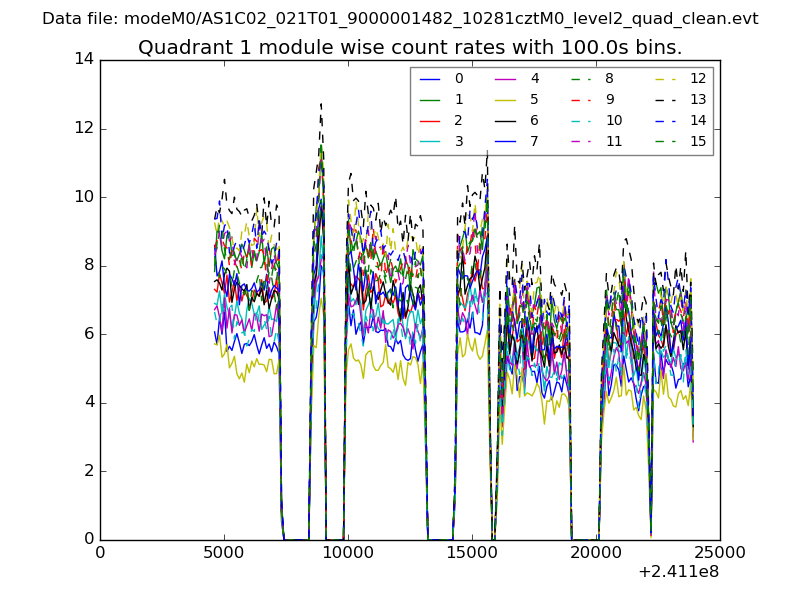
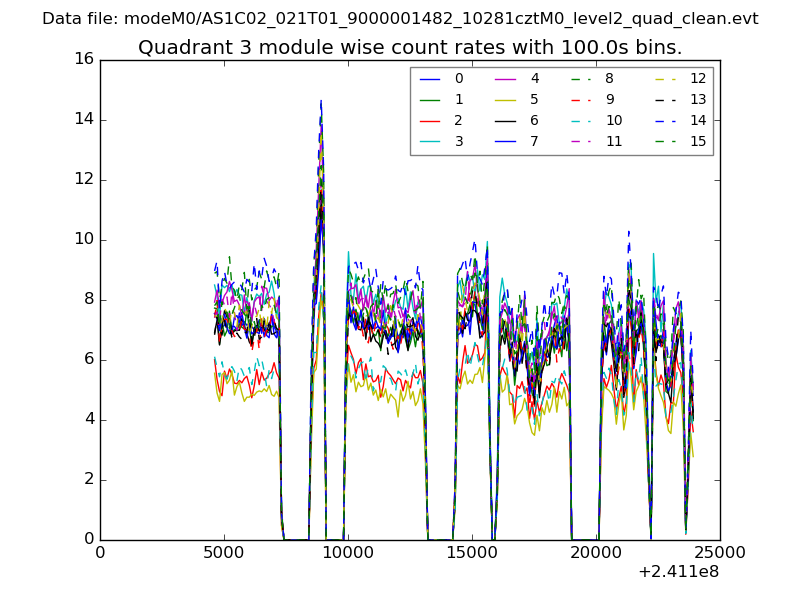
| Module-wise count rates for Quadrant A Data is divided into 100 sec bins |
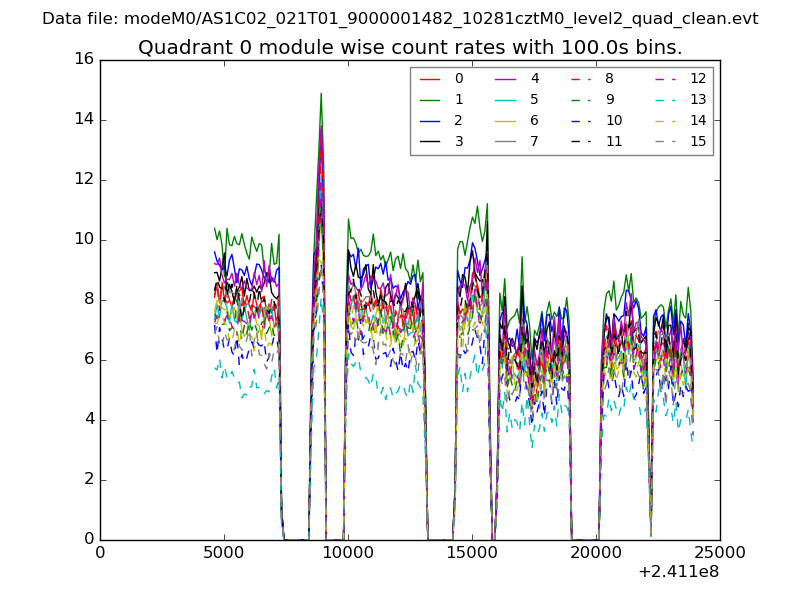 |
 |
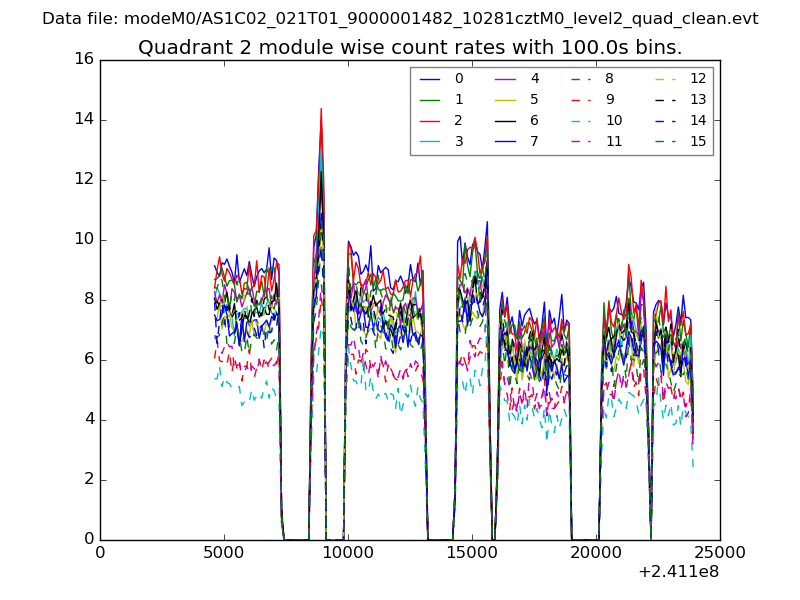
| Module-wise count rates for Quadrant B Data is divided into 100 sec bins |
 |
 |
| Module-wise count rates for Quadrant C Data is divided into 100 sec bins |
 |
 |
| Module-wise count rates for Quadrant D Data is divided into 100 sec bins |
 |
 |
| Parameter | Plot |
|---|---|
| CZT HV Monitor | 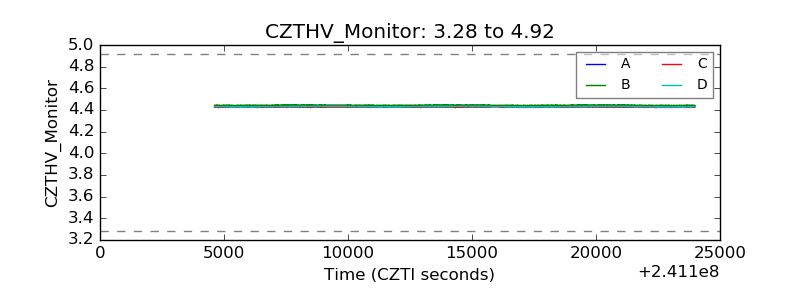 |
| D_VDD |  |
| Temperature 1 | 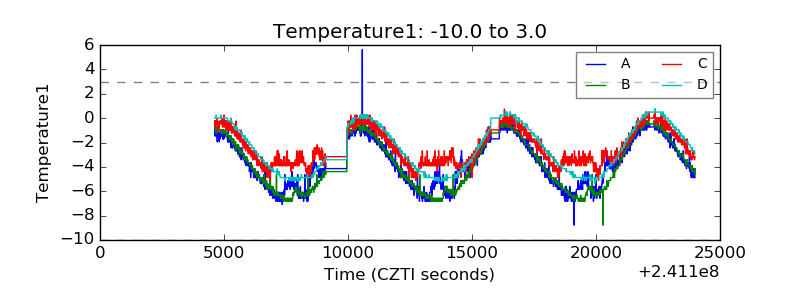 |
| Veto HV Monitor | 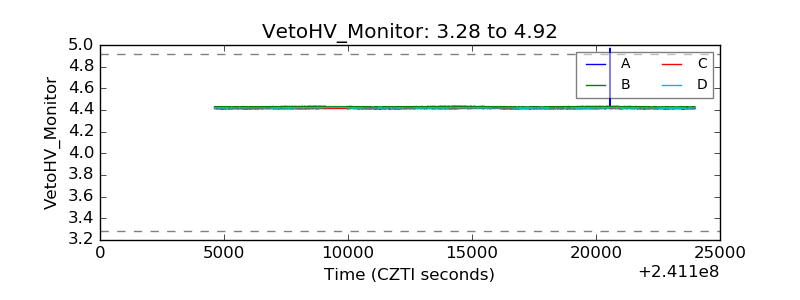 |
| Veto LLD |  |
| Alpha Counter | 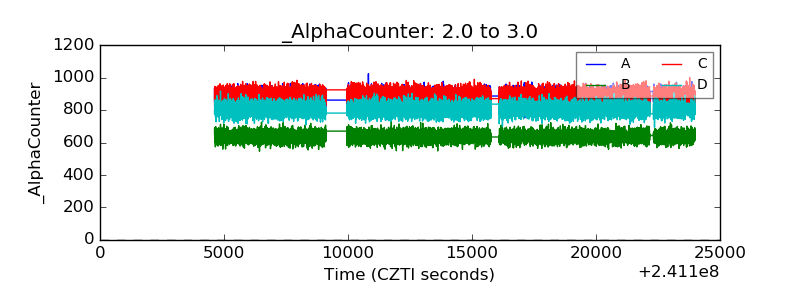 |
| _CPM_Rate | 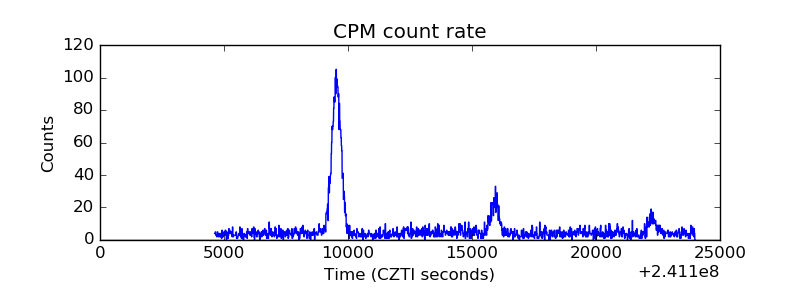 |
| CZT Counter | 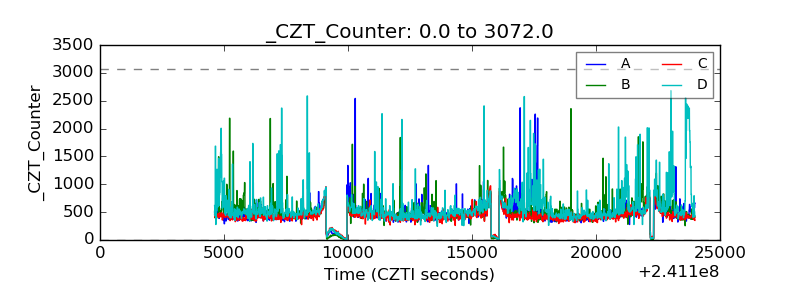 |
| +2.5 Volts monitor |  |
| +5 Volts monitor | 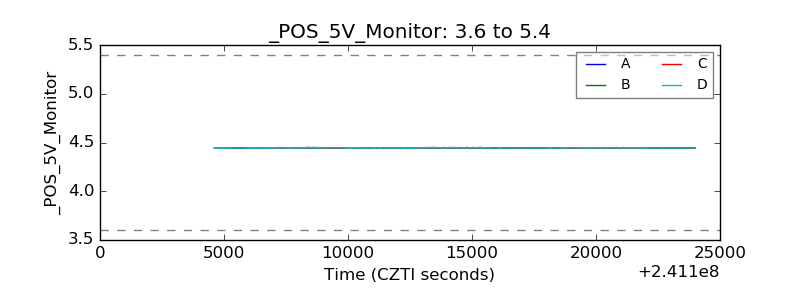 |
| _ROLL_ROT | 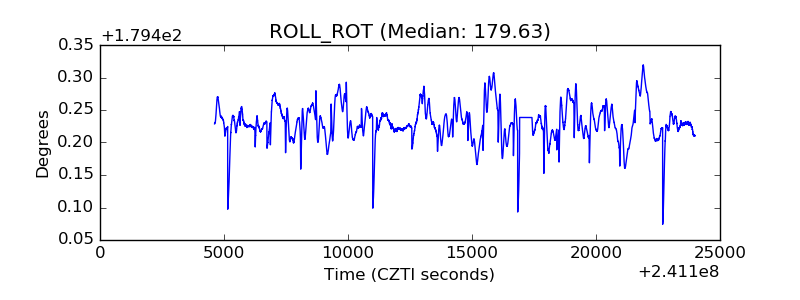 |
| _Roll_DEC | 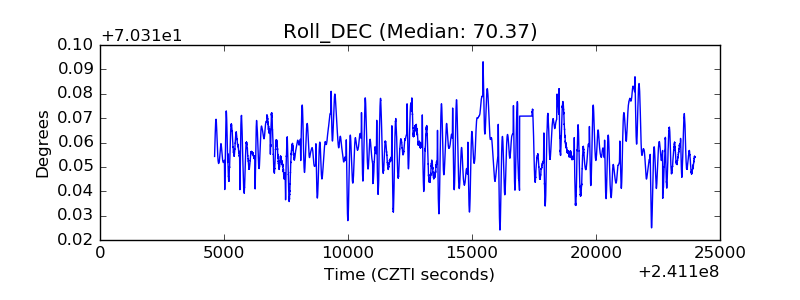 |
| _Roll_RA | 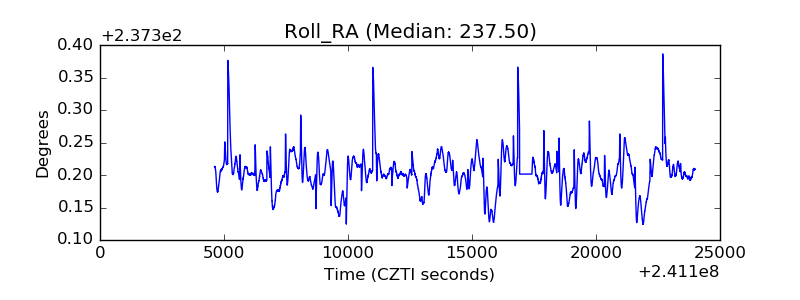 |
| Veto Counter |  |