| Param | Original file | Final file |
|---|---|---|
| Filename | modeM0/AS1C02_021T01_9000001482_10284cztM0_level2.evt | modeM0/AS1C02_021T01_9000001482_10284cztM0_level2_quad_clean.evt |
| Size (bytes) | 709,027,200 | 142,522,560 |
| Size | 676.2 MB | 135.9 MB |
| Events in quadrant A | 4,921,643 | 910,221 |
| Events in quadrant B | 5,168,700 | 915,632 |
| Events in quadrant C | 4,434,809 | 912,657 |
| Events in quadrant D | 6,259,400 | 873,968 |
| Mode M9 | |||
|---|---|---|---|
| Quadrant | BADHDUFLAG | Total packets | Discarded packets |
| A | 0 | 8 | 0 |
| B | 0 | 8 | 0 |
| C | 0 | 8 | 0 |
| D | 0 | 8 | 0 |
| Mode SS | |||
|---|---|---|---|
| Quadrant | BADHDUFLAG | Total packets | Discarded packets |
| A | 0 | 208 | 0 |
| B | 0 | 208 | 0 |
| C | 0 | 208 | 0 |
| D | 0 | 208 | 0 |
| Mode M0 | |||
|---|---|---|---|
| Quadrant | BADHDUFLAG | Total packets | Discarded packets |
| A | 0 | 21821 | 4 |
| B | 0 | 22457 | 2 |
| C | 0 | 20854 | 2 |
| D | 0 | 25341 | 2 |
| Quadrant | Total seconds | Saturated seconds | Saturation percentage |
|---|---|---|---|
| A | 10157 | 62 | 0.610416% |
| B | 10158 | 163 | 1.604647% |
| C | 10158 | 45 | 0.443001% |
| D | 10158 | 187 | 1.840914% |
Noise dominated data is calculated using 1-second bins in cleaned event files. If a bin has >2000 counts, and if more than 50% of those come from <1% of pixels, then it is considered to be noise-dominated and hence unusable.
| Quadrant | # 1 sec bins | Bins with >0 counts | Bins with >2000 counts | High rate bins dominated by noise | Noise dominated (total time) | Noise dominated (detector-on time) | Marked lightcurve |
|---|---|---|---|---|---|---|---|
| A | 10988 | 10160 | 23 | 23 | 0.21% | 0.23% | 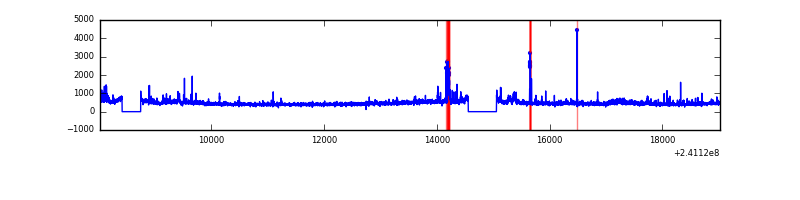 |
| B | 10988 | 10160 | 69 | 69 | 0.63% | 0.68% | 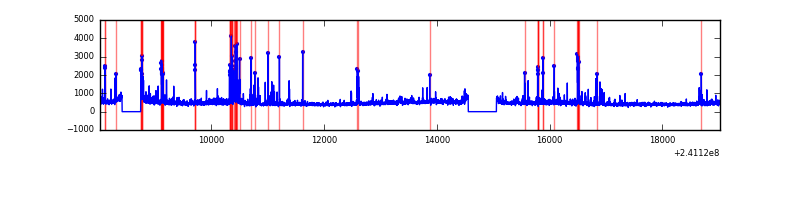 |
| C | 10988 | 10160 | 14 | 14 | 0.13% | 0.14% | 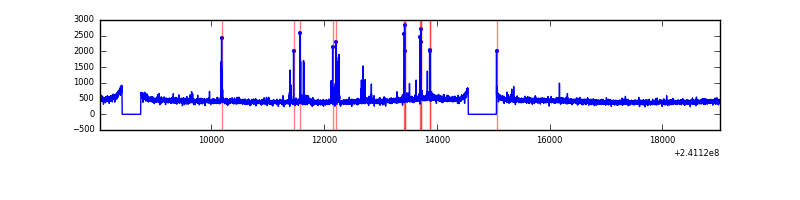 |
| D | 10988 | 10160 | 137 | 137 | 1.25% | 1.35% | 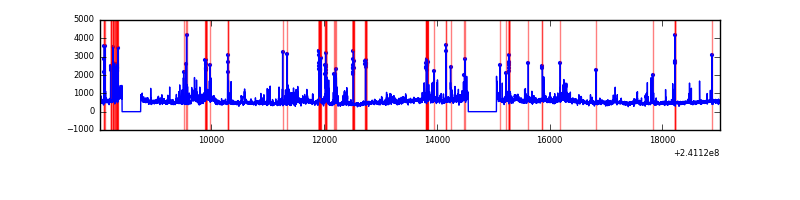 |
Top three noisy pixels from each quadrant. If the there are fewer than three noisy pixels in the level2.evt file, extra rows are filled as -1
| Pixel properties | Quadrant properties | ||||||
|---|---|---|---|---|---|---|---|
| Quadrant | DetID | PixID | Counts | Sigma | Mean | Median | Sigma |
| A | 8 | 15 | 376369 | 1630.1 | 1125 | 1096 | 230.2 |
| A | 5 | 16 | 69943 | 299.06 | 1125 | 1096 | 230.2 |
| A | 8 | 5 | 65432 | 279.46 | 1125 | 1096 | 230.2 |
| B | 4 | 239 | 342235 | 1592.09 | 1131 | 1103 | 214.3 |
| B | 11 | 51 | 219207 | 1017.91 | 1131 | 1103 | 214.3 |
| B | 6 | 51 | 51204 | 233.82 | 1131 | 1103 | 214.3 |
| C | 4 | 254 | 123705 | 481.76 | 1099 | 1105 | 254.5 |
| C | 13 | 61 | 8337 | 28.42 | 1099 | 1105 | 254.5 |
| C | 8 | 128 | 8268 | 28.15 | 1099 | 1105 | 254.5 |
| D | 8 | 195 | 708044 | 2694.81 | 1089 | 1056 | 262.4 |
| D | 13 | 105 | 429681 | 1633.78 | 1089 | 1056 | 262.4 |
| D | 2 | 14 | 314150 | 1193.41 | 1089 | 1056 | 262.4 |
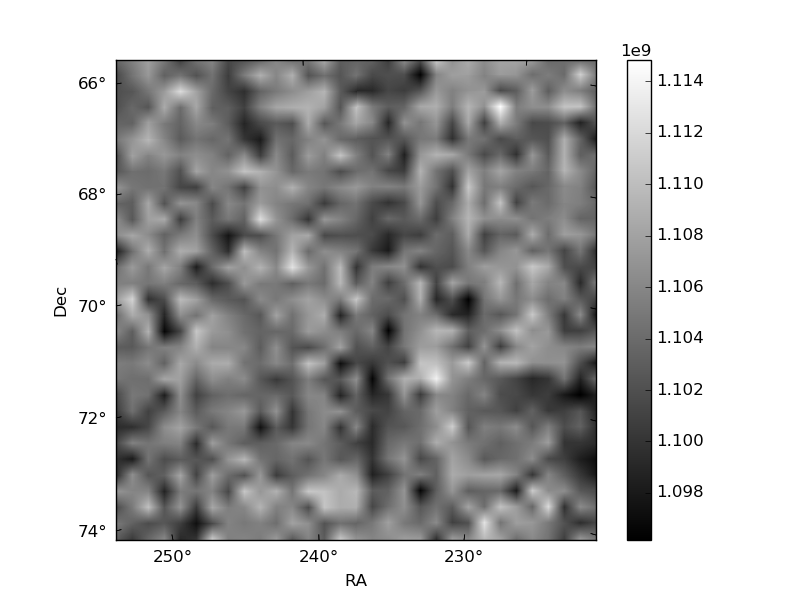
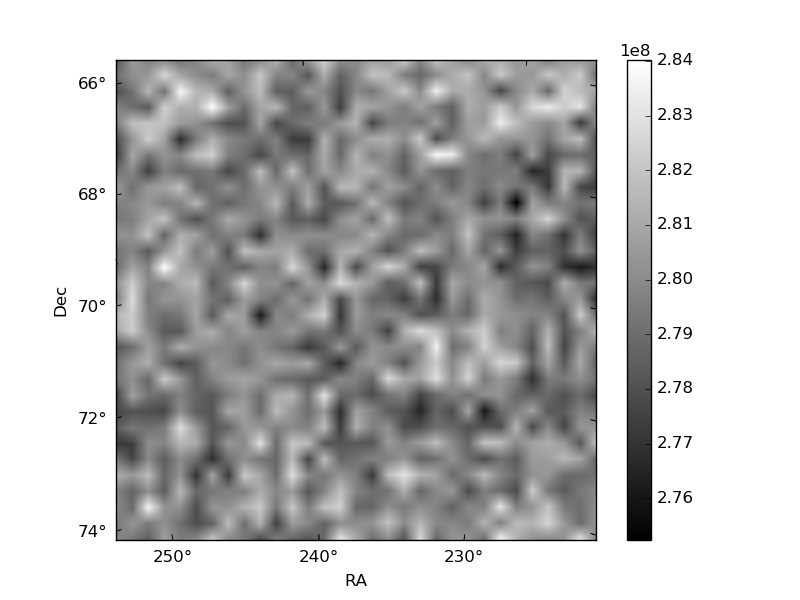
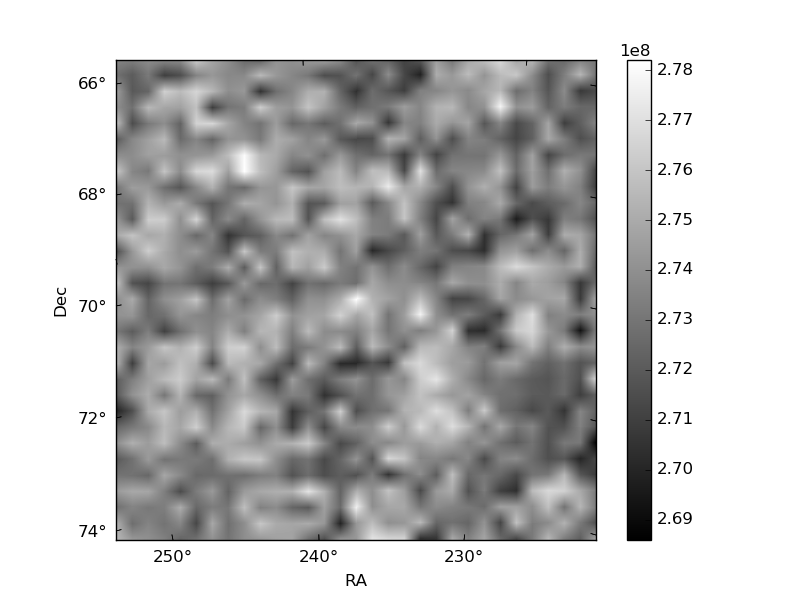
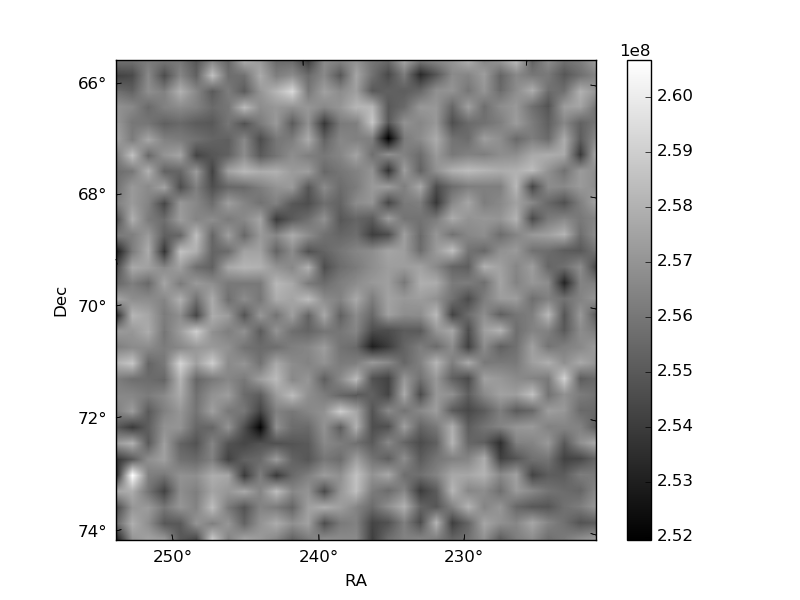
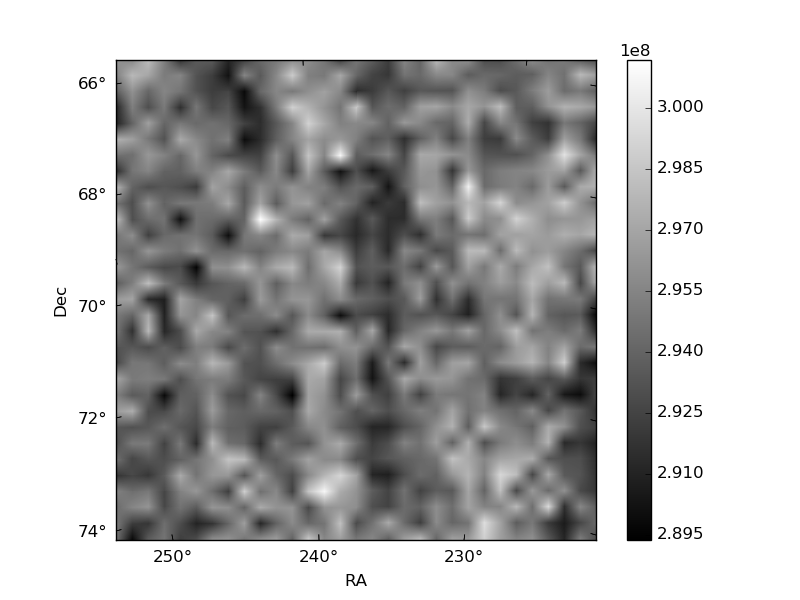
Histogram calculated using DETX and DETY for each event in the final _common_clean file
| Quadrant A | 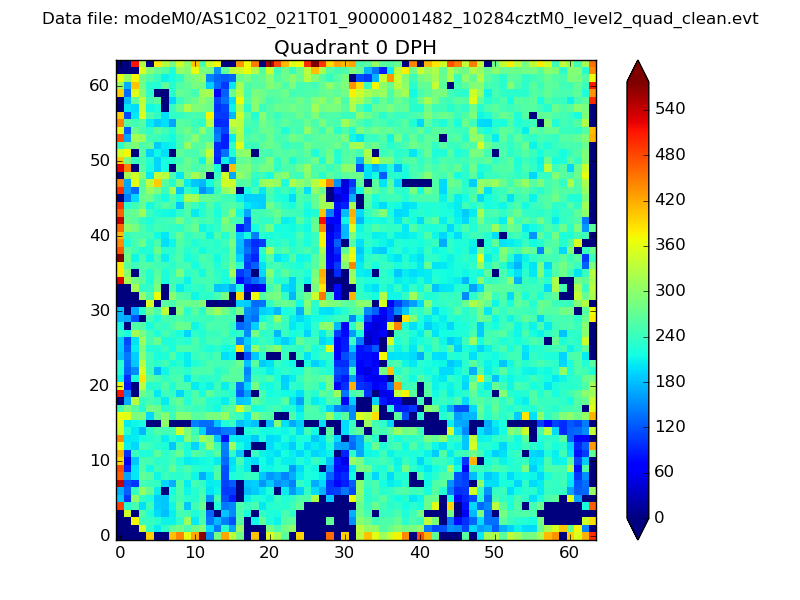 |
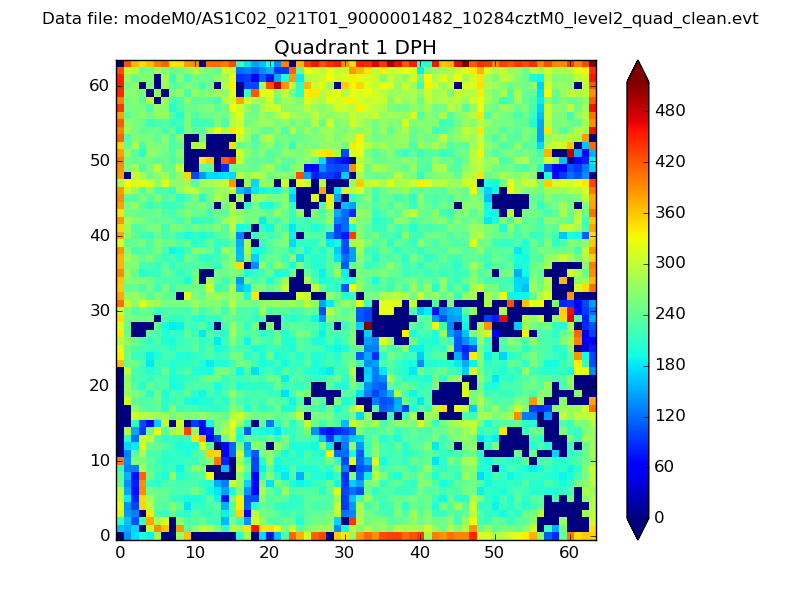 |
Quadrant B |
|---|---|---|---|
| Quadrant D | 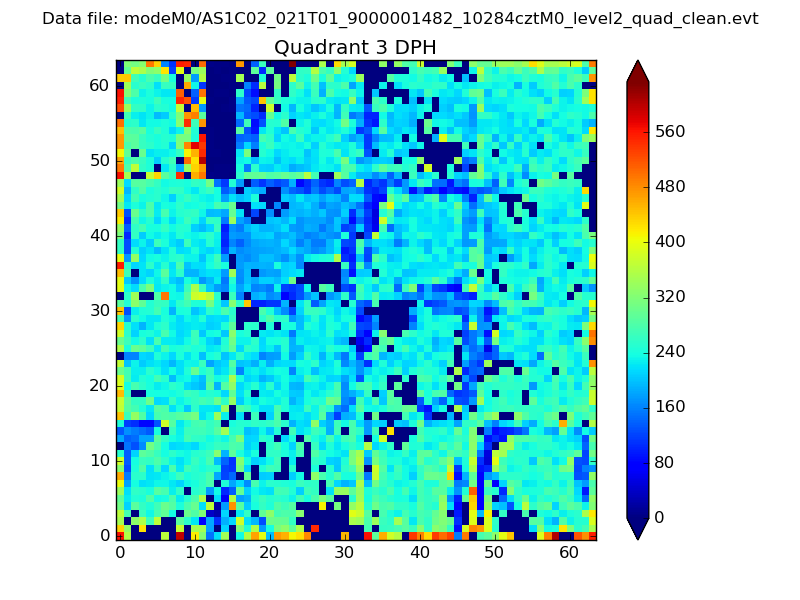 |
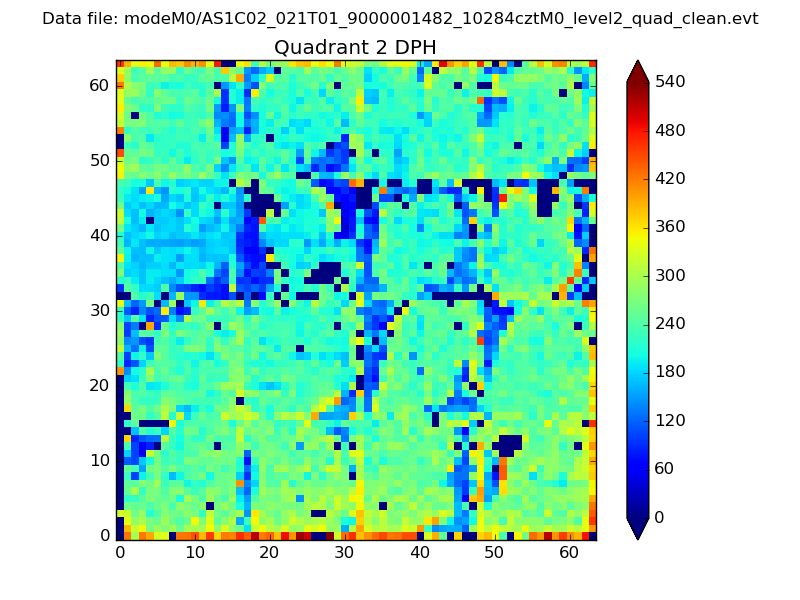 |
Quadrant C |
| Plot type | Count rate plots | Images |
|---|---|---|
| Comparison with Poisson distribution Blue bars denote a histogram of data divided into 1 sec bins. Red curve is a Poisson curve with rate = median count rate of data. |
 |
 |
| Quadrant-wise count rates Data is divided into 100 sec bins |
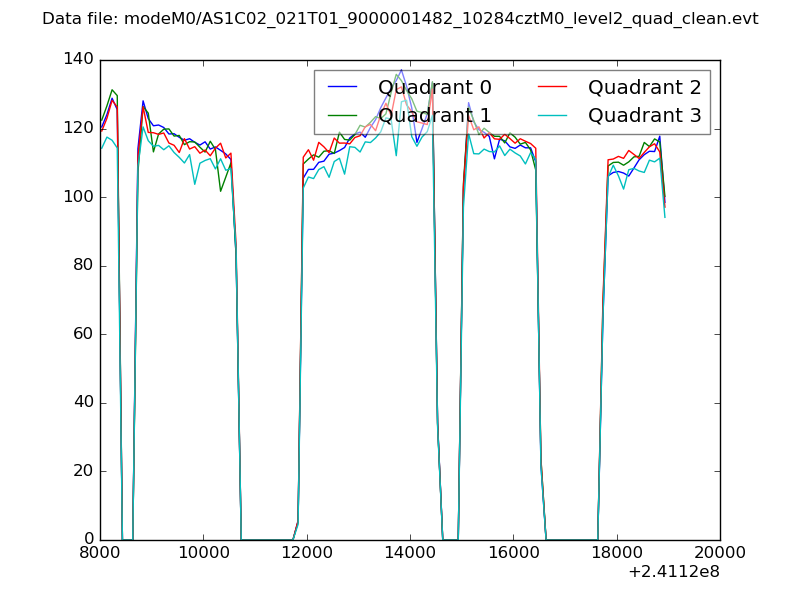 |
|
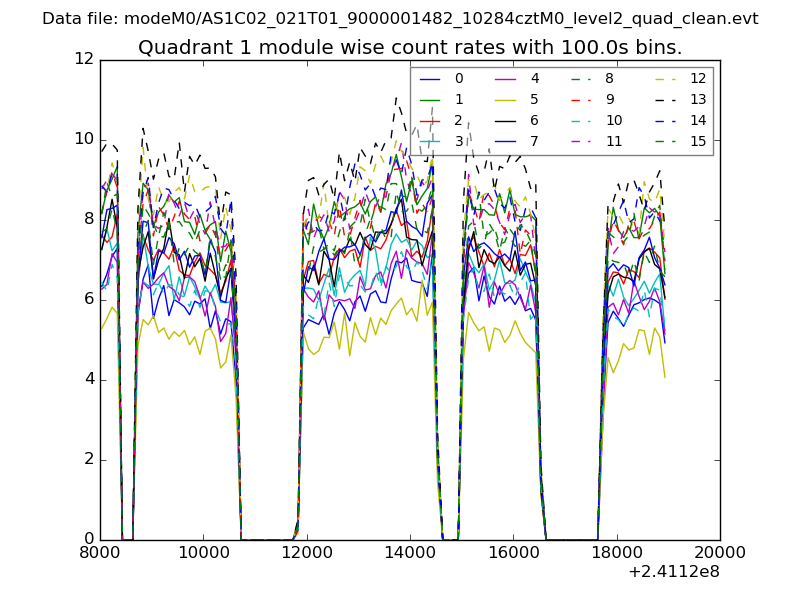
| Module-wise count rates for Quadrant A Data is divided into 100 sec bins |
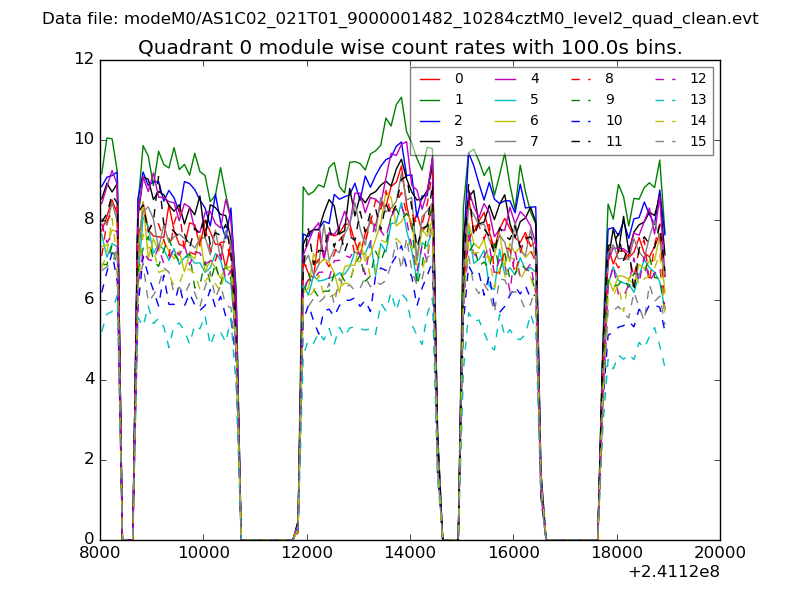 |
 |
| Module-wise count rates for Quadrant B Data is divided into 100 sec bins |
 |
 |
| Module-wise count rates for Quadrant C Data is divided into 100 sec bins |
 |
 |
| Module-wise count rates for Quadrant D Data is divided into 100 sec bins |
 |
 |
| Parameter | Plot |
|---|---|
| CZT HV Monitor | 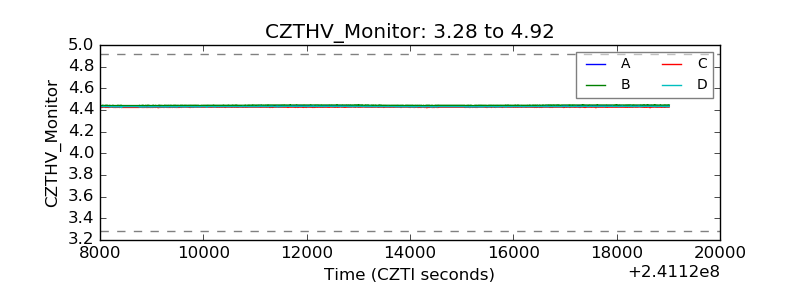 |
| D_VDD | 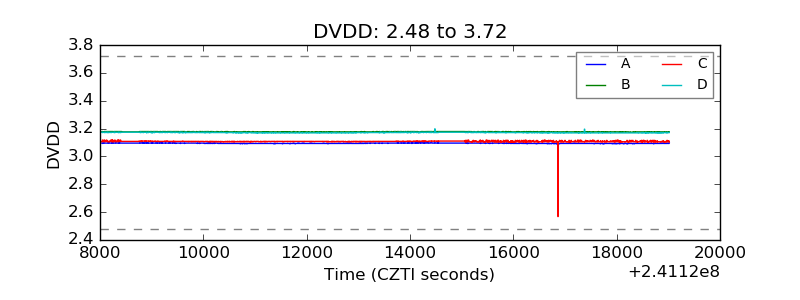 |
| Temperature 1 | 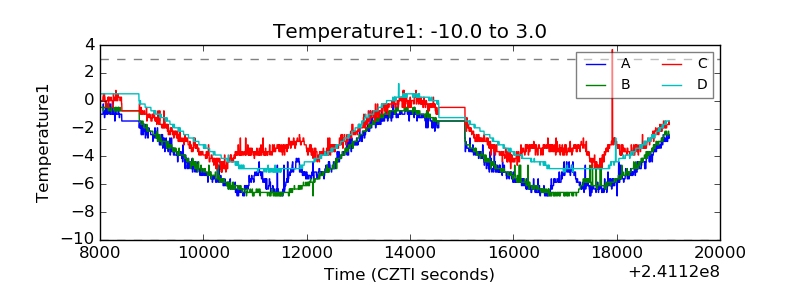 |
| Veto HV Monitor | 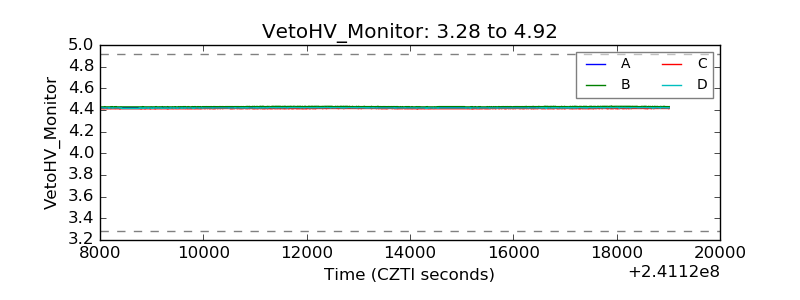 |
| Veto LLD | 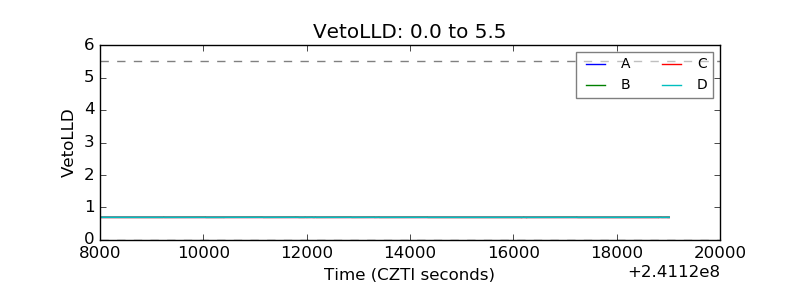 |
| Alpha Counter | 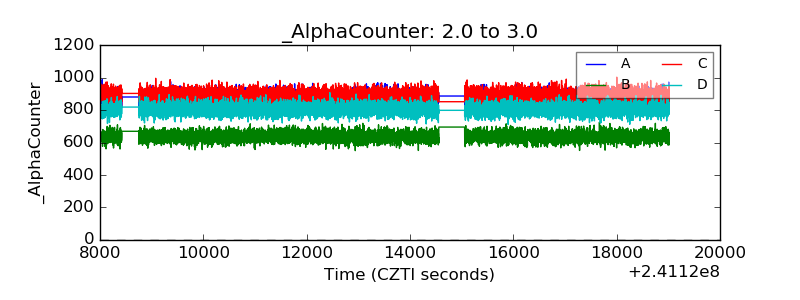 |
| _CPM_Rate | 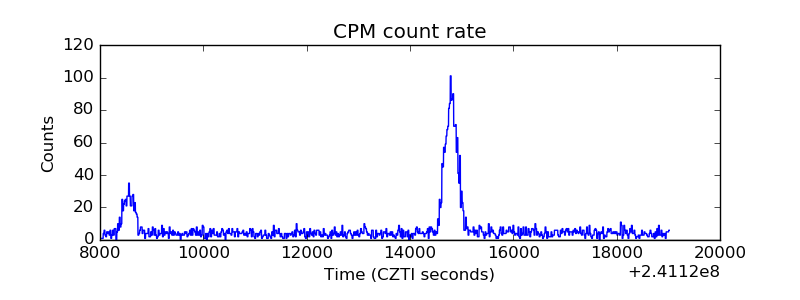 |
| CZT Counter | 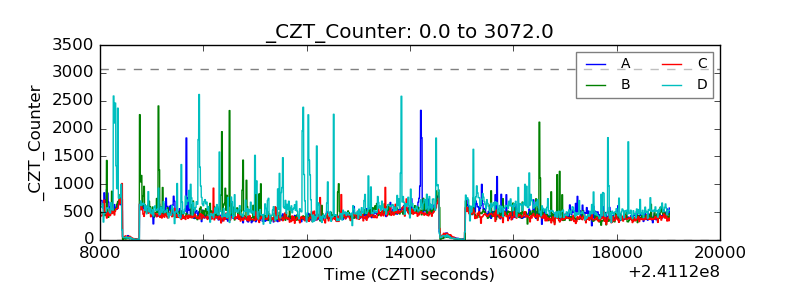 |
| +2.5 Volts monitor |  |
| +5 Volts monitor |  |
| _ROLL_ROT | 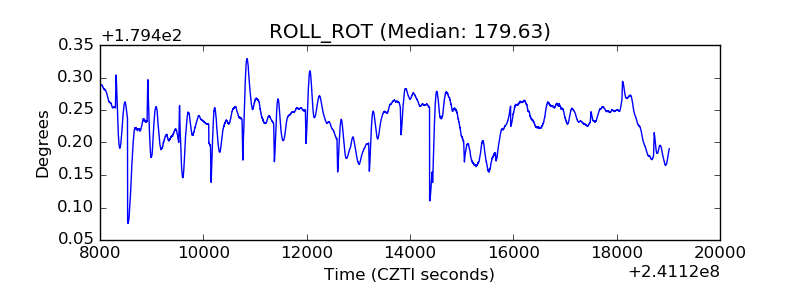 |
| _Roll_DEC | 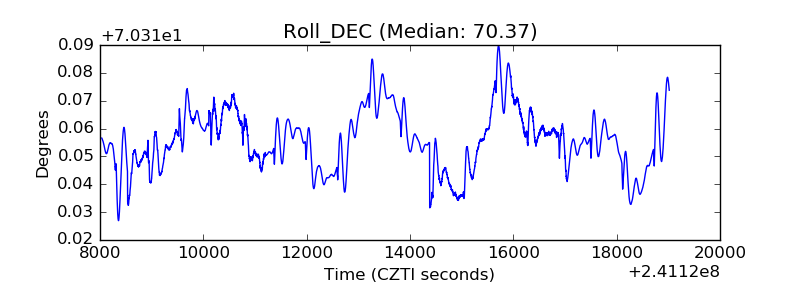 |
| _Roll_RA | 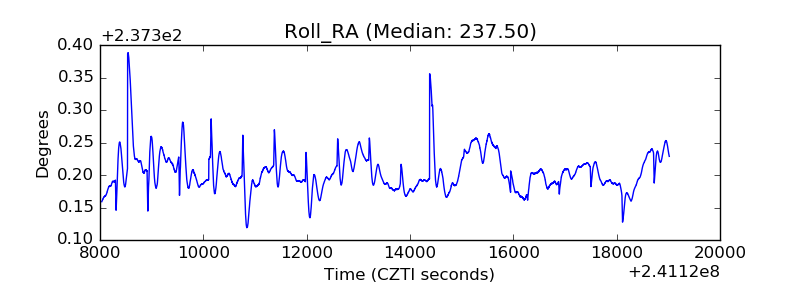 |
| Veto Counter | 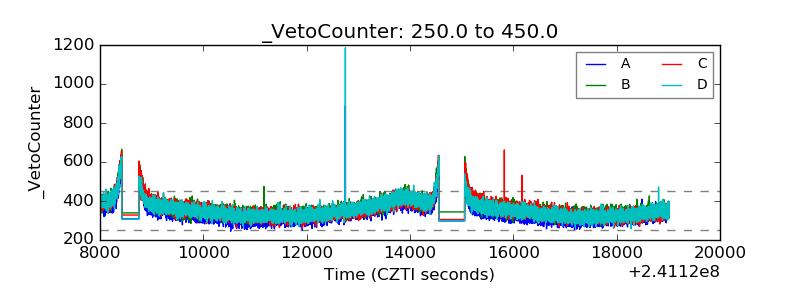 |