| Param | Original file | Final file |
|---|---|---|
| Filename | modeM0/AS1A03_072T01_9000001484cztM0_level2.fits | modeM0/AS1A03_072T01_9000001484cztM0_level2_quad_clean.evt |
| Size (bytes) | 720,714,240 | 713,465,280 |
| Size | 687.3 MB | 680.4 MB |
| Events in quadrant A | 4,380,594 | 4,350,583 |
| Events in quadrant B | 4,142,940 | 4,247,868 |
| Events in quadrant C | 4,312,764 | 4,102,863 |
| Events in quadrant D | 3,765,174 | 3,684,288 |
| Mode M0 | |||
|---|---|---|---|
| Quadrant | BADHDUFLAG | Total packets | Discarded packets |
| A | 0 | 161929 | 0 |
| B | 0 | 172151 | 0 |
| C | 0 | 163798 | 0 |
| D | 0 | 193358 | 0 |
| Mode SS | |||
|---|---|---|---|
| Quadrant | BADHDUFLAG | Total packets | Discarded packets |
| A | 0 | 1465 | 0 |
| B | 0 | 1463 | 0 |
| C | 0 | 1467 | 0 |
| D | 0 | 1466 | 0 |
| Mode M9 | |||
|---|---|---|---|
| Quadrant | BADHDUFLAG | Total packets | Discarded packets |
| A | 0 | 122 | 0 |
| B | 0 | 122 | 0 |
| C | 0 | 122 | 0 |
| D | 0 | 122 | 0 |
| Quadrant | Total seconds | Saturated seconds | Saturation percentage |
|---|---|---|---|
| A | 76275 | 1055 | 1.383153% |
| B | 75241 | 1355 | 1.800880% |
| C | 76776 | 878 | 1.143587% |
| D | 77661 | 2145 | 2.762004% |
Noise dominated data is calculated using 1-second bins in cleaned event files. If a bin has >2000 counts, and if more than 50% of those come from <1% of pixels, then it is considered to be noise-dominated and hence unusable.
| Quadrant | # 1 sec bins | Bins with >0 counts | Bins with >2000 counts | High rate bins dominated by noise | Noise dominated (total time) | Noise dominated (detector-on time) | Marked lightcurve |
|---|---|---|---|---|---|---|---|
| A | 93532 | 79468 | 0 | 0 | 0.00% | 0.00% |  |
| B | 93532 | 78627 | 0 | 0 | 0.00% | 0.00% |  |
| C | 93532 | 79941 | 0 | 0 | 0.00% | 0.00% |  |
| D | 93532 | 79018 | 0 | 0 | 0.00% | 0.00% | 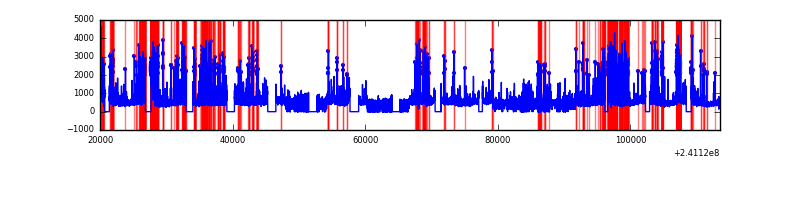 |
Top three noisy pixels from each quadrant. If the there are fewer than three noisy pixels in the level2.evt file, extra rows are filled as -1
| Pixel properties | Quadrant properties | ||||||
|---|---|---|---|---|---|---|---|
| Quadrant | DetID | PixID | Counts | Sigma | Mean | Median | Sigma |
| A | 0 | 29 | 4311 | 11.36 | 1140 | 1068 | 285.4 |
| A | 7 | 110 | 3601 | 8.88 | 1140 | 1068 | 285.4 |
| A | 0 | 30 | 3326 | 7.91 | 1140 | 1068 | 285.4 |
| B | 2 | 9 | 3528 | 11.61 | 1094 | 1044 | 214.0 |
| B | 14 | 254 | 2791 | 8.16 | 1094 | 1044 | 214.0 |
| B | 3 | 17 | 2753 | 7.99 | 1094 | 1044 | 214.0 |
| C | 1 | 80 | 3154 | 7.03 | 1139 | 1056 | 298.4 |
| C | 1 | 81 | 3101 | 6.85 | 1139 | 1056 | 298.4 |
| C | 12 | 241 | 2992 | 6.49 | 1139 | 1056 | 298.4 |
| D | 3 | 14 | 2812 | 6.31 | 1075 | 974 | 291.5 |
| D | 6 | 231 | 2769 | 6.16 | 1075 | 974 | 291.5 |
| D | 7 | 5 | 2683 | 5.86 | 1075 | 974 | 291.5 |
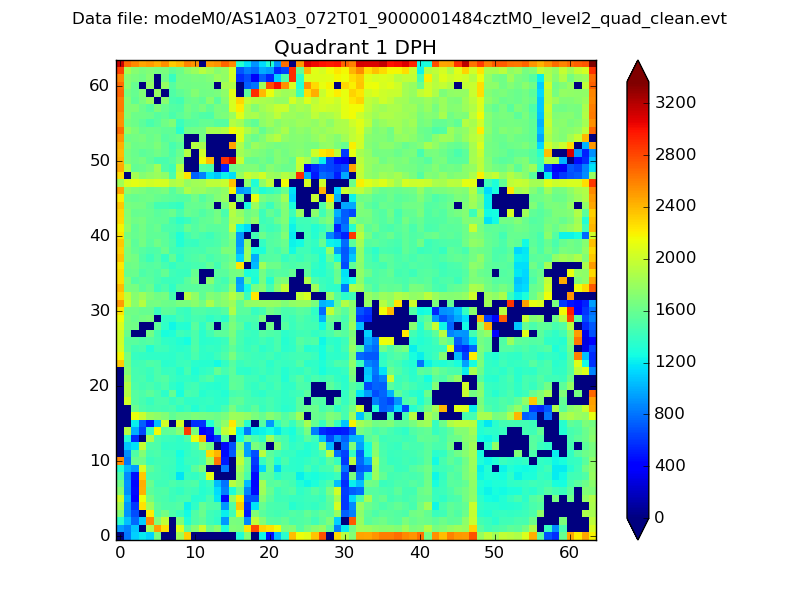
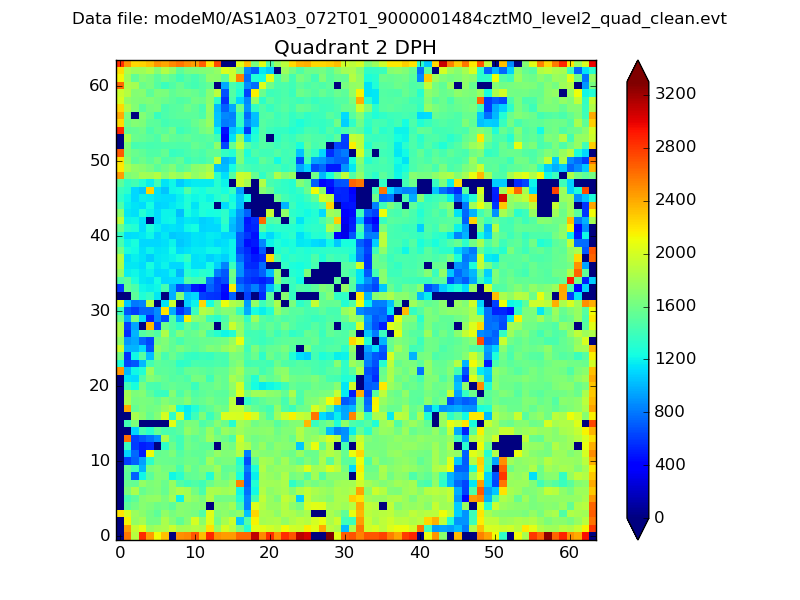
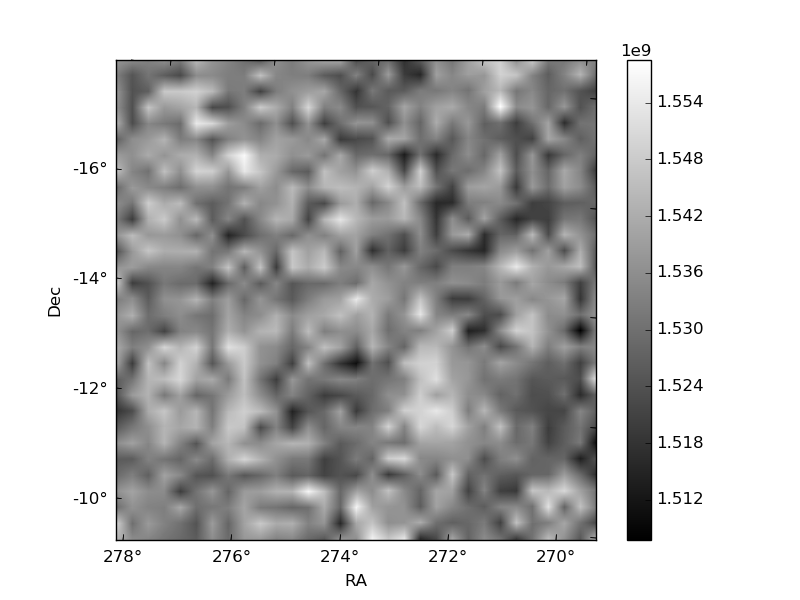
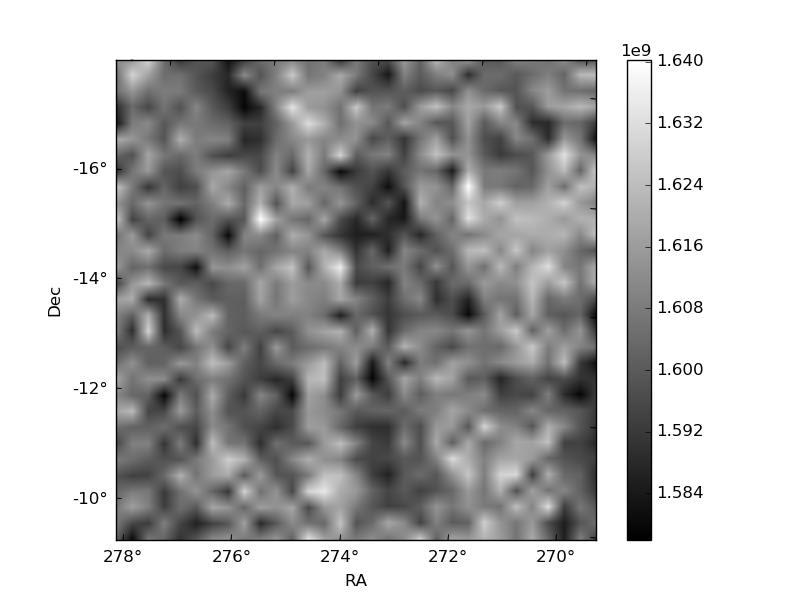
Histogram calculated using DETX and DETY for each event in the final _common_clean file
| Quadrant A |  |
 |
Quadrant B |
|---|---|---|---|
| Quadrant D | 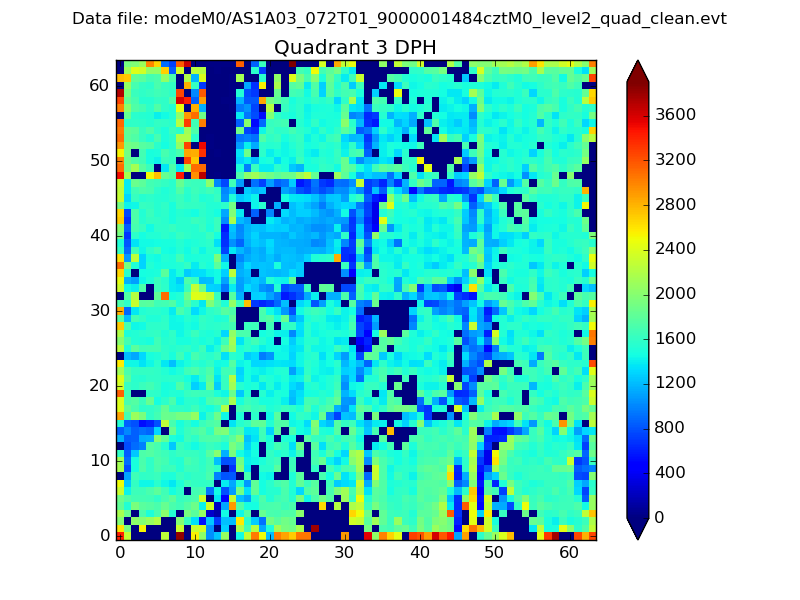 |
 |
Quadrant C |
| Plot type | Count rate plots | Images |
|---|---|---|
| Comparison with Poisson distribution Blue bars denote a histogram of data divided into 1 sec bins. Red curve is a Poisson curve with rate = median count rate of data. |
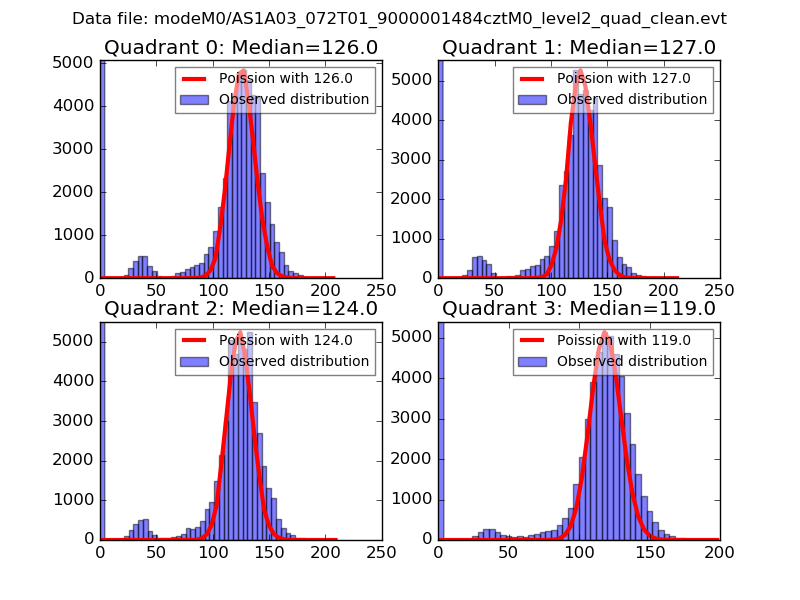 |
 |
| Quadrant-wise count rates Data is divided into 100 sec bins |
 |
|
| Module-wise count rates for Quadrant A Data is divided into 100 sec bins |
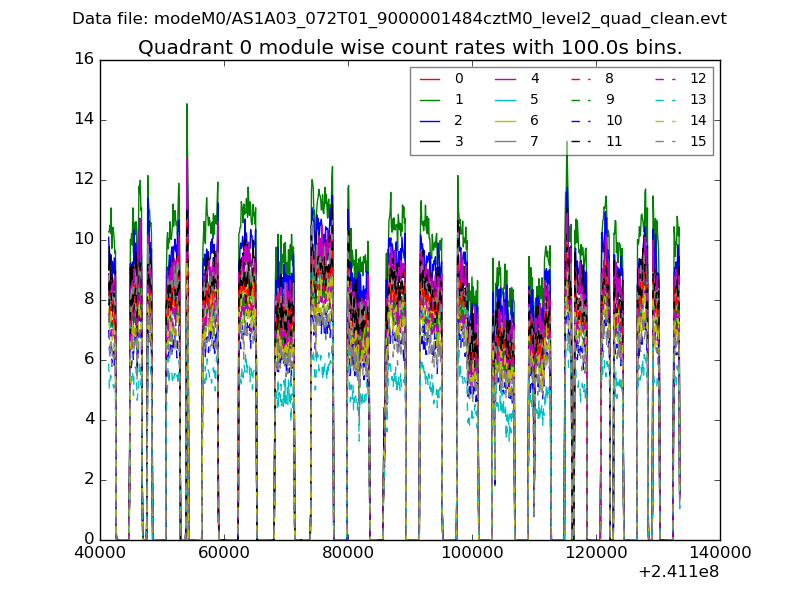 |
 |
| Module-wise count rates for Quadrant B Data is divided into 100 sec bins |
 |
 |
| Module-wise count rates for Quadrant C Data is divided into 100 sec bins |
 |
 |
| Module-wise count rates for Quadrant D Data is divided into 100 sec bins |
 |
 |
| Parameter | Plot |
|---|---|
| CZT HV Monitor |  |
| D_VDD | 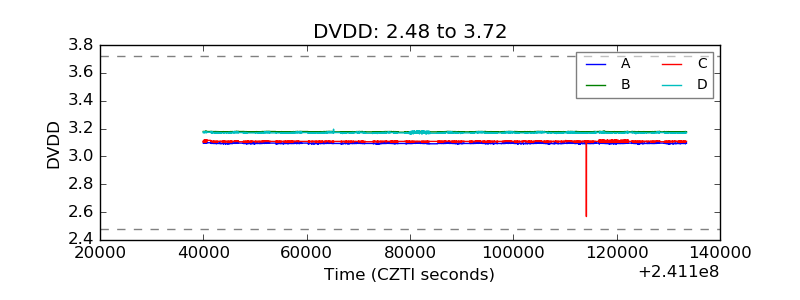 |
| Temperature 1 |  |
| Veto HV Monitor | 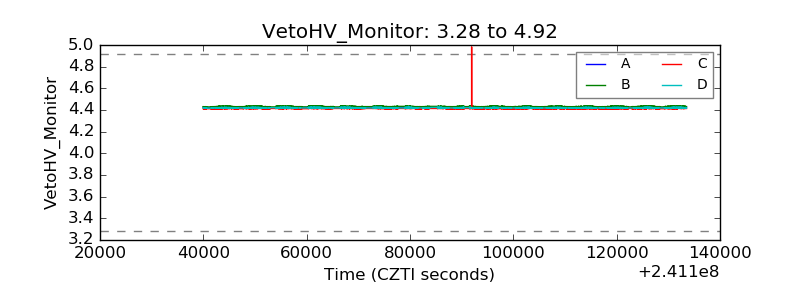 |
| Veto LLD |  |
| Alpha Counter |  |
| _CPM_Rate | 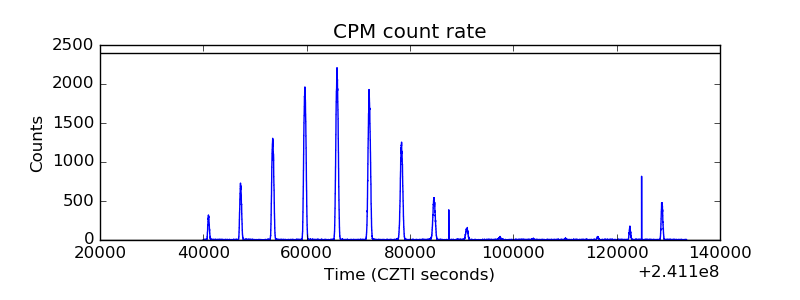 |
| CZT Counter |  |
| +2.5 Volts monitor | 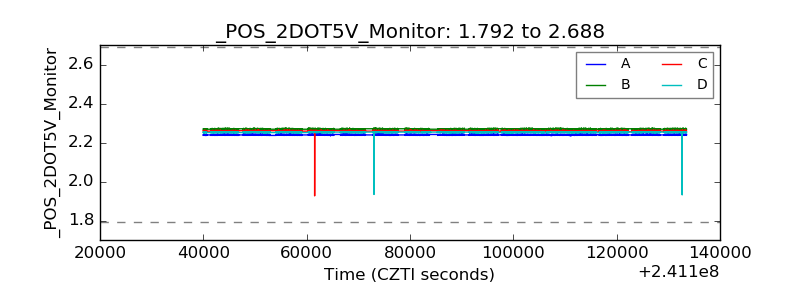 |
| +5 Volts monitor |  |
| _ROLL_ROT |  |
| _Roll_DEC |  |
| _Roll_RA | 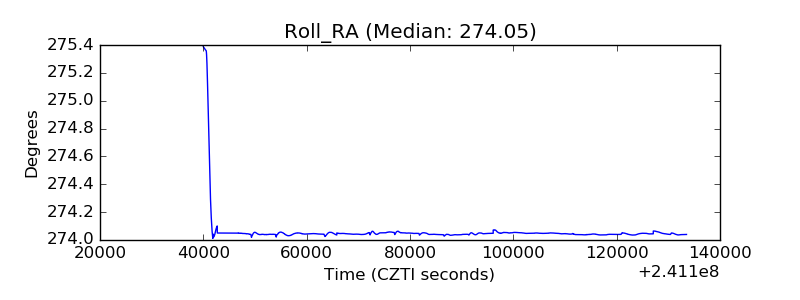 |
| Veto Counter |  |