| Param | Original file | Final file |
|---|---|---|
| Filename | modeM0/AS1A03_072T01_9000001484_10284cztM0_level2.evt | modeM0/AS1A03_072T01_9000001484_10284cztM0_level2_quad_clean.evt |
| Size (bytes) | 173,491,200 | 34,384,320 |
| Size | 165.5 MB | 32.8 MB |
| Events in quadrant A | 1,129,451 | 224,527 |
| Events in quadrant B | 1,289,829 | 226,623 |
| Events in quadrant C | 1,007,163 | 221,234 |
| Events in quadrant D | 1,675,742 | 209,110 |
| Mode M0 | |||
|---|---|---|---|
| Quadrant | BADHDUFLAG | Total packets | Discarded packets |
| A | 0 | 4759 | 2 |
| B | 0 | 5281 | 1 |
| C | 0 | 4512 | 1 |
| D | 0 | 6441 | 1 |
| Mode SS | |||
|---|---|---|---|
| Quadrant | BADHDUFLAG | Total packets | Discarded packets |
| A | 0 | 46 | 0 |
| B | 0 | 46 | 0 |
| C | 0 | 46 | 0 |
| D | 0 | 46 | 0 |
| Mode M9 | |||
|---|---|---|---|
| Quadrant | BADHDUFLAG | Total packets | Discarded packets |
| A | 0 | 8 | 0 |
| B | 0 | 8 | 0 |
| C | 0 | 8 | 0 |
| D | 0 | 8 | 0 |
| Quadrant | Total seconds | Saturated seconds | Saturation percentage |
|---|---|---|---|
| A | 2204 | 7 | 0.317604% |
| B | 2204 | 38 | 1.724138% |
| C | 2204 | 4 | 0.181488% |
| D | 2204 | 49 | 2.223230% |
Noise dominated data is calculated using 1-second bins in cleaned event files. If a bin has >2000 counts, and if more than 50% of those come from <1% of pixels, then it is considered to be noise-dominated and hence unusable.
| Quadrant | # 1 sec bins | Bins with >0 counts | Bins with >2000 counts | High rate bins dominated by noise | Noise dominated (total time) | Noise dominated (detector-on time) | Marked lightcurve |
|---|---|---|---|---|---|---|---|
| A | 2919 | 2205 | 2 | 2 | 0.07% | 0.09% |  |
| B | 2919 | 2205 | 25 | 25 | 0.86% | 1.13% | 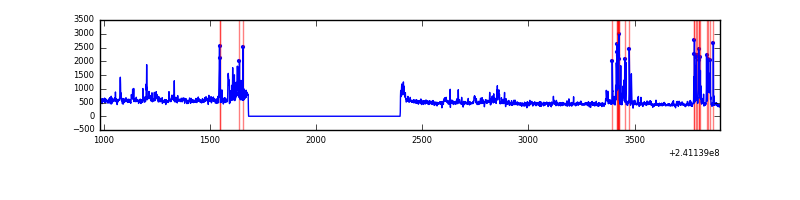 |
| C | 2919 | 2205 | 2 | 2 | 0.07% | 0.09% | 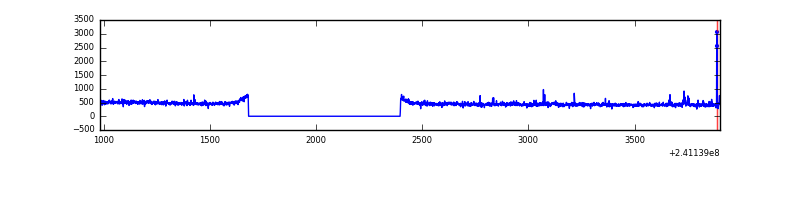 |
| D | 2919 | 2205 | 34 | 34 | 1.16% | 1.54% | 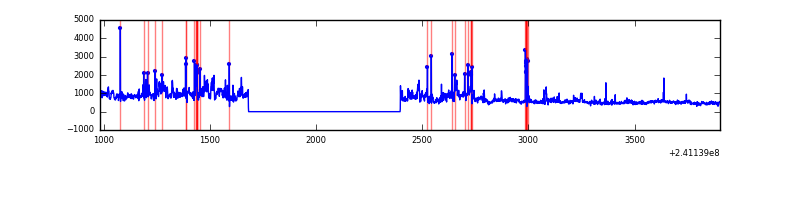 |
Top three noisy pixels from each quadrant. If the there are fewer than three noisy pixels in the level2.evt file, extra rows are filled as -1
| Pixel properties | Quadrant properties | ||||||
|---|---|---|---|---|---|---|---|
| Quadrant | DetID | PixID | Counts | Sigma | Mean | Median | Sigma |
| A | 8 | 15 | 37205 | 663.37 | 263 | 257 | 55.7 |
| A | 5 | 16 | 34604 | 616.67 | 263 | 257 | 55.7 |
| A | 3 | 1 | 25322 | 450.02 | 263 | 257 | 55.7 |
| B | 4 | 239 | 111949 | 2097.99 | 265 | 258 | 53.2 |
| B | 0 | 168 | 37458 | 698.76 | 265 | 258 | 53.2 |
| B | 10 | 245 | 29790 | 554.72 | 265 | 258 | 53.2 |
| C | 4 | 254 | 13896 | 224.97 | 252 | 254 | 60.6 |
| C | 12 | 4 | 4045 | 62.52 | 252 | 254 | 60.6 |
| C | 13 | 61 | 1946 | 27.9 | 252 | 254 | 60.6 |
| D | 2 | 16 | 324968 | 5161.0 | 251 | 243 | 62.9 |
| D | 8 | 195 | 176519 | 2801.63 | 251 | 243 | 62.9 |
| D | 7 | 71 | 113175 | 1794.88 | 251 | 243 | 62.9 |
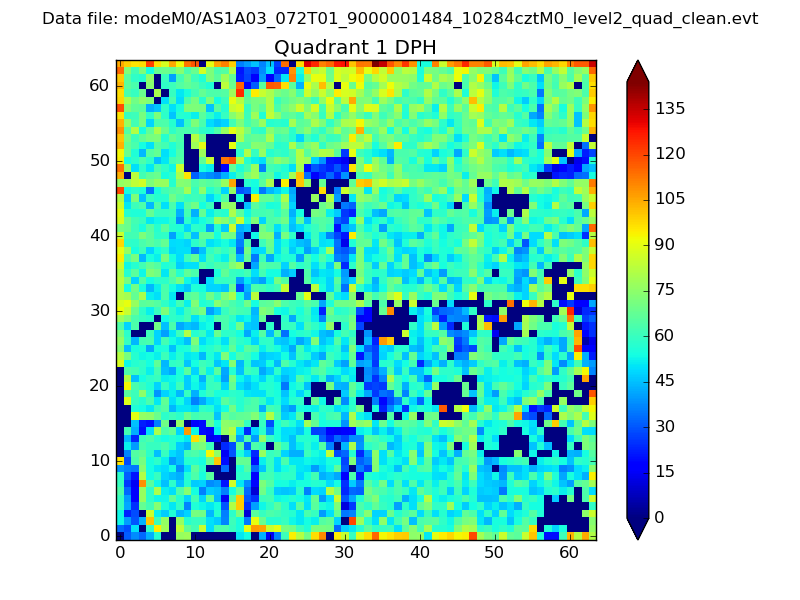
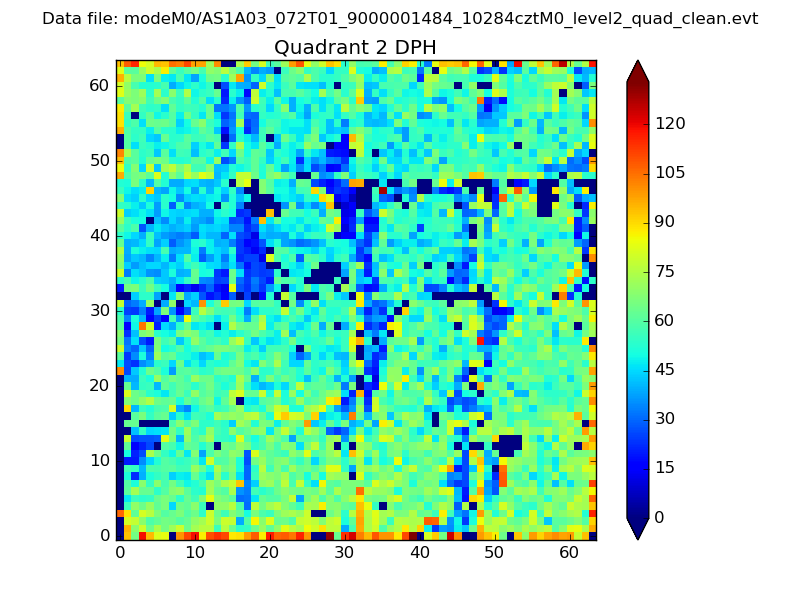
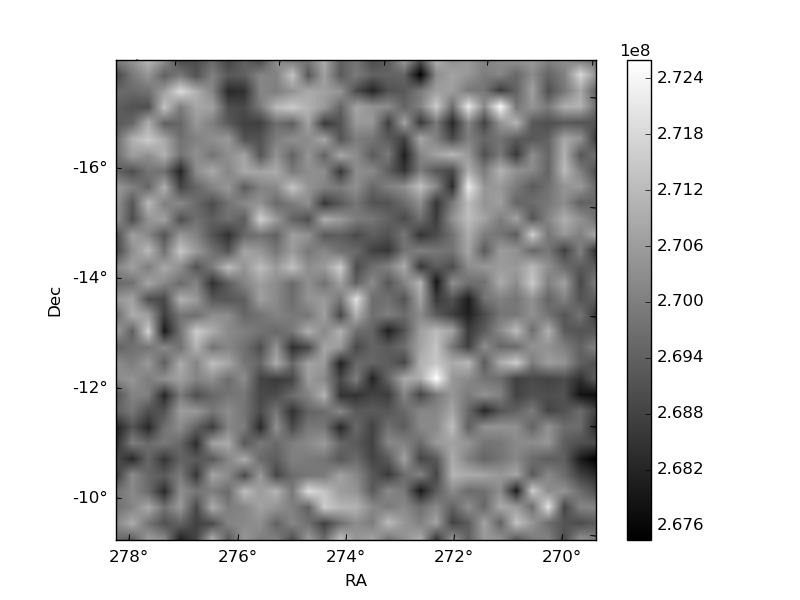
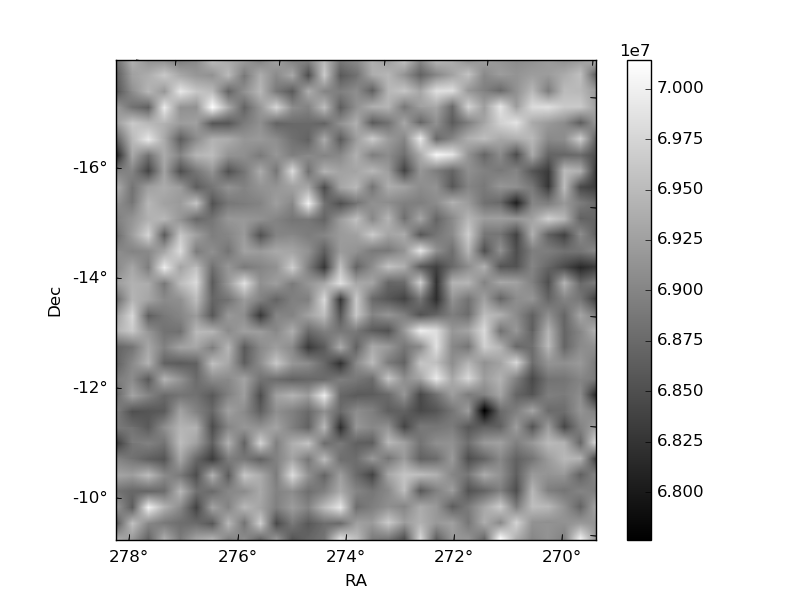
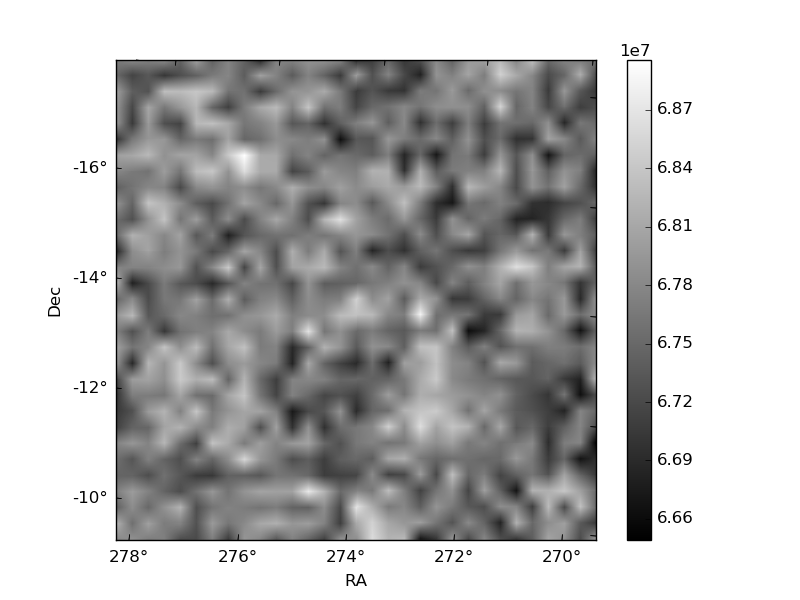
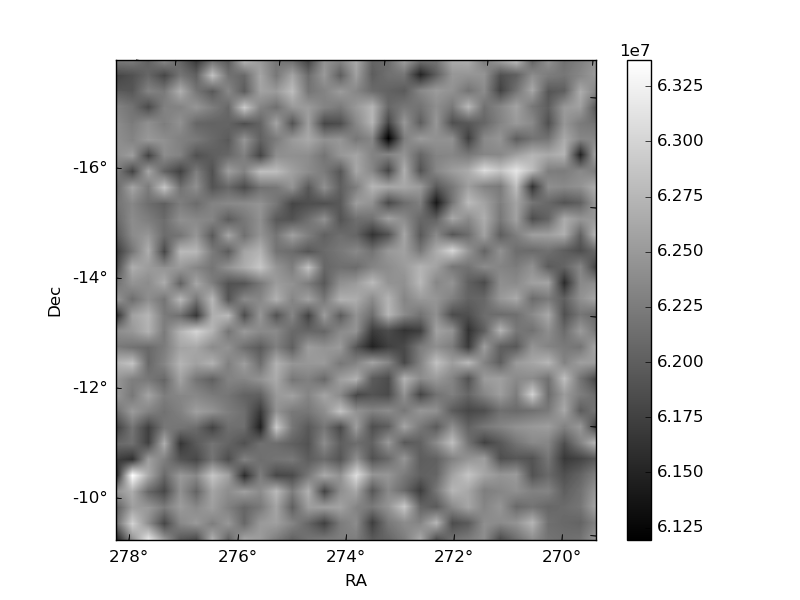
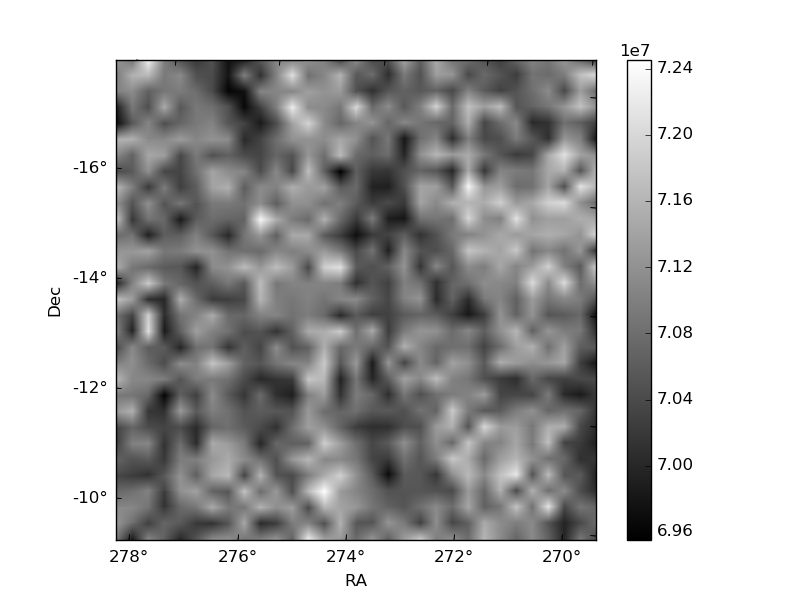
Histogram calculated using DETX and DETY for each event in the final _common_clean file
| Quadrant A | 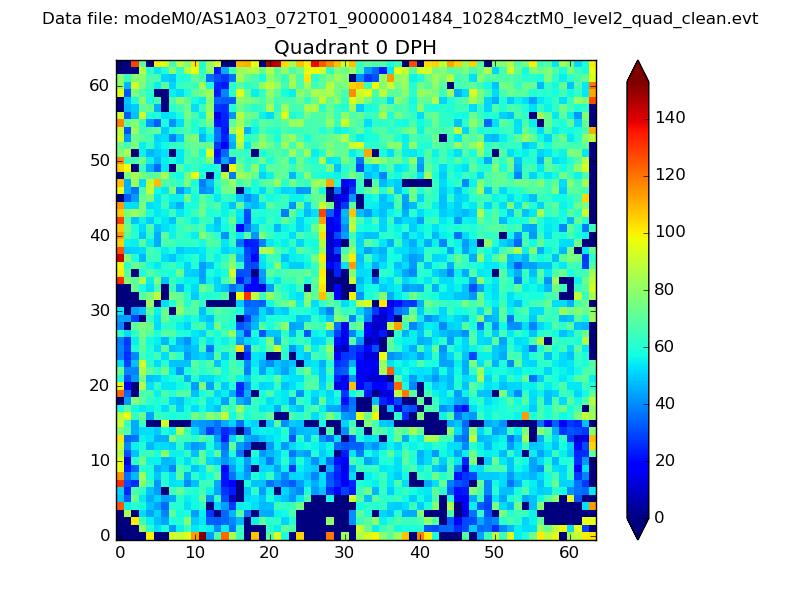 |
 |
Quadrant B |
|---|---|---|---|
| Quadrant D | 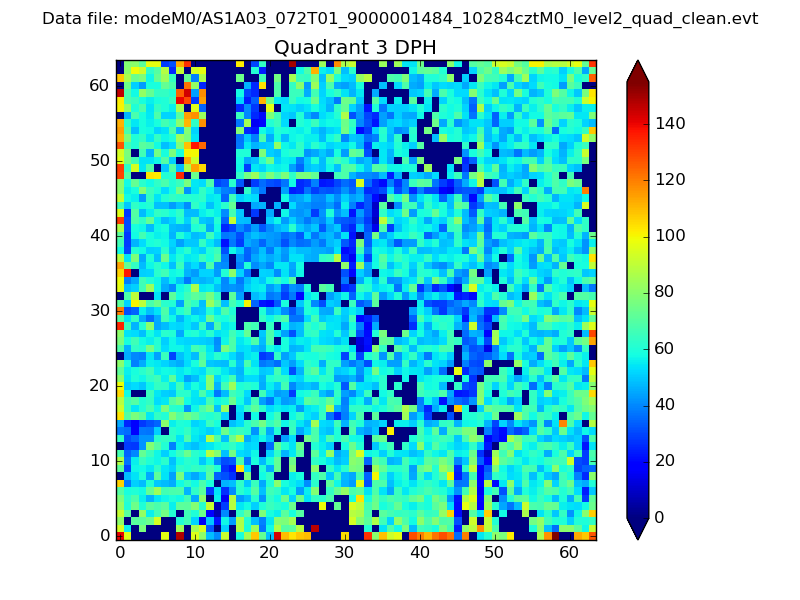 |
 |
Quadrant C |
| Plot type | Count rate plots | Images |
|---|---|---|
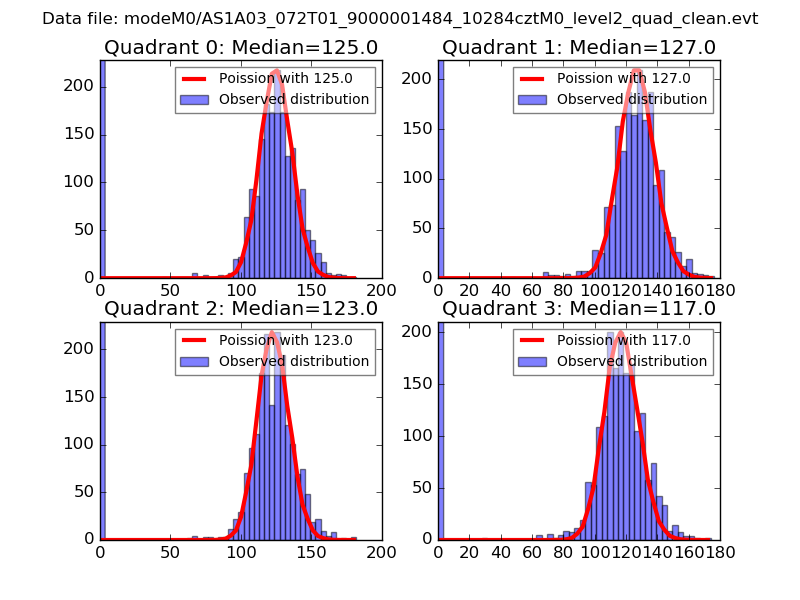
| Comparison with Poisson distribution Blue bars denote a histogram of data divided into 1 sec bins. Red curve is a Poisson curve with rate = median count rate of data. |
 |
 |
| Quadrant-wise count rates Data is divided into 100 sec bins |
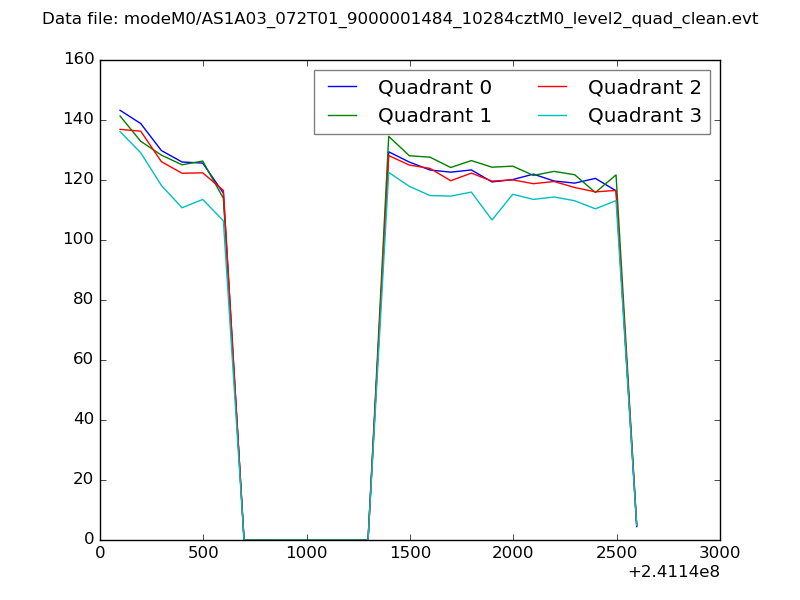 |
|
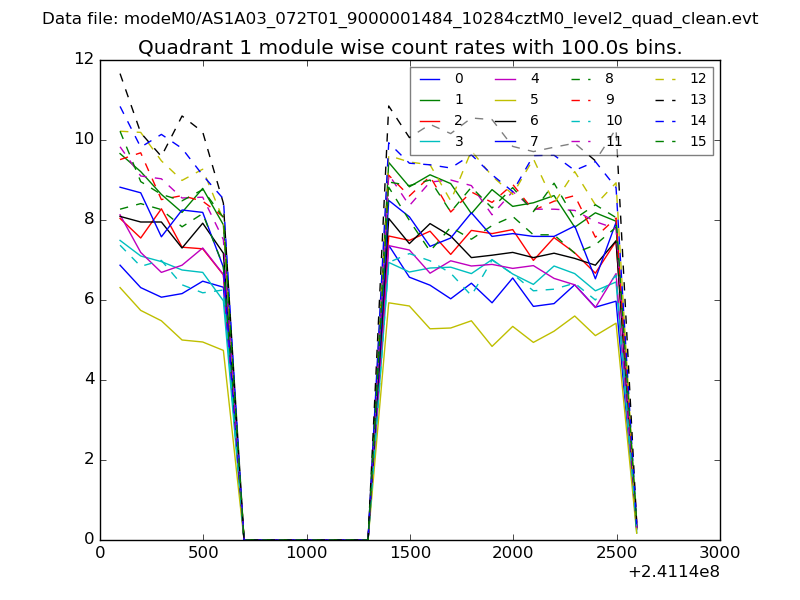
| Module-wise count rates for Quadrant A Data is divided into 100 sec bins |
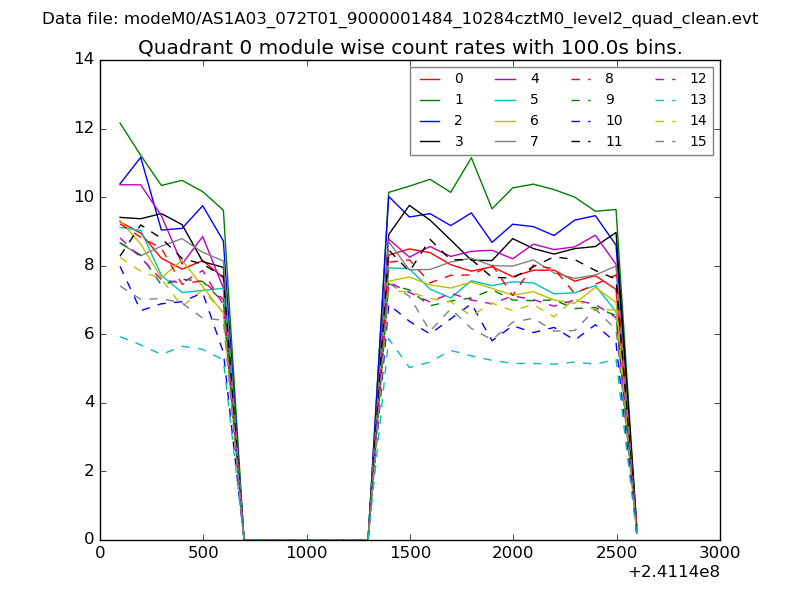 |
 |
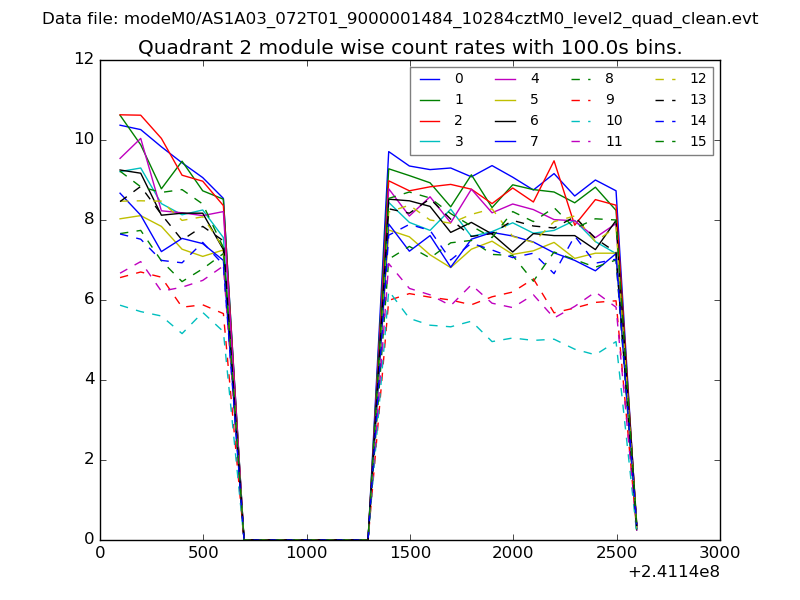
| Module-wise count rates for Quadrant B Data is divided into 100 sec bins |
 |
 |
| Module-wise count rates for Quadrant C Data is divided into 100 sec bins |
 |
 |
| Module-wise count rates for Quadrant D Data is divided into 100 sec bins |
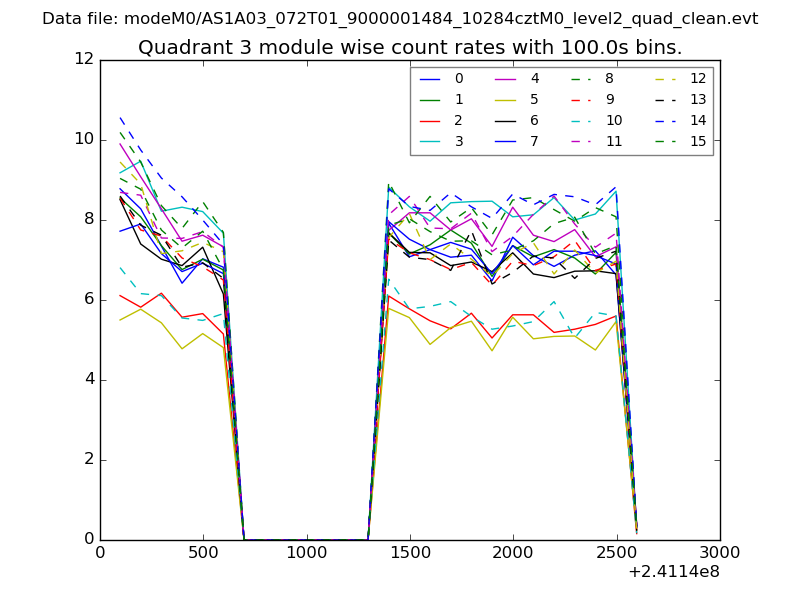 |
 |
| Parameter | Plot |
|---|---|
| CZT HV Monitor | 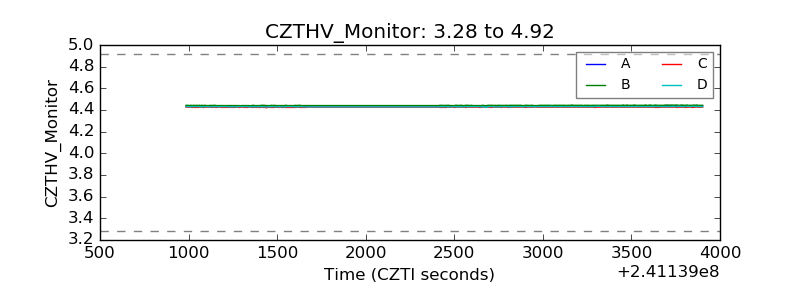 |
| D_VDD | 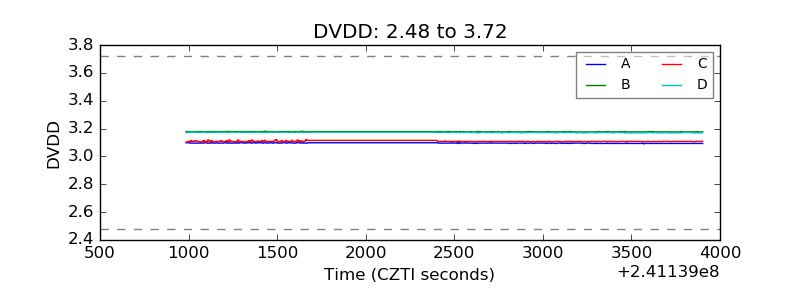 |
| Temperature 1 | 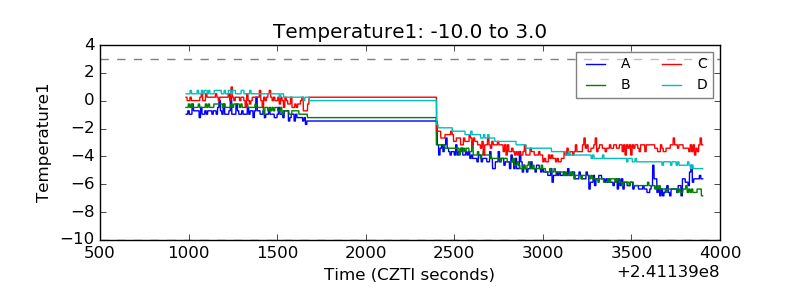 |
| Veto HV Monitor |  |
| Veto LLD | 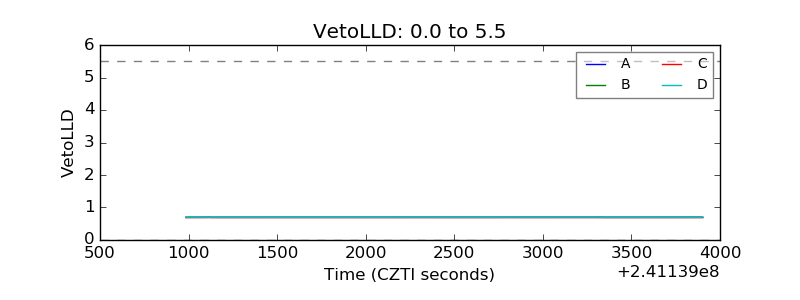 |
| Alpha Counter | 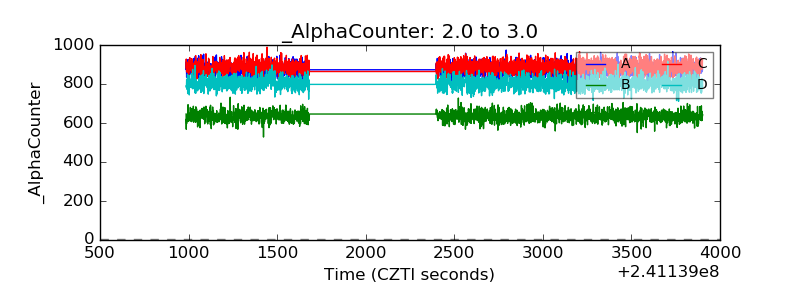 |
| _CPM_Rate |  |
| CZT Counter | 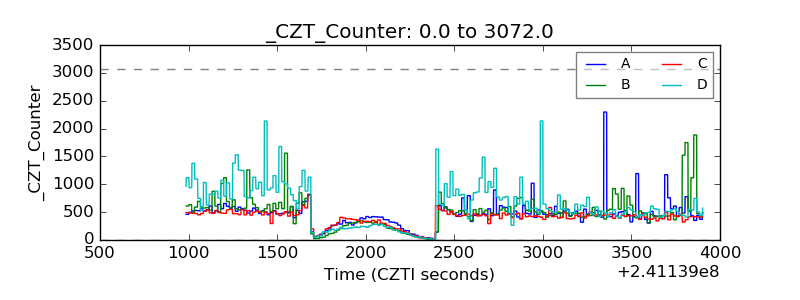 |
| +2.5 Volts monitor |  |
| +5 Volts monitor |  |
| _ROLL_ROT | 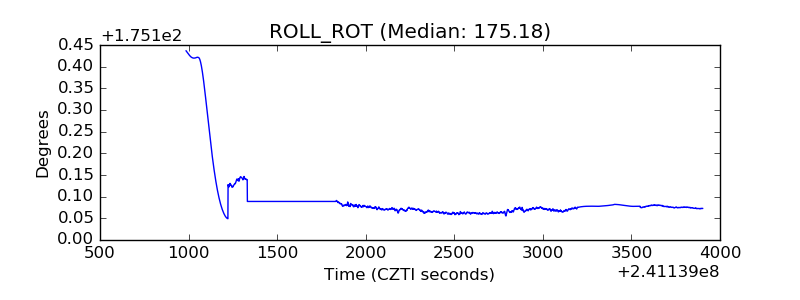 |
| _Roll_DEC | 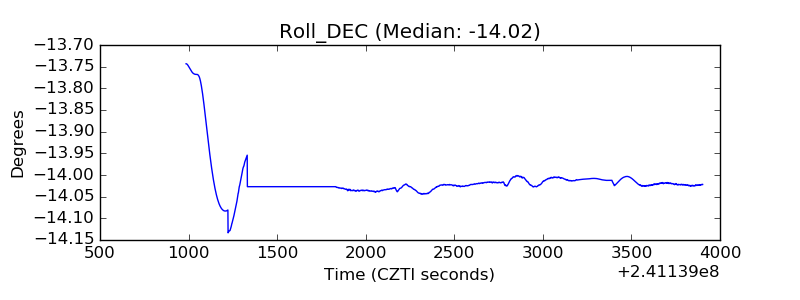 |
| _Roll_RA | 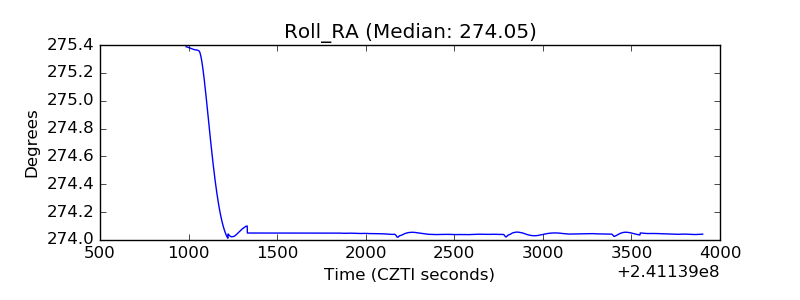 |
| Veto Counter | 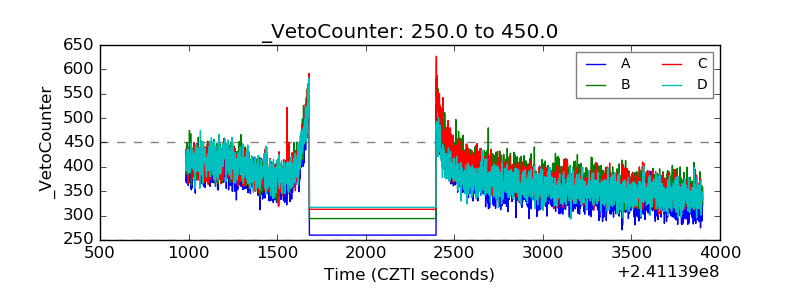 |