| Param | Original file | Final file |
|---|---|---|
| Filename | modeM0/AS1A03_072T01_9000001484_10285cztM0_level2.evt | modeM0/AS1A03_072T01_9000001484_10285cztM0_level2_quad_clean.evt |
| Size (bytes) | 513,682,560 | 72,532,800 |
| Size | 489.9 MB | 69.2 MB |
| Events in quadrant A | 3,565,686 | 443,656 |
| Events in quadrant B | 3,437,393 | 453,734 |
| Events in quadrant C | 3,176,147 | 444,136 |
| Events in quadrant D | 4,937,773 | 402,277 |
| Mode M0 | |||
|---|---|---|---|
| Quadrant | BADHDUFLAG | Total packets | Discarded packets |
| A | 0 | 14890 | 2 |
| B | 0 | 14424 | 1 |
| C | 0 | 13989 | 1 |
| D | 0 | 18860 | 1 |
| Mode SS | |||
|---|---|---|---|
| Quadrant | BADHDUFLAG | Total packets | Discarded packets |
| A | 0 | 132 | 0 |
| B | 0 | 132 | 0 |
| C | 0 | 132 | 0 |
| D | 0 | 132 | 0 |
| Mode M9 | |||
|---|---|---|---|
| Quadrant | BADHDUFLAG | Total packets | Discarded packets |
| A | 0 | 8 | 0 |
| B | 0 | 8 | 0 |
| C | 0 | 8 | 0 |
| D | 0 | 8 | 0 |
| Quadrant | Total seconds | Saturated seconds | Saturation percentage |
|---|---|---|---|
| A | 6481 | 160 | 2.468755% |
| B | 6481 | 85 | 1.311526% |
| C | 6481 | 69 | 1.064651% |
| D | 6481 | 484 | 7.467983% |
Noise dominated data is calculated using 1-second bins in cleaned event files. If a bin has >2000 counts, and if more than 50% of those come from <1% of pixels, then it is considered to be noise-dominated and hence unusable.
| Quadrant | # 1 sec bins | Bins with >0 counts | Bins with >2000 counts | High rate bins dominated by noise | Noise dominated (total time) | Noise dominated (detector-on time) | Marked lightcurve |
|---|---|---|---|---|---|---|---|
| A | 7341 | 6482 | 115 | 115 | 1.57% | 1.77% | 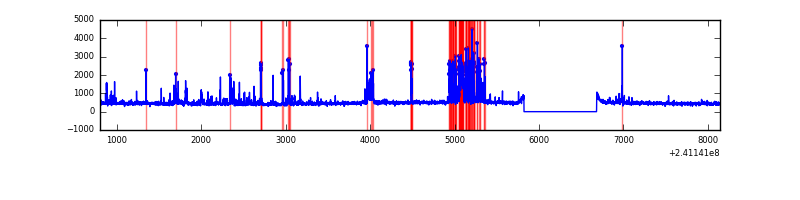 |
| B | 7341 | 6482 | 48 | 48 | 0.65% | 0.74% | 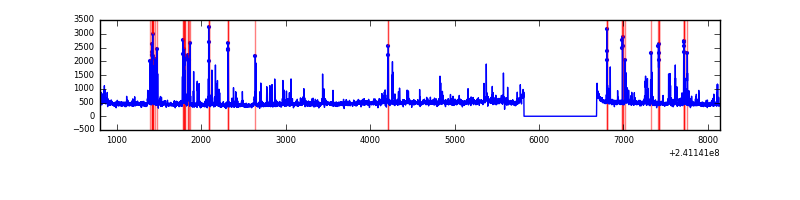 |
| C | 7341 | 6482 | 50 | 50 | 0.68% | 0.77% | 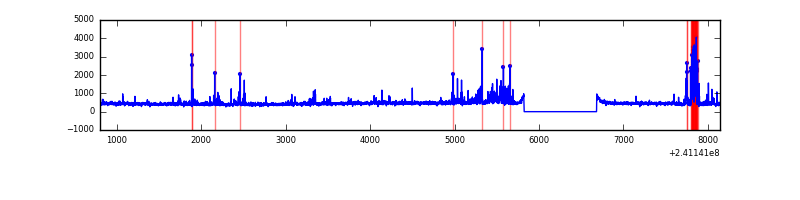 |
| D | 7341 | 6482 | 466 | 466 | 6.35% | 7.19% |  |
Top three noisy pixels from each quadrant. If the there are fewer than three noisy pixels in the level2.evt file, extra rows are filled as -1
| Pixel properties | Quadrant properties | ||||||
|---|---|---|---|---|---|---|---|
| Quadrant | DetID | PixID | Counts | Sigma | Mean | Median | Sigma |
| A | 5 | 16 | 554024 | 3612.35 | 743 | 727 | 153.2 |
| A | 8 | 5 | 74696 | 482.93 | 743 | 727 | 153.2 |
| A | 8 | 15 | 46035 | 295.81 | 743 | 727 | 153.2 |
| B | 4 | 239 | 413036 | 2837.67 | 753 | 734 | 145.3 |
| B | 10 | 245 | 33516 | 225.62 | 753 | 734 | 145.3 |
| B | 11 | 51 | 24638 | 164.52 | 753 | 734 | 145.3 |
| C | 4 | 254 | 357472 | 2116.97 | 720 | 724 | 168.5 |
| C | 13 | 61 | 5310 | 27.21 | 720 | 724 | 168.5 |
| C | 12 | 4 | 5280 | 27.04 | 720 | 724 | 168.5 |
| D | 2 | 16 | 683917 | 3696.33 | 695 | 679 | 184.8 |
| D | 13 | 104 | 575544 | 3110.03 | 695 | 679 | 184.8 |
| D | 12 | 233 | 431117 | 2328.67 | 695 | 679 | 184.8 |
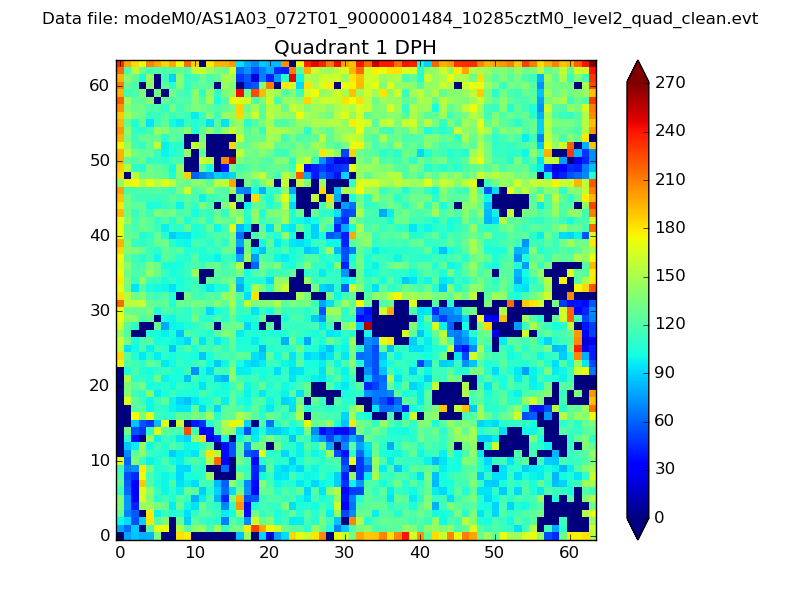
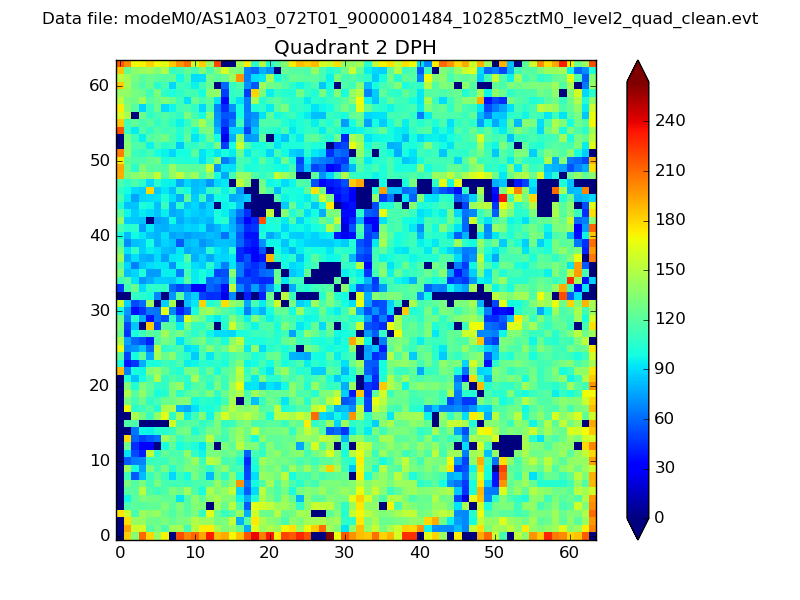
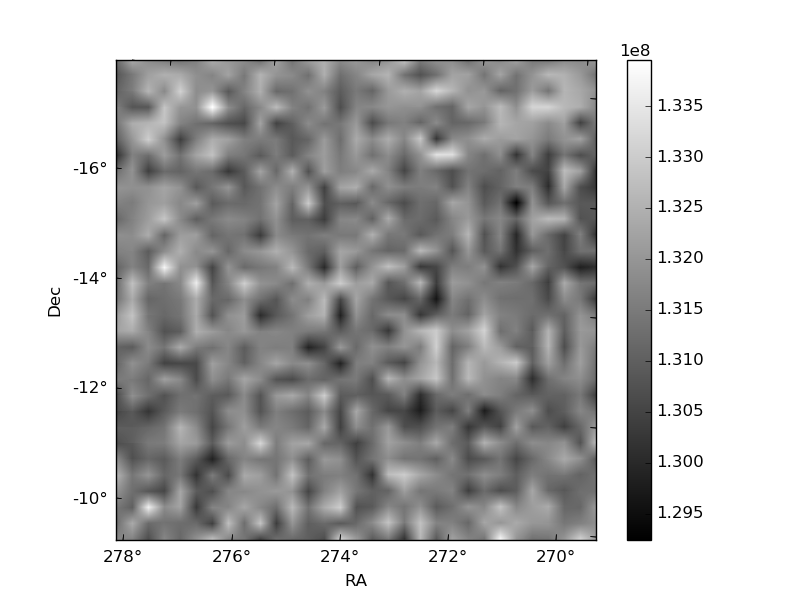
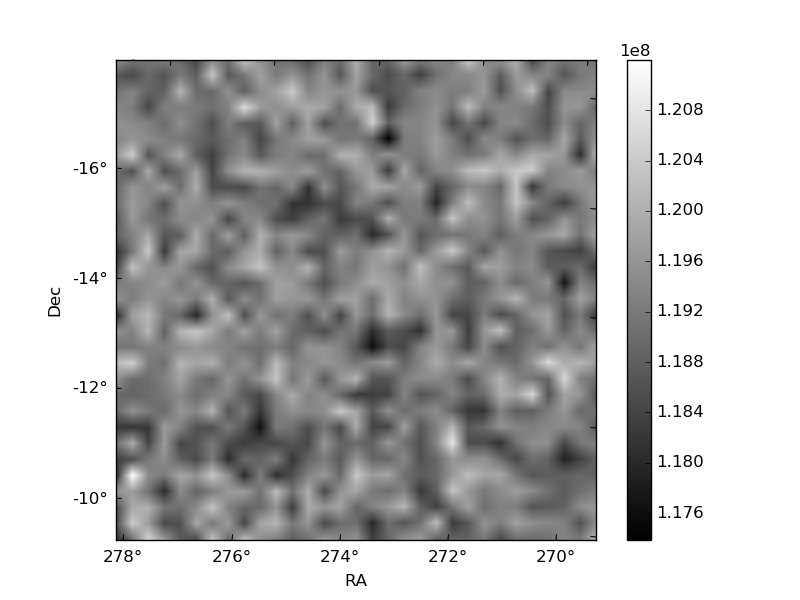
Histogram calculated using DETX and DETY for each event in the final _common_clean file
| Quadrant A | 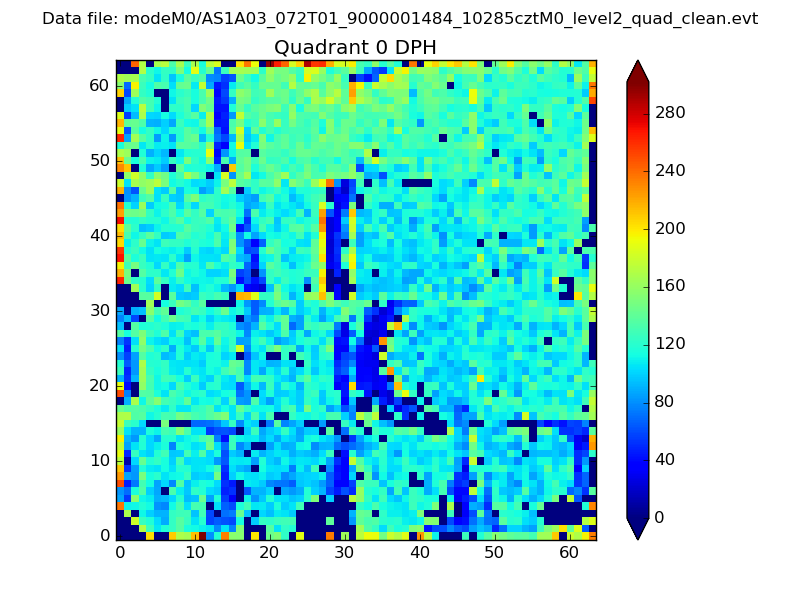 |
 |
Quadrant B |
|---|---|---|---|
| Quadrant D | 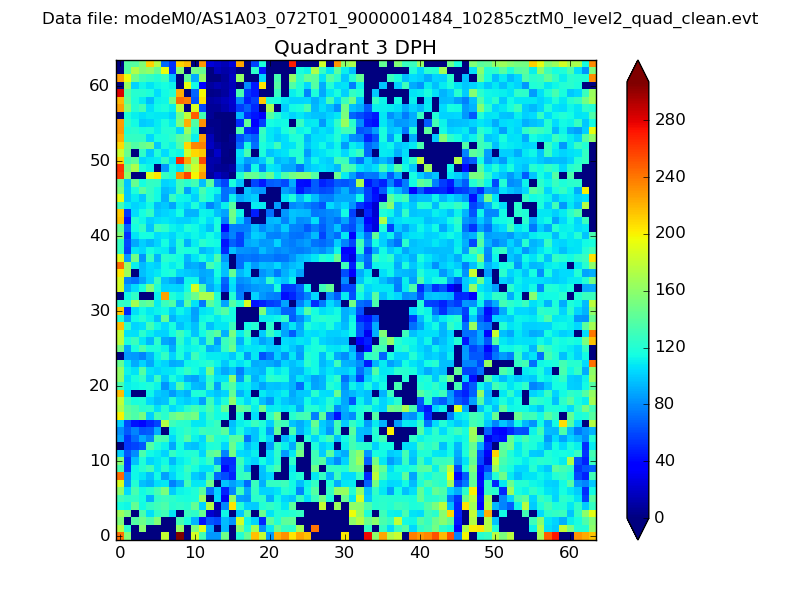 |
 |
Quadrant C |
| Plot type | Count rate plots | Images |
|---|---|---|
| Comparison with Poisson distribution Blue bars denote a histogram of data divided into 1 sec bins. Red curve is a Poisson curve with rate = median count rate of data. |
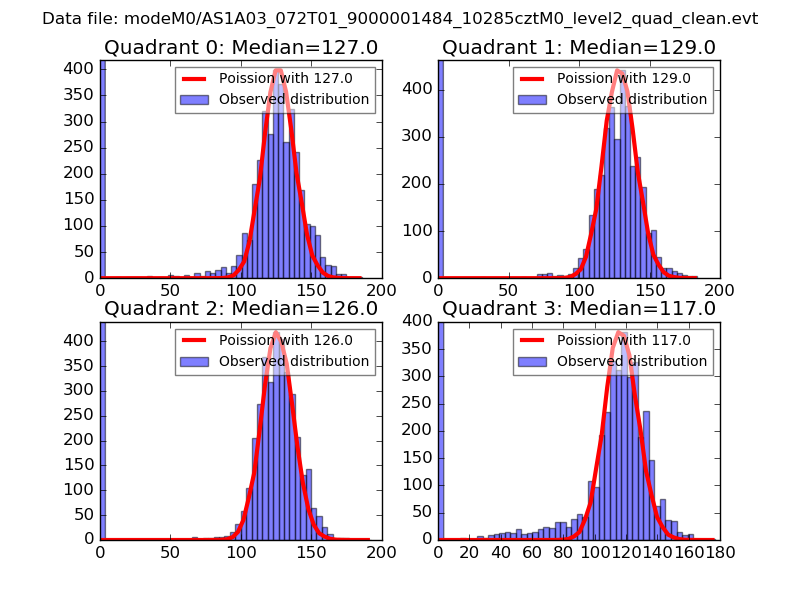 |
 |
| Quadrant-wise count rates Data is divided into 100 sec bins |
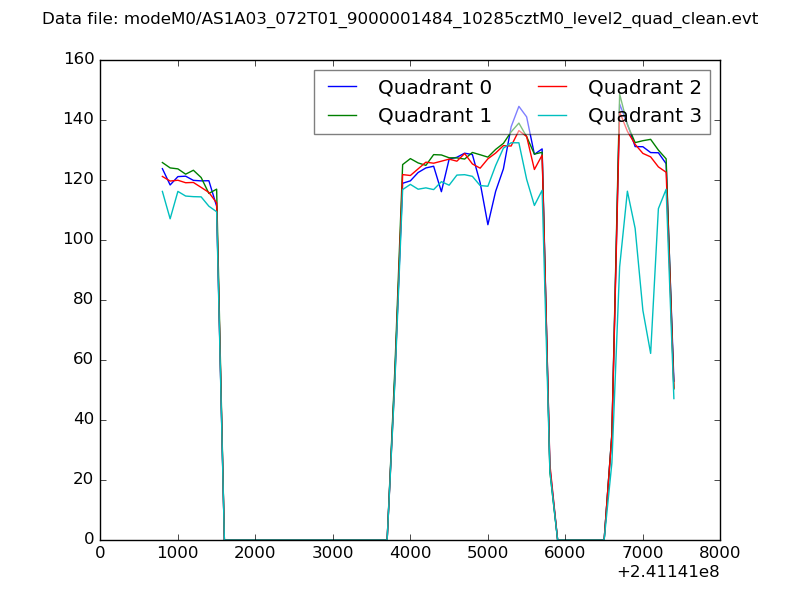 |
|
| Module-wise count rates for Quadrant A Data is divided into 100 sec bins |
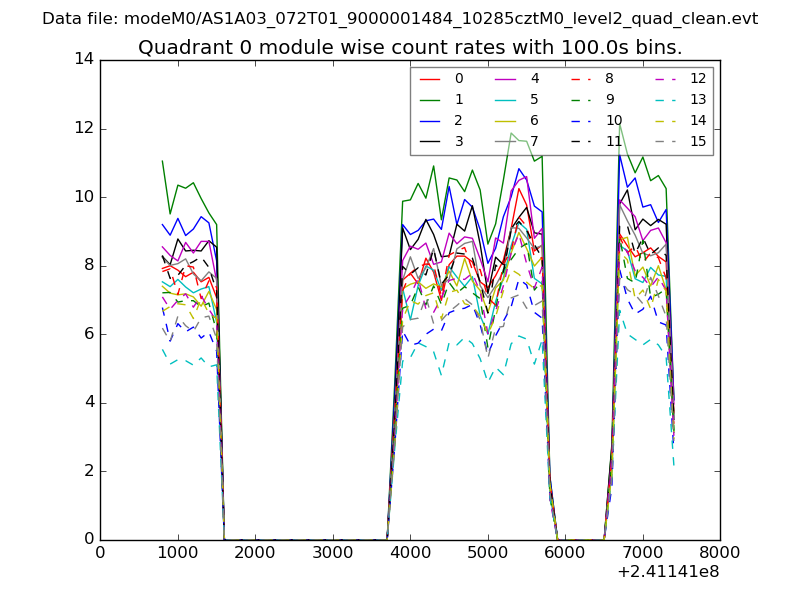 |
 |
| Module-wise count rates for Quadrant B Data is divided into 100 sec bins |
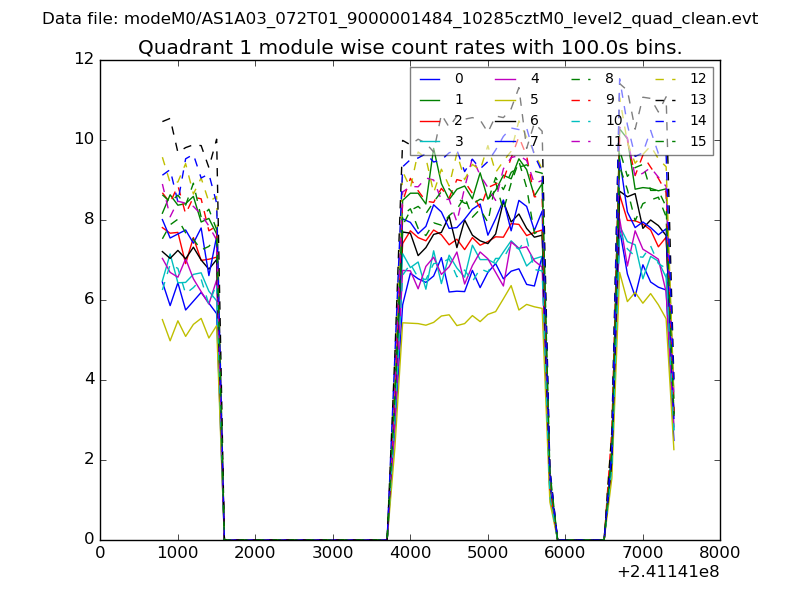 |
 |
| Module-wise count rates for Quadrant C Data is divided into 100 sec bins |
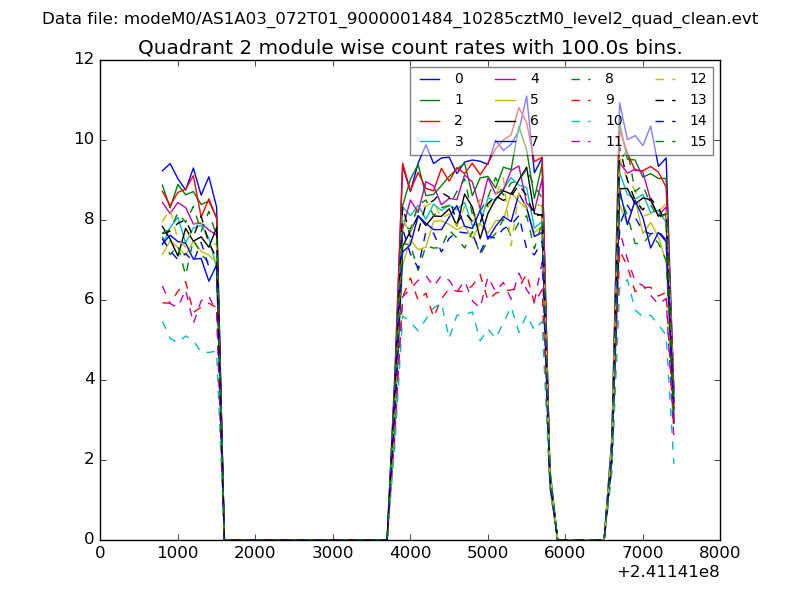 |
 |
| Module-wise count rates for Quadrant D Data is divided into 100 sec bins |
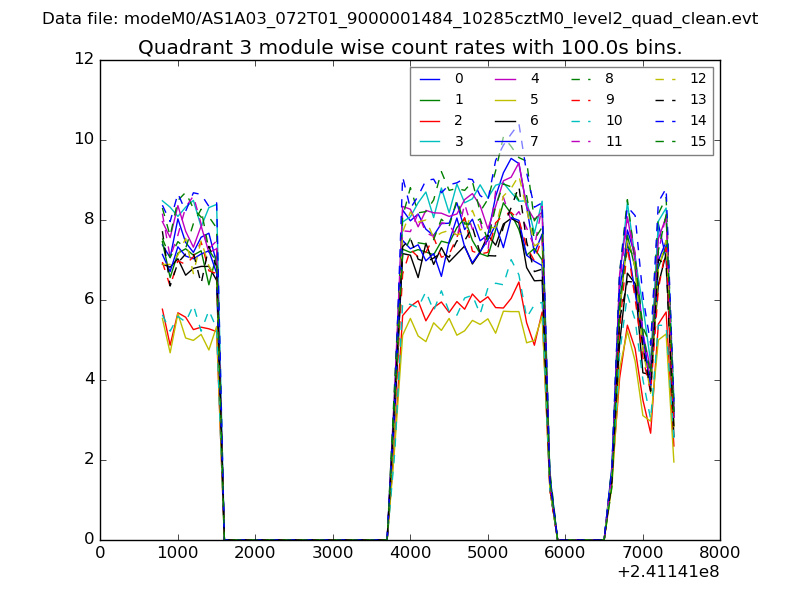 |
 |
| Parameter | Plot |
|---|---|
| CZT HV Monitor | 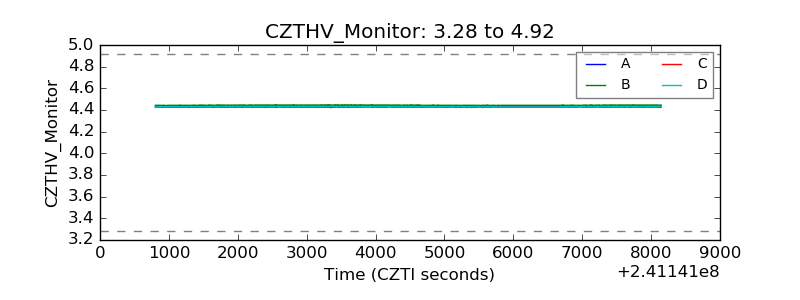 |
| D_VDD |  |
| Temperature 1 | 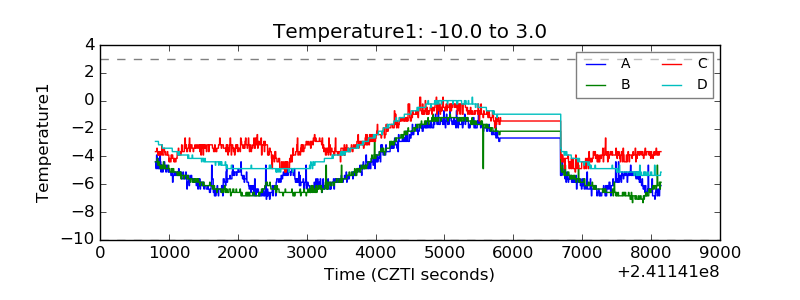 |
| Veto HV Monitor | 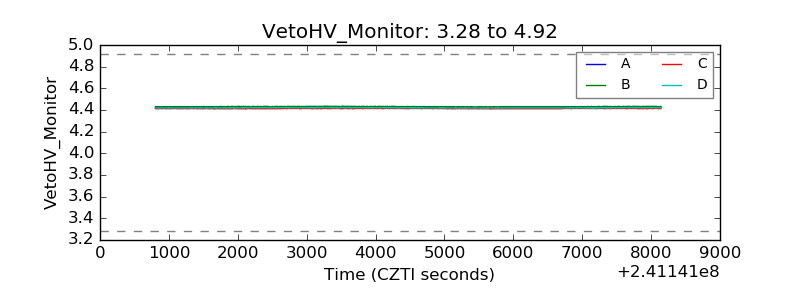 |
| Veto LLD | 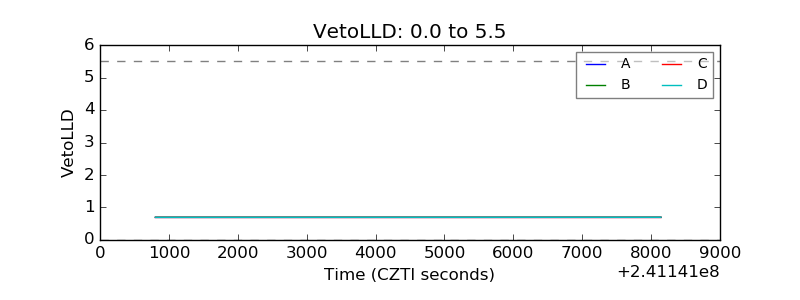 |
| Alpha Counter | 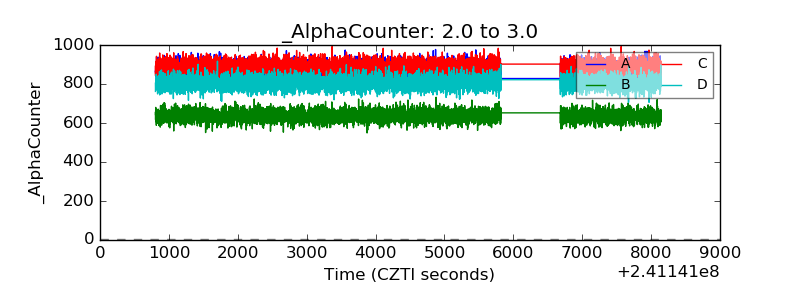 |
| _CPM_Rate | 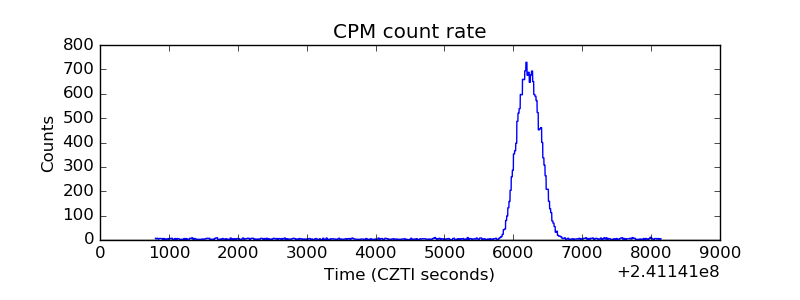 |
| CZT Counter | 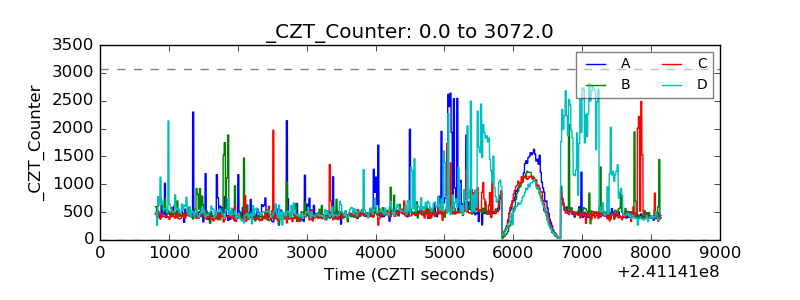 |
| +2.5 Volts monitor |  |
| +5 Volts monitor |  |
| _ROLL_ROT | 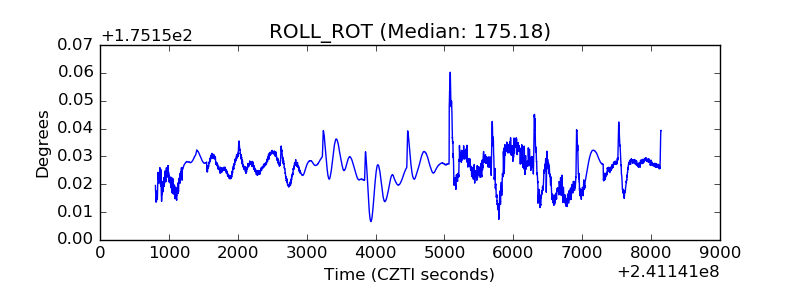 |
| _Roll_DEC | 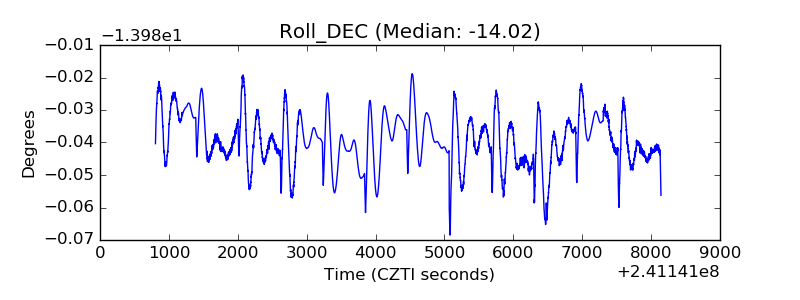 |
| _Roll_RA |  |
| Veto Counter | 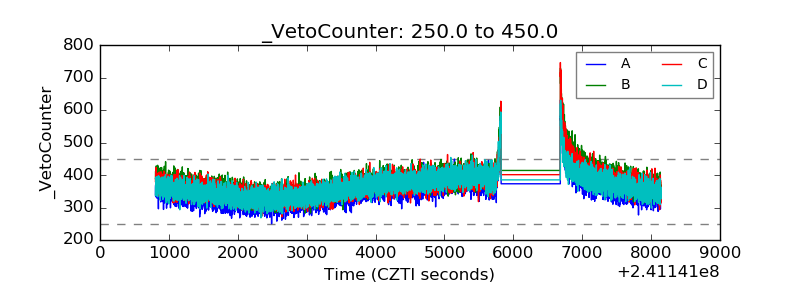 |