| Param | Original file | Final file |
|---|---|---|
| Filename | modeM0/AS1A03_072T01_9000001484_10286cztM0_level2.evt | modeM0/AS1A03_072T01_9000001484_10286cztM0_level2_quad_clean.evt |
| Size (bytes) | 524,301,120 | 75,951,360 |
| Size | 500.0 MB | 72.4 MB |
| Events in quadrant A | 3,292,145 | 468,543 |
| Events in quadrant B | 3,770,221 | 471,776 |
| Events in quadrant C | 3,303,571 | 461,352 |
| Events in quadrant D | 5,040,825 | 413,708 |
| Mode M0 | |||
|---|---|---|---|
| Quadrant | BADHDUFLAG | Total packets | Discarded packets |
| A | 0 | 14318 | 3 |
| B | 0 | 15678 | 2 |
| C | 0 | 14603 | 2 |
| D | 0 | 19820 | 2 |
| Mode SS | |||
|---|---|---|---|
| Quadrant | BADHDUFLAG | Total packets | Discarded packets |
| A | 0 | 146 | 0 |
| B | 0 | 146 | 0 |
| C | 0 | 146 | 0 |
| D | 0 | 146 | 0 |
| Mode M9 | |||
|---|---|---|---|
| Quadrant | BADHDUFLAG | Total packets | Discarded packets |
| A | 0 | 18 | 0 |
| B | 0 | 18 | 0 |
| C | 0 | 18 | 0 |
| D | 0 | 18 | 0 |
| Quadrant | Total seconds | Saturated seconds | Saturation percentage |
|---|---|---|---|
| A | 6941 | 37 | 0.533064% |
| B | 6941 | 84 | 1.210200% |
| C | 6941 | 69 | 0.994093% |
| D | 6941 | 510 | 7.347644% |
Noise dominated data is calculated using 1-second bins in cleaned event files. If a bin has >2000 counts, and if more than 50% of those come from <1% of pixels, then it is considered to be noise-dominated and hence unusable.
| Quadrant | # 1 sec bins | Bins with >0 counts | Bins with >2000 counts | High rate bins dominated by noise | Noise dominated (total time) | Noise dominated (detector-on time) | Marked lightcurve |
|---|---|---|---|---|---|---|---|
| A | 8841 | 6943 | 3 | 3 | 0.03% | 0.04% |  |
| B | 8841 | 6943 | 31 | 31 | 0.35% | 0.45% |  |
| C | 8841 | 6943 | 45 | 45 | 0.51% | 0.65% | 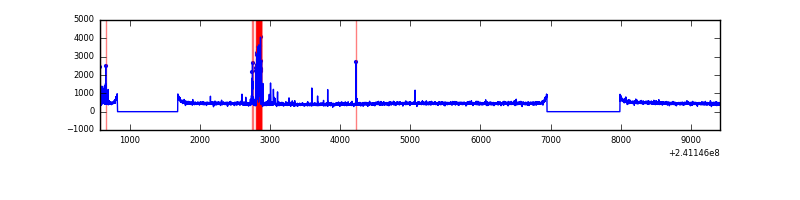 |
| D | 8841 | 6943 | 454 | 454 | 5.14% | 6.54% | 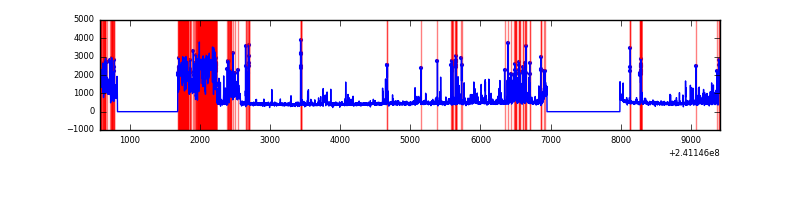 |
Top three noisy pixels from each quadrant. If the there are fewer than three noisy pixels in the level2.evt file, extra rows are filled as -1
| Pixel properties | Quadrant properties | ||||||
|---|---|---|---|---|---|---|---|
| Quadrant | DetID | PixID | Counts | Sigma | Mean | Median | Sigma |
| A | 8 | 15 | 42972 | 251.26 | 825 | 809 | 167.8 |
| A | 8 | 5 | 30971 | 179.75 | 825 | 809 | 167.8 |
| A | 3 | 1 | 25129 | 144.93 | 825 | 809 | 167.8 |
| B | 4 | 239 | 396367 | 2478.89 | 831 | 811 | 159.6 |
| B | 10 | 247 | 47169 | 290.52 | 831 | 811 | 159.6 |
| B | 11 | 51 | 30132 | 183.75 | 831 | 811 | 159.6 |
| C | 4 | 254 | 195530 | 1052.92 | 794 | 801 | 184.9 |
| C | 14 | 234 | 7977 | 38.8 | 794 | 801 | 184.9 |
| C | 13 | 61 | 6006 | 28.14 | 794 | 801 | 184.9 |
| D | 13 | 104 | 585033 | 2839.16 | 763 | 748 | 205.8 |
| D | 12 | 233 | 565824 | 2745.82 | 763 | 748 | 205.8 |
| D | 2 | 16 | 532378 | 2583.3 | 763 | 748 | 205.8 |
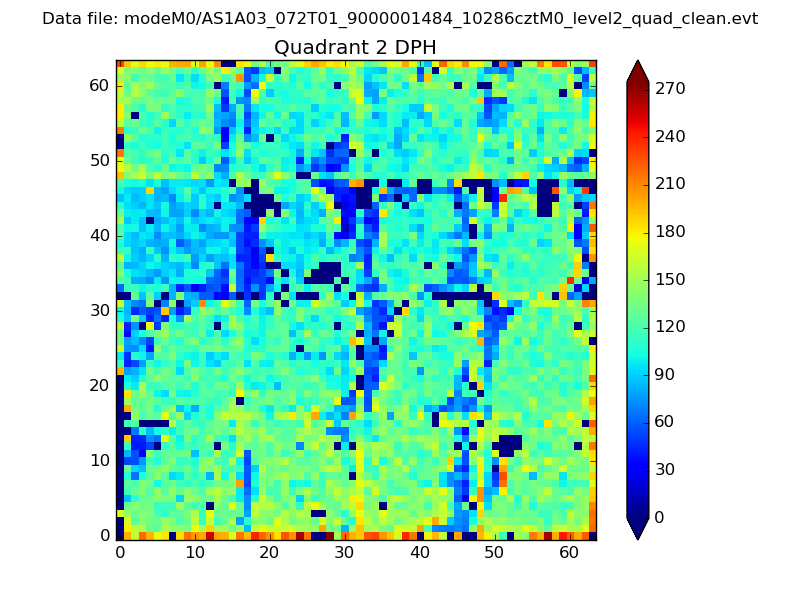
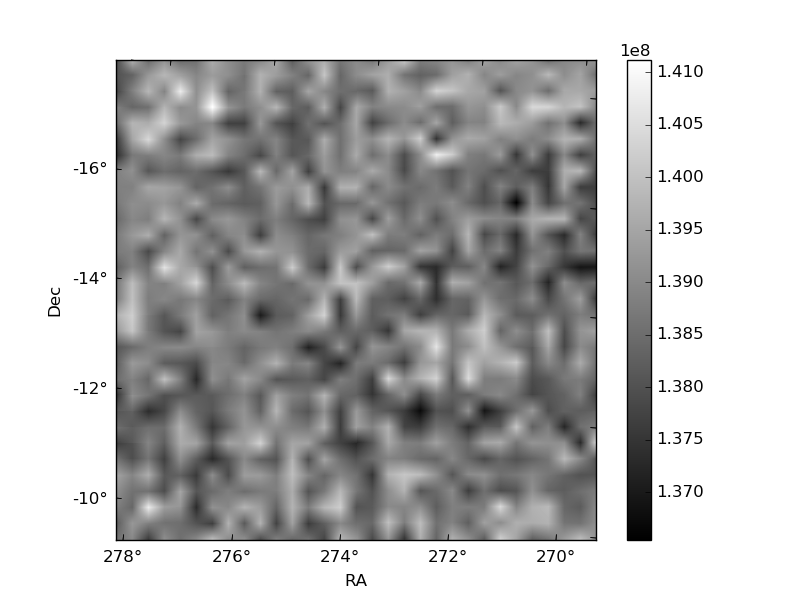
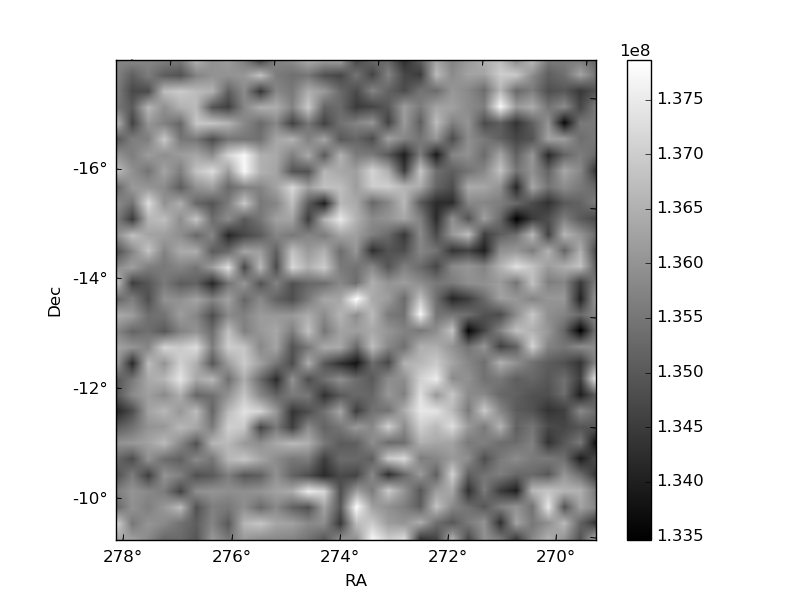
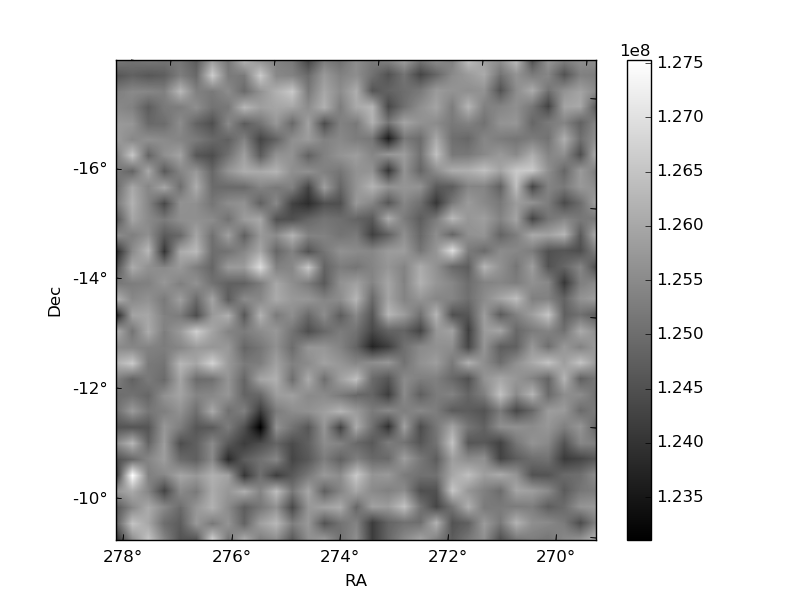
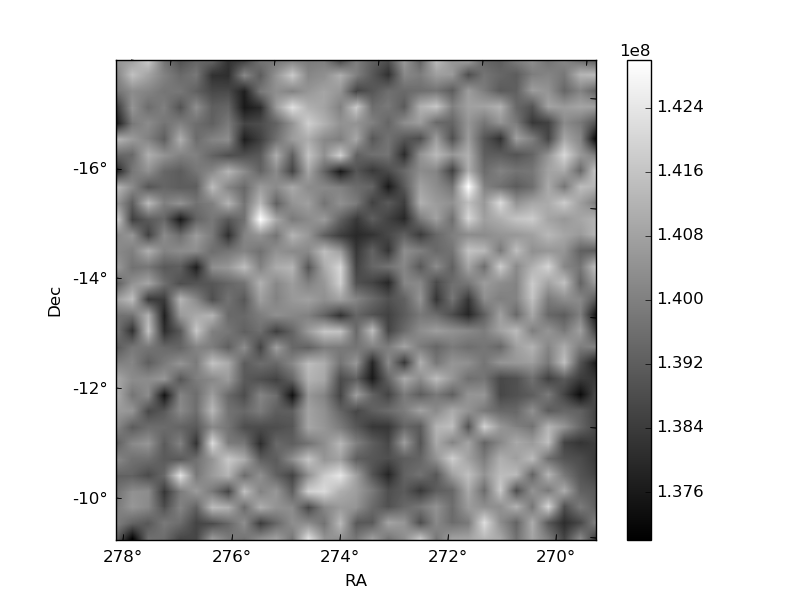
Histogram calculated using DETX and DETY for each event in the final _common_clean file
| Quadrant A | 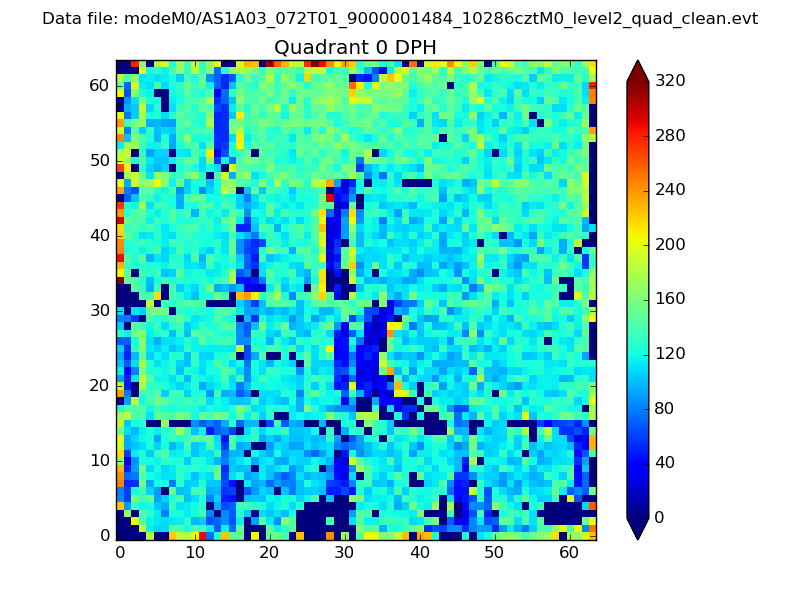 |
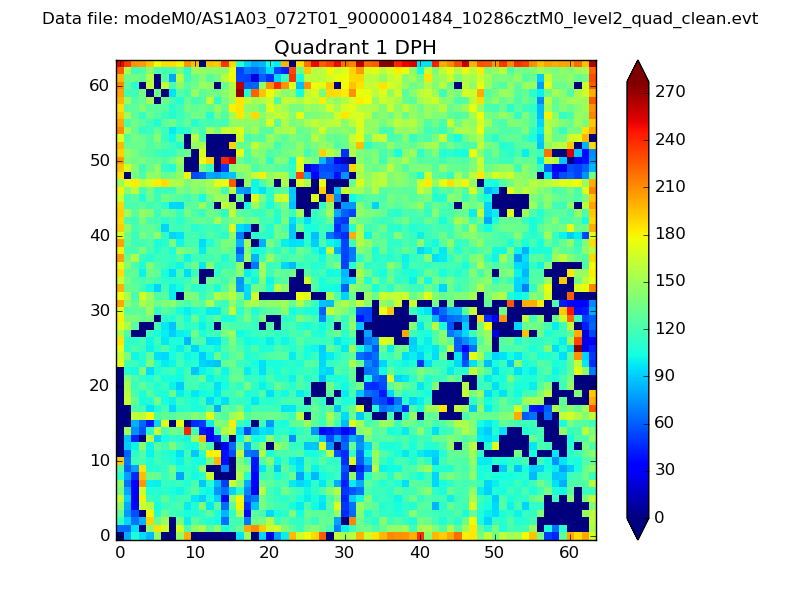 |
Quadrant B |
|---|---|---|---|
| Quadrant D | 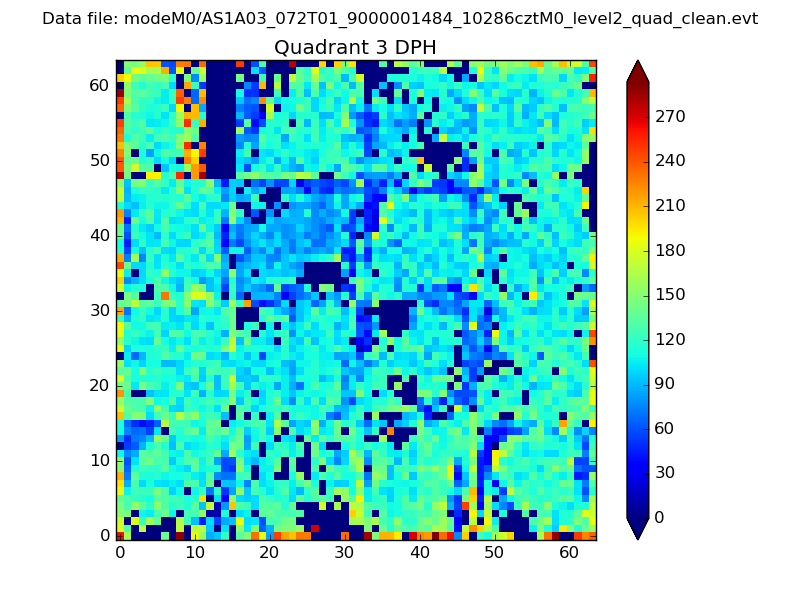 |
 |
Quadrant C |
| Plot type | Count rate plots | Images |
|---|---|---|
| Comparison with Poisson distribution Blue bars denote a histogram of data divided into 1 sec bins. Red curve is a Poisson curve with rate = median count rate of data. |
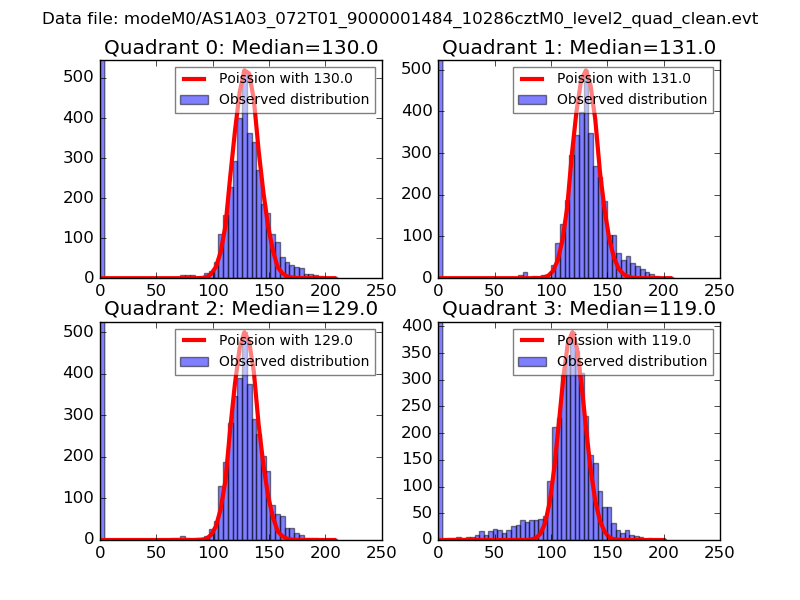 |
 |
| Quadrant-wise count rates Data is divided into 100 sec bins |
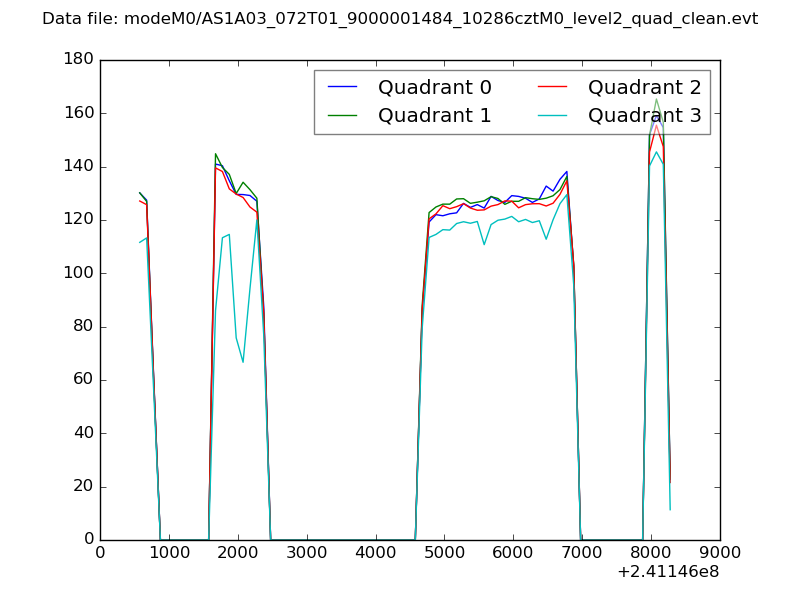 |
|
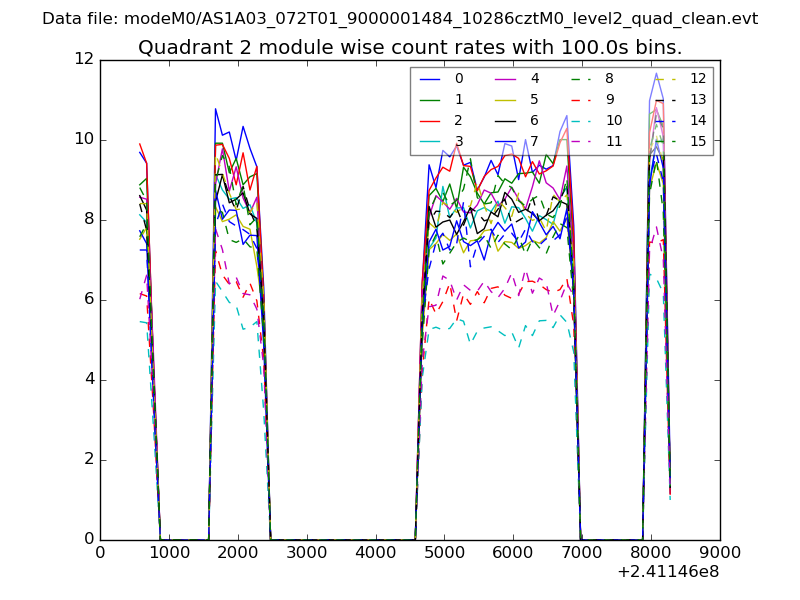
| Module-wise count rates for Quadrant A Data is divided into 100 sec bins |
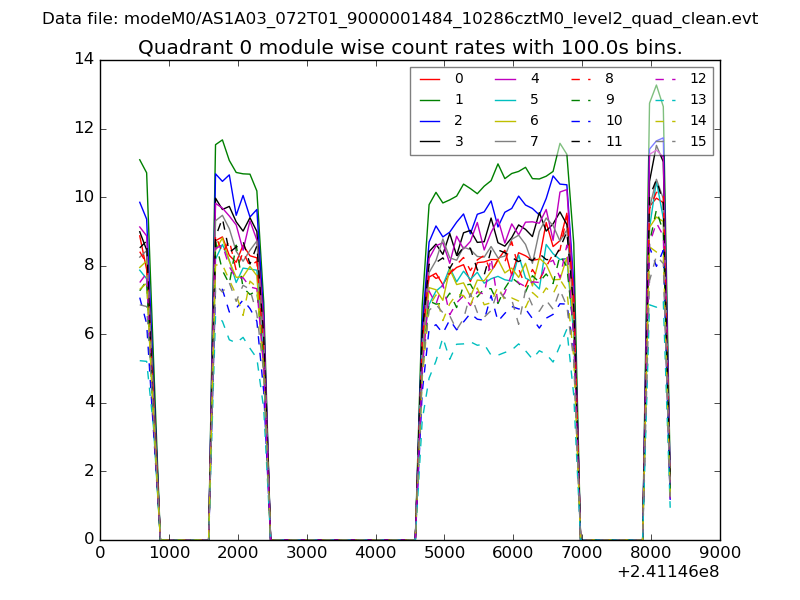 |
 |
| Module-wise count rates for Quadrant B Data is divided into 100 sec bins |
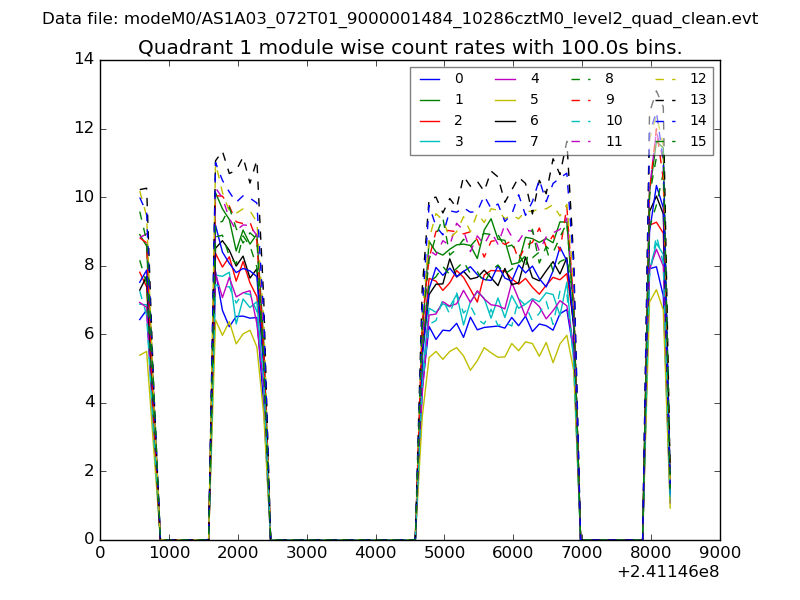 |
 |
| Module-wise count rates for Quadrant C Data is divided into 100 sec bins |
 |
 |
| Module-wise count rates for Quadrant D Data is divided into 100 sec bins |
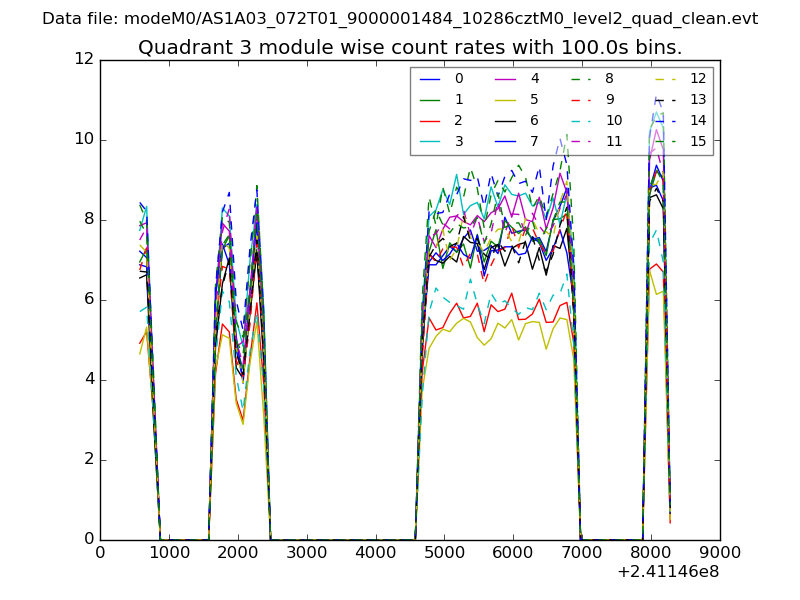 |
 |
| Parameter | Plot |
|---|---|
| CZT HV Monitor | 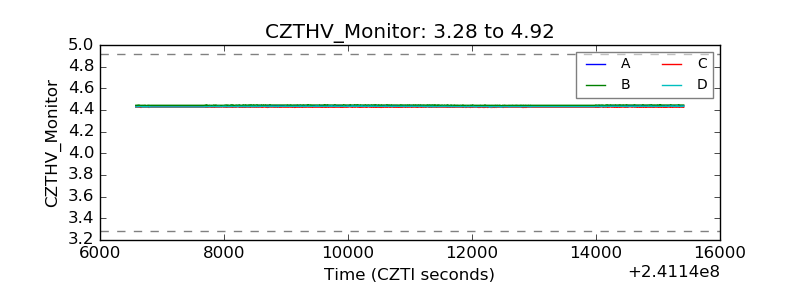 |
| D_VDD | 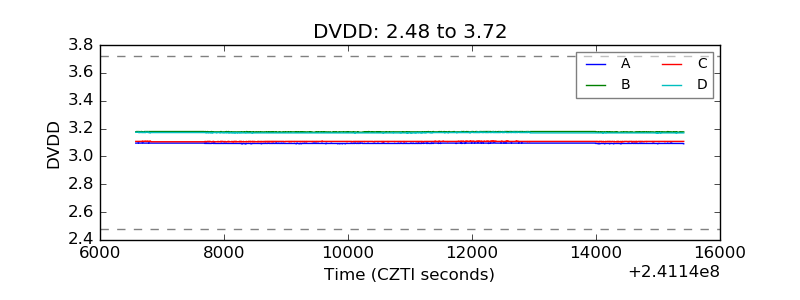 |
| Temperature 1 | 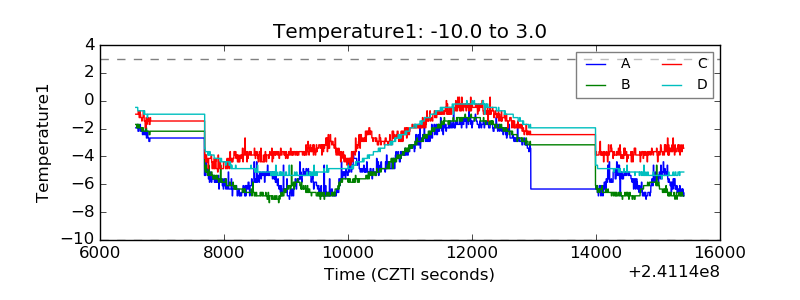 |
| Veto HV Monitor |  |
| Veto LLD | 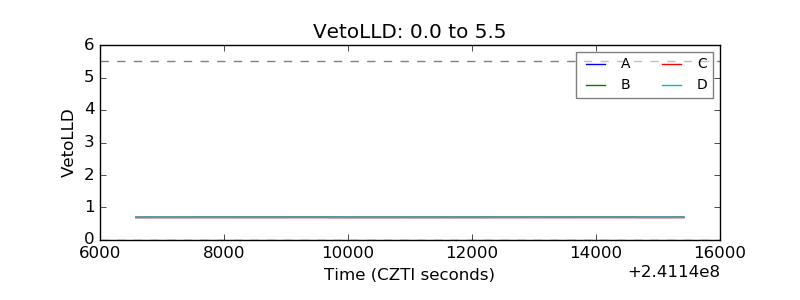 |
| Alpha Counter | 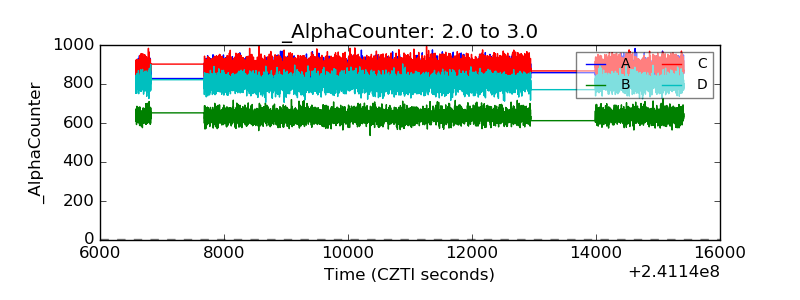 |
| _CPM_Rate | 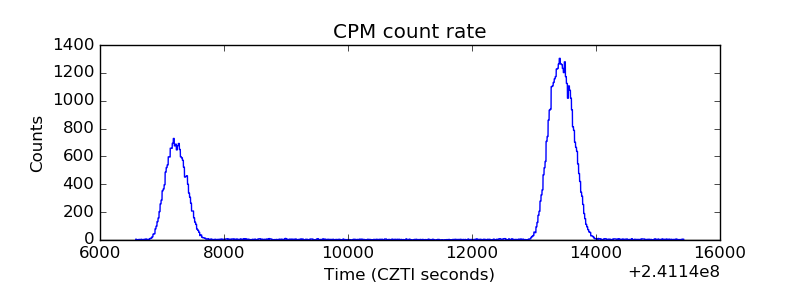 |
| CZT Counter | 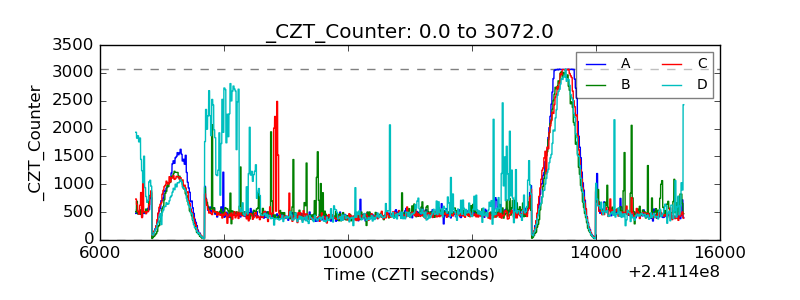 |
| +2.5 Volts monitor |  |
| +5 Volts monitor |  |
| _ROLL_ROT | 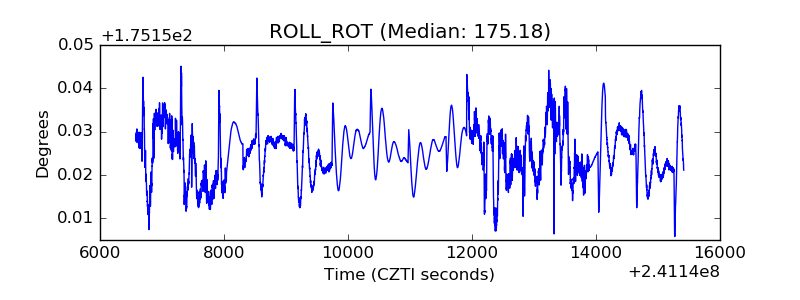 |
| _Roll_DEC | 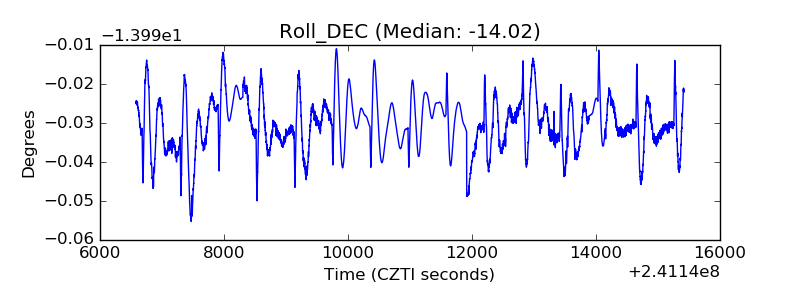 |
| _Roll_RA | 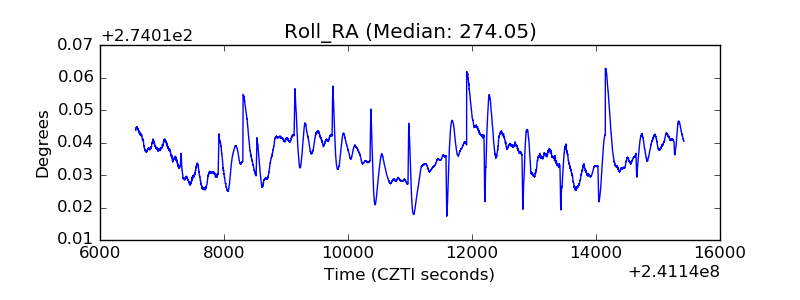 |
| Veto Counter | 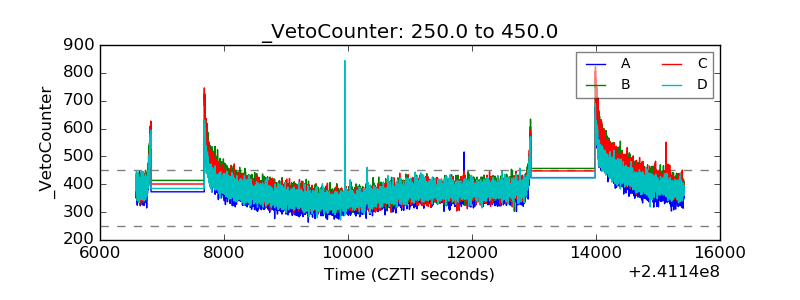 |