| Param | Original file | Final file |
|---|---|---|
| Filename | modeM0/AS1A03_072T01_9000001484_10288cztM0_level2.evt | modeM0/AS1A03_072T01_9000001484_10288cztM0_level2_quad_clean.evt |
| Size (bytes) | 512,043,840 | 63,486,720 |
| Size | 488.3 MB | 60.5 MB |
| Events in quadrant A | 3,148,798 | 374,819 |
| Events in quadrant B | 4,110,822 | 378,180 |
| Events in quadrant C | 3,509,265 | 364,361 |
| Events in quadrant D | 4,295,168 | 349,011 |
| Mode M0 | |||
|---|---|---|---|
| Quadrant | BADHDUFLAG | Total packets | Discarded packets |
| A | 0 | 13488 | 3 |
| B | 0 | 16323 | 2 |
| C | 0 | 14771 | 2 |
| D | 0 | 17061 | 2 |
| Mode SS | |||
|---|---|---|---|
| Quadrant | BADHDUFLAG | Total packets | Discarded packets |
| A | 0 | 134 | 0 |
| B | 0 | 134 | 0 |
| C | 0 | 134 | 0 |
| D | 0 | 134 | 0 |
| Mode M9 | |||
|---|---|---|---|
| Quadrant | BADHDUFLAG | Total packets | Discarded packets |
| A | 0 | 16 | 0 |
| B | 0 | 16 | 0 |
| C | 0 | 16 | 0 |
| D | 0 | 17 | 0 |
| Quadrant | Total seconds | Saturated seconds | Saturation percentage |
|---|---|---|---|
| A | 6530 | 37 | 0.566616% |
| B | 6530 | 119 | 1.822358% |
| C | 6530 | 104 | 1.592649% |
| D | 6530 | 188 | 2.879020% |
Noise dominated data is calculated using 1-second bins in cleaned event files. If a bin has >2000 counts, and if more than 50% of those come from <1% of pixels, then it is considered to be noise-dominated and hence unusable.
| Quadrant | # 1 sec bins | Bins with >0 counts | Bins with >2000 counts | High rate bins dominated by noise | Noise dominated (total time) | Noise dominated (detector-on time) | Marked lightcurve |
|---|---|---|---|---|---|---|---|
| A | 7685 | 6530 | 1 | 1 | 0.01% | 0.02% | 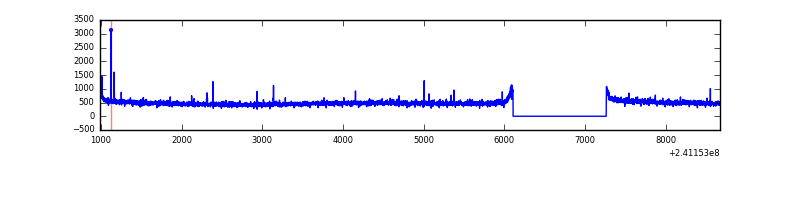 |
| B | 7685 | 6530 | 35 | 35 | 0.46% | 0.54% | 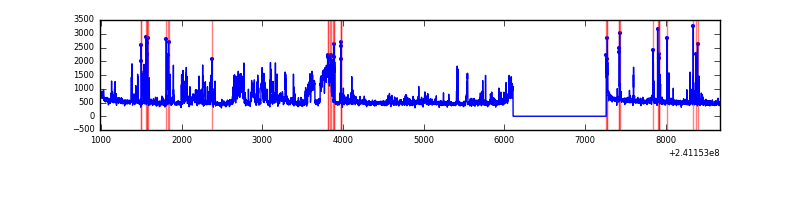 |
| C | 7685 | 6530 | 42 | 42 | 0.55% | 0.64% | 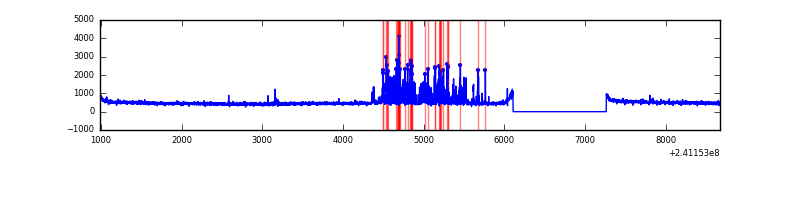 |
| D | 7685 | 6530 | 157 | 157 | 2.04% | 2.40% | 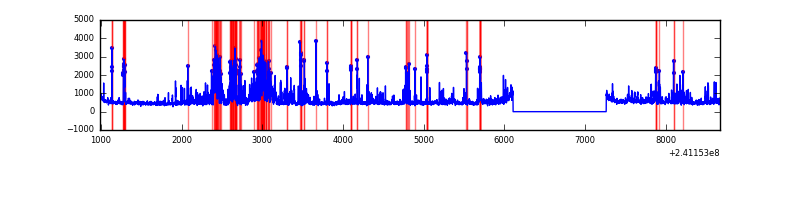 |
Top three noisy pixels from each quadrant. If the there are fewer than three noisy pixels in the level2.evt file, extra rows are filled as -1
| Pixel properties | Quadrant properties | ||||||
|---|---|---|---|---|---|---|---|
| Quadrant | DetID | PixID | Counts | Sigma | Mean | Median | Sigma |
| A | 8 | 15 | 29879 | 178.47 | 803 | 788 | 163.0 |
| A | 5 | 16 | 10818 | 61.53 | 803 | 788 | 163.0 |
| A | 3 | 1 | 9527 | 53.61 | 803 | 788 | 163.0 |
| B | 10 | 247 | 550621 | 3599.19 | 806 | 788 | 152.8 |
| B | 4 | 239 | 312512 | 2040.54 | 806 | 788 | 152.8 |
| B | 0 | 214 | 46291 | 297.86 | 806 | 788 | 152.8 |
| C | 4 | 254 | 481318 | 2675.32 | 774 | 779 | 179.6 |
| C | 14 | 234 | 8124 | 40.89 | 774 | 779 | 179.6 |
| C | 13 | 61 | 5830 | 28.12 | 774 | 779 | 179.6 |
| D | 12 | 233 | 775968 | 3959.11 | 760 | 742 | 195.8 |
| D | 2 | 33 | 172182 | 875.55 | 760 | 742 | 195.8 |
| D | 5 | 222 | 141283 | 717.75 | 760 | 742 | 195.8 |
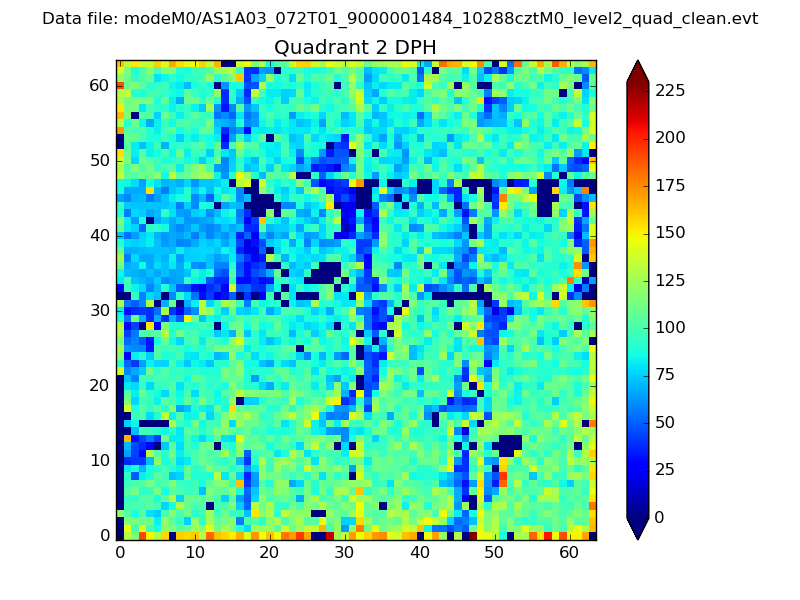
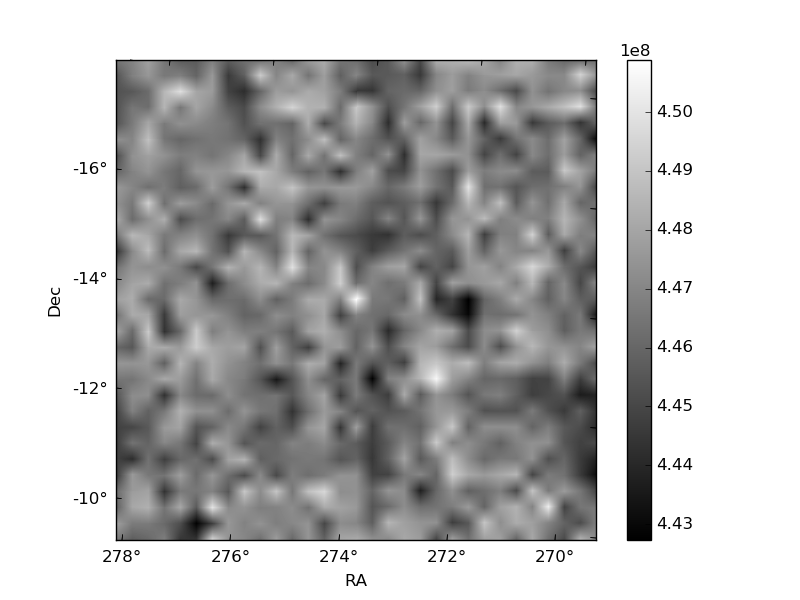
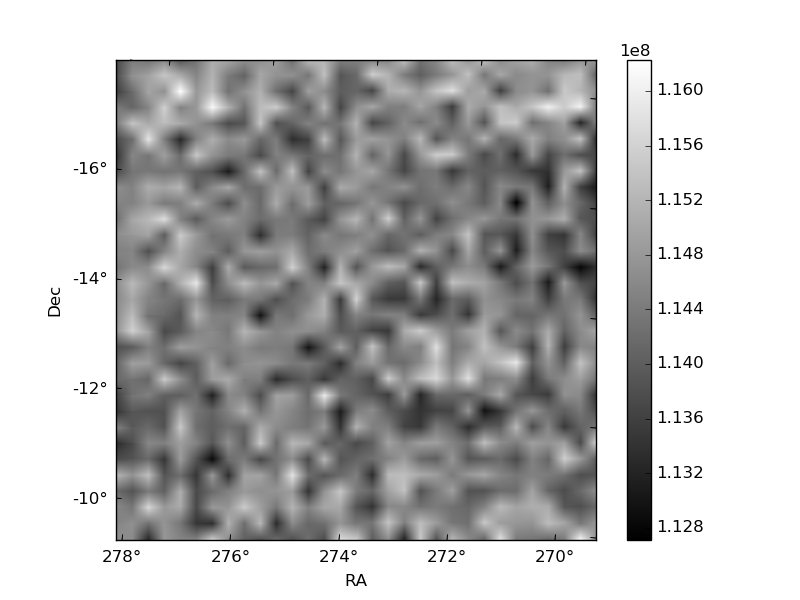
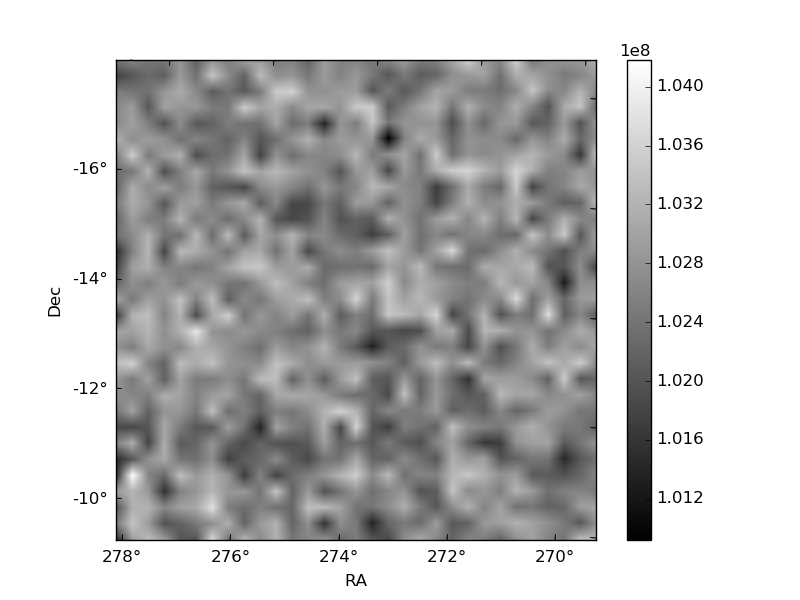
Histogram calculated using DETX and DETY for each event in the final _common_clean file
| Quadrant A | 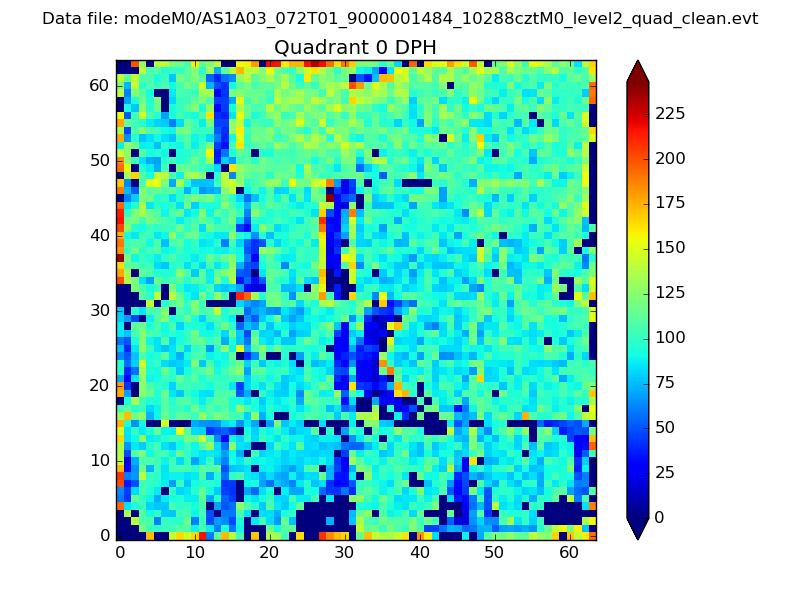 |
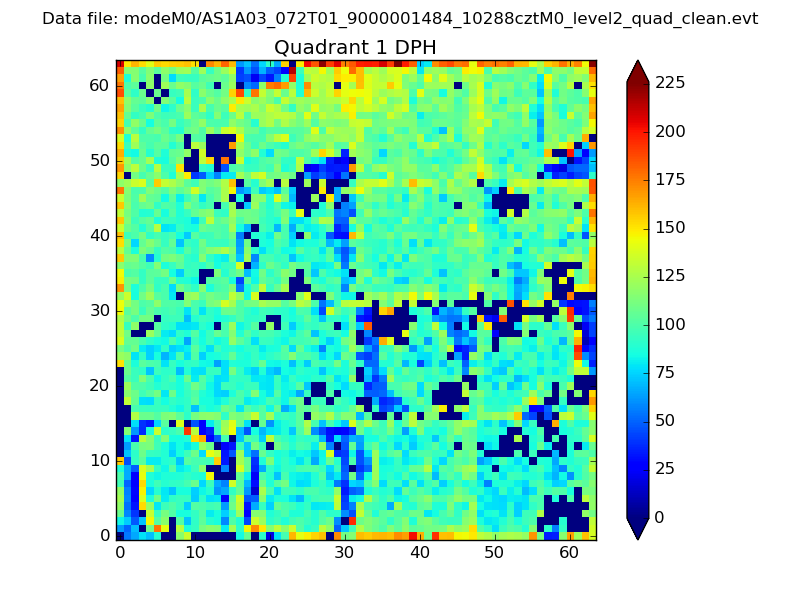 |
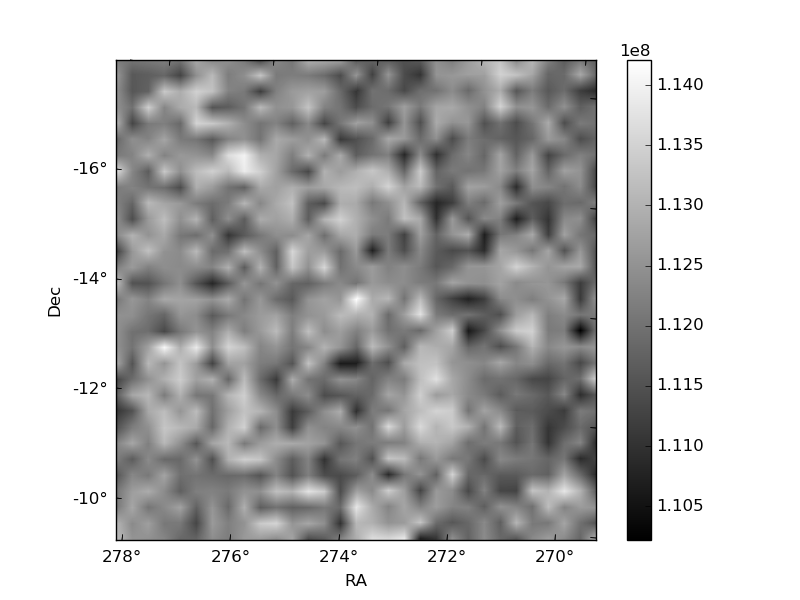
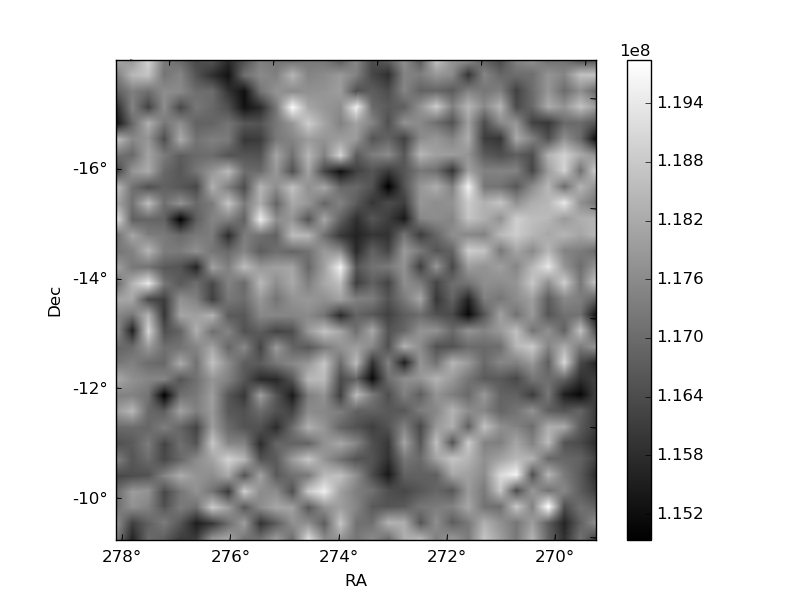
Quadrant B |
|---|---|---|---|
| Quadrant D | 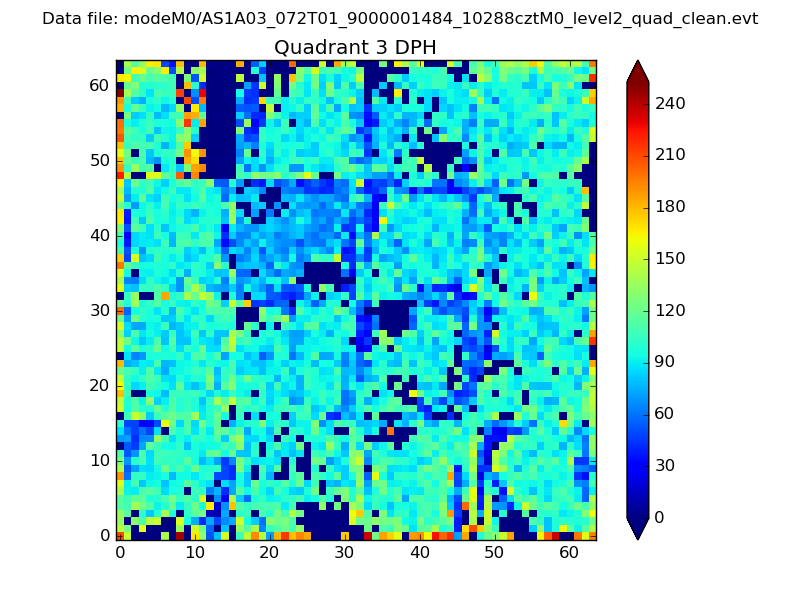 |
 |
Quadrant C |
| Plot type | Count rate plots | Images |
|---|---|---|
| Comparison with Poisson distribution Blue bars denote a histogram of data divided into 1 sec bins. Red curve is a Poisson curve with rate = median count rate of data. |
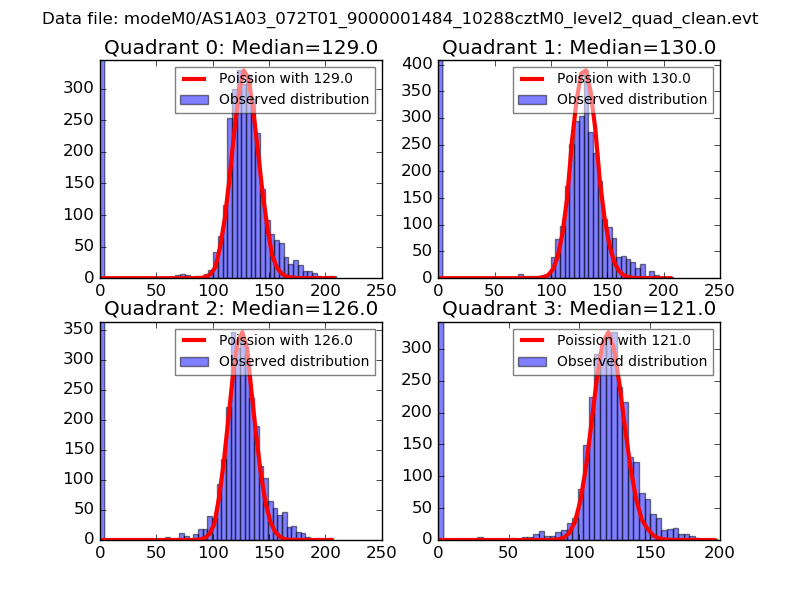 |
 |
| Quadrant-wise count rates Data is divided into 100 sec bins |
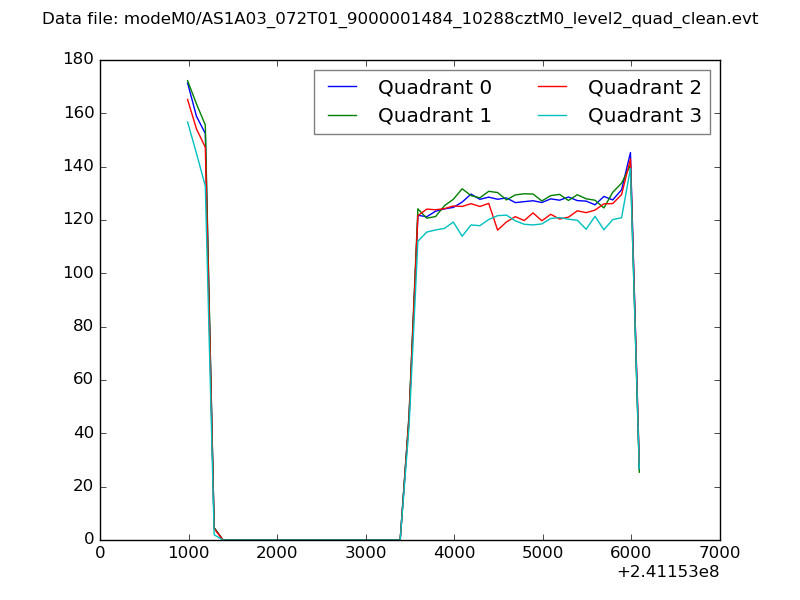 |
|
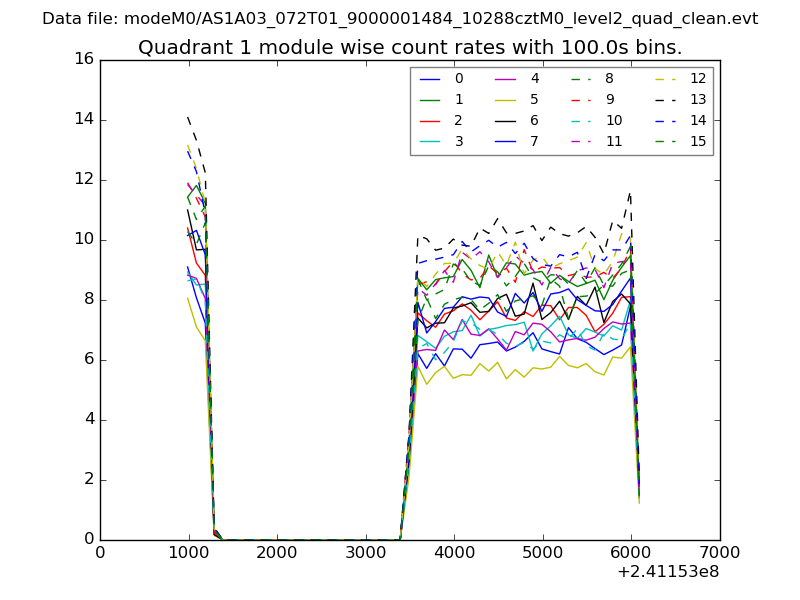
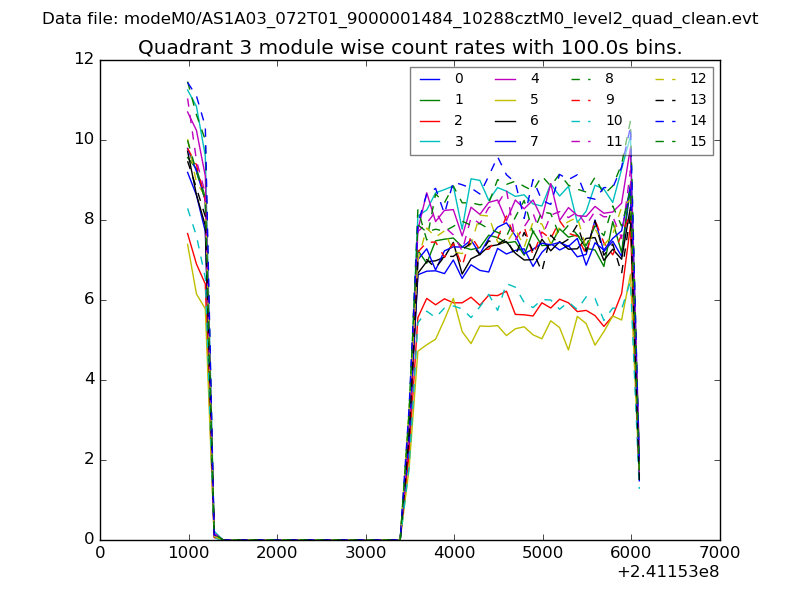
| Module-wise count rates for Quadrant A Data is divided into 100 sec bins |
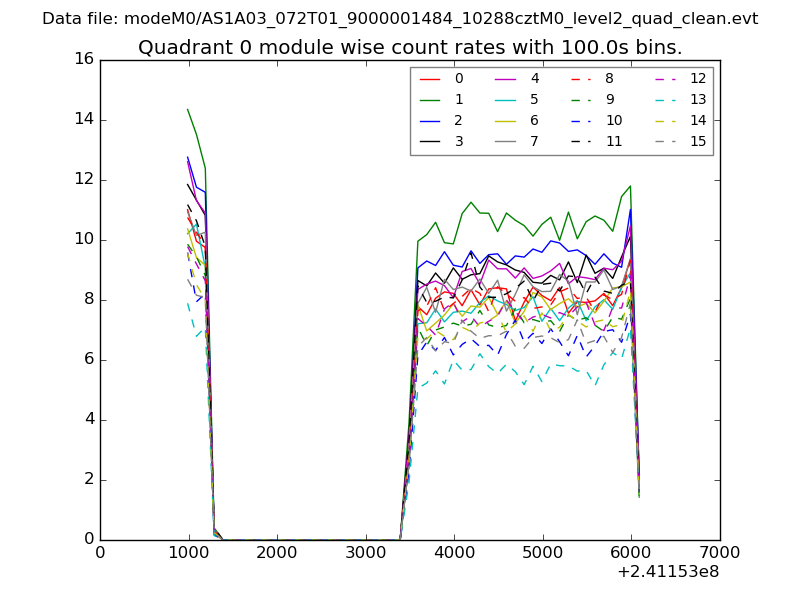 |
 |
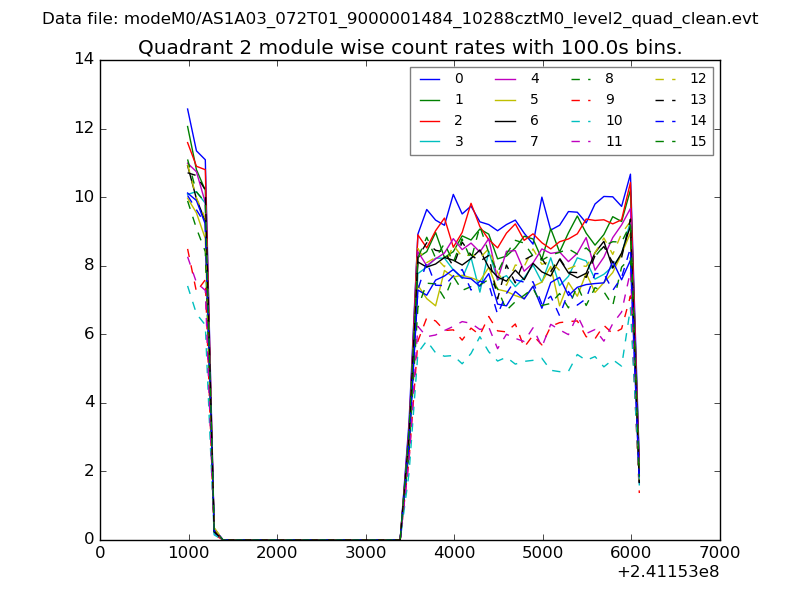
| Module-wise count rates for Quadrant B Data is divided into 100 sec bins |
 |
 |
| Module-wise count rates for Quadrant C Data is divided into 100 sec bins |
 |
 |
| Module-wise count rates for Quadrant D Data is divided into 100 sec bins |
 |
 |
| Parameter | Plot |
|---|---|
| CZT HV Monitor | 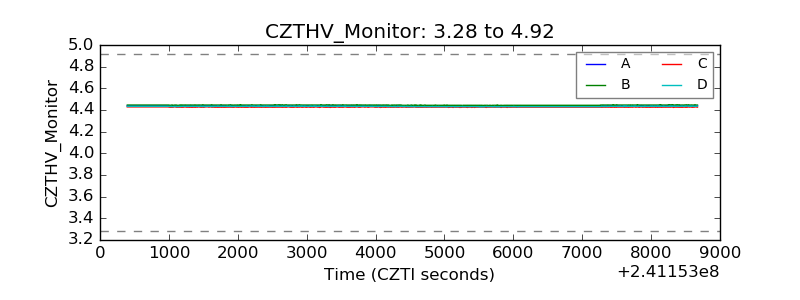 |
| D_VDD |  |
| Temperature 1 | 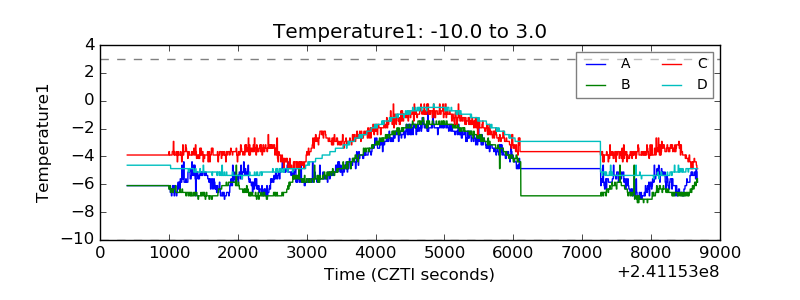 |
| Veto HV Monitor | 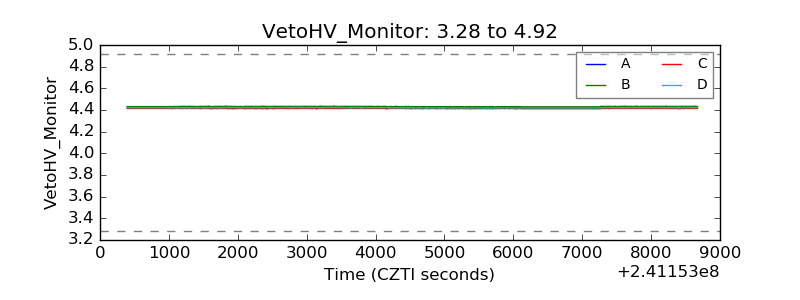 |
| Veto LLD | 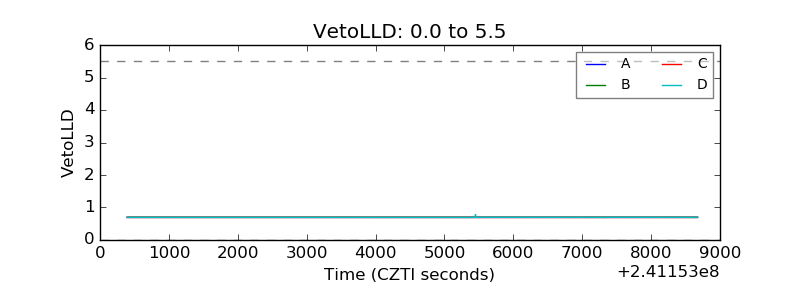 |
| Alpha Counter | 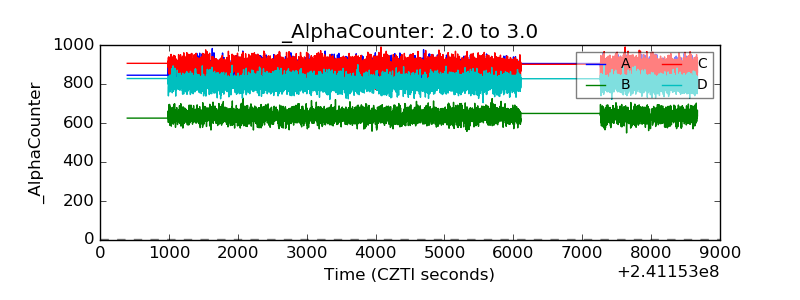 |
| _CPM_Rate | 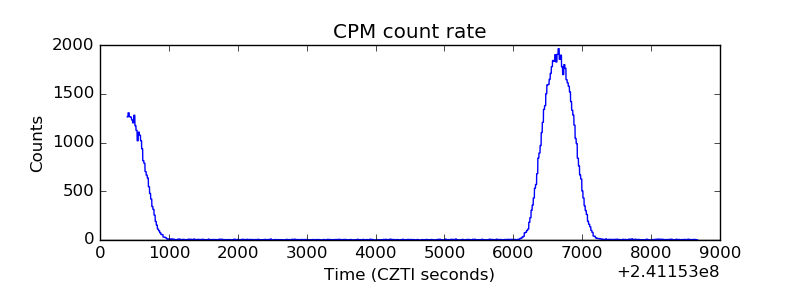 |
| CZT Counter | 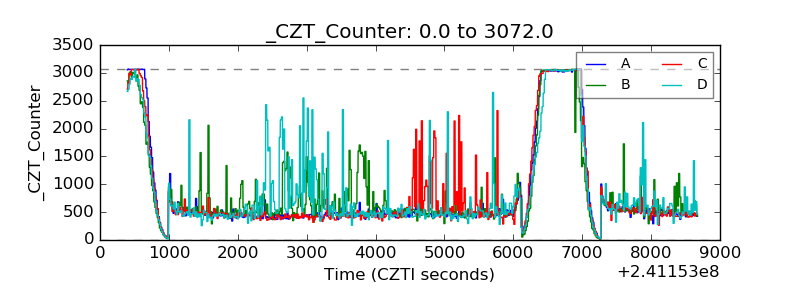 |
| +2.5 Volts monitor |  |
| +5 Volts monitor | 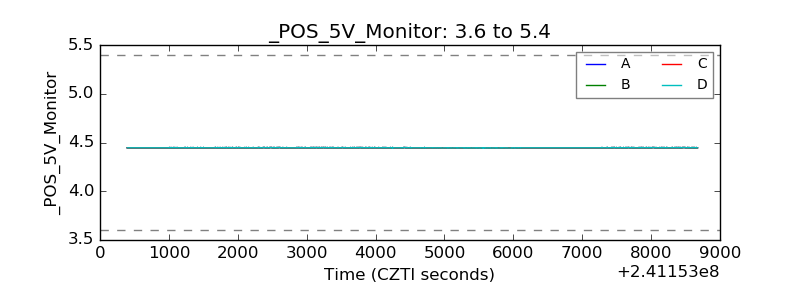 |
| _ROLL_ROT | 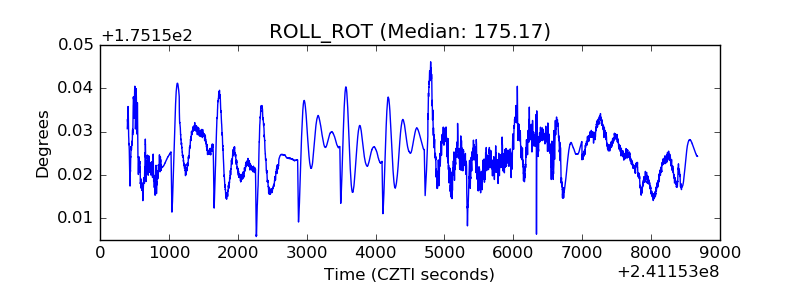 |
| _Roll_DEC | 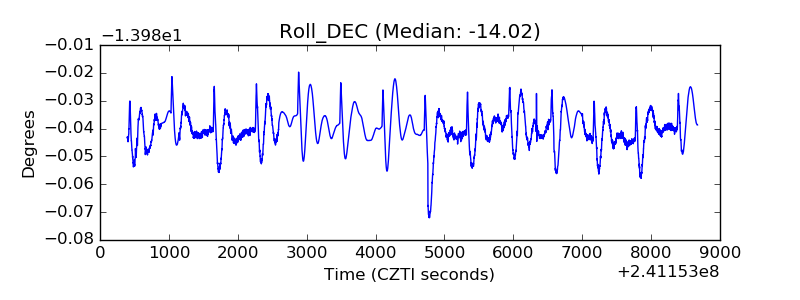 |
| _Roll_RA | 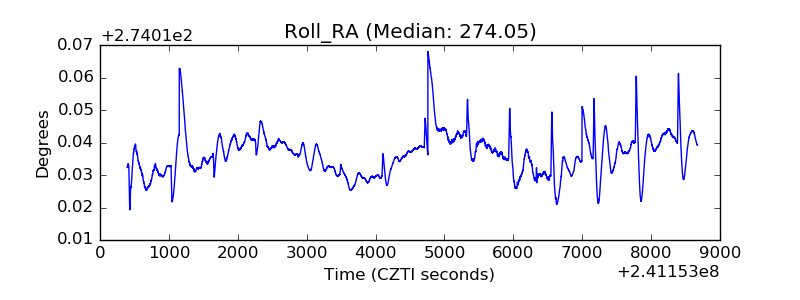 |
| Veto Counter | 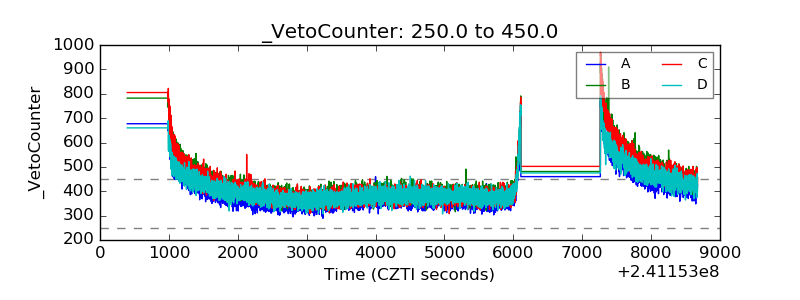 |