| Param | Original file | Final file |
|---|---|---|
| Filename | modeM0/AS1A03_072T01_9000001484_10289cztM0_level2.evt | modeM0/AS1A03_072T01_9000001484_10289cztM0_level2_quad_clean.evt |
| Size (bytes) | 487,154,880 | 63,866,880 |
| Size | 464.6 MB | 60.9 MB |
| Events in quadrant A | 3,239,094 | 381,140 |
| Events in quadrant B | 3,613,886 | 384,612 |
| Events in quadrant C | 3,592,042 | 369,480 |
| Events in quadrant D | 3,874,517 | 352,151 |
| Mode M0 | |||
|---|---|---|---|
| Quadrant | BADHDUFLAG | Total packets | Discarded packets |
| A | 0 | 13446 | 3 |
| B | 0 | 14699 | 2 |
| C | 0 | 14694 | 2 |
| D | 0 | 15531 | 2 |
| Mode SS | |||
|---|---|---|---|
| Quadrant | BADHDUFLAG | Total packets | Discarded packets |
| A | 0 | 130 | 0 |
| B | 0 | 130 | 0 |
| C | 0 | 130 | 0 |
| D | 0 | 130 | 0 |
| Mode M9 | |||
|---|---|---|---|
| Quadrant | BADHDUFLAG | Total packets | Discarded packets |
| A | 0 | 17 | 0 |
| B | 0 | 17 | 0 |
| C | 0 | 17 | 0 |
| D | 0 | 18 | 0 |
| Quadrant | Total seconds | Saturated seconds | Saturation percentage |
|---|---|---|---|
| A | 6394 | 49 | 0.766343% |
| B | 6394 | 119 | 1.861120% |
| C | 6394 | 131 | 2.048796% |
| D | 6394 | 75 | 1.172975% |
Noise dominated data is calculated using 1-second bins in cleaned event files. If a bin has >2000 counts, and if more than 50% of those come from <1% of pixels, then it is considered to be noise-dominated and hence unusable.
| Quadrant | # 1 sec bins | Bins with >0 counts | Bins with >2000 counts | High rate bins dominated by noise | Noise dominated (total time) | Noise dominated (detector-on time) | Marked lightcurve |
|---|---|---|---|---|---|---|---|
| A | 7639 | 6394 | 0 | 0 | 0.00% | 0.00% | 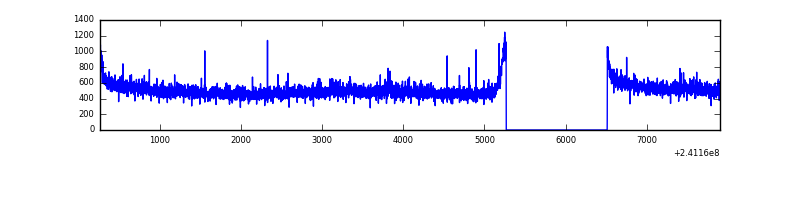 |
| B | 7639 | 6394 | 28 | 28 | 0.37% | 0.44% | 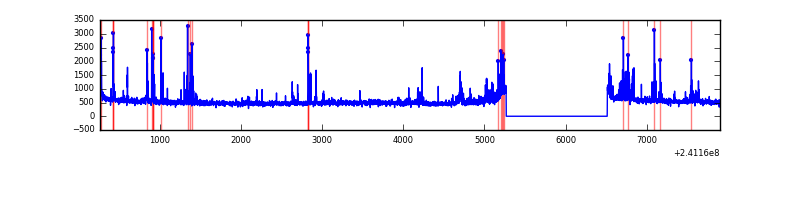 |
| C | 7639 | 6394 | 56 | 56 | 0.73% | 0.88% | 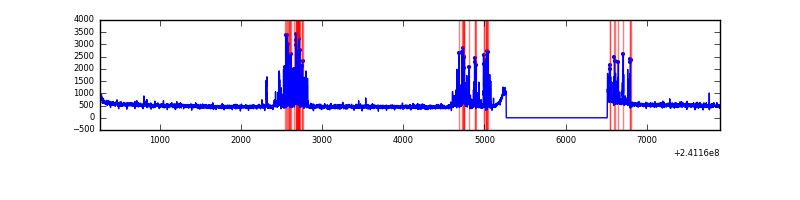 |
| D | 7639 | 6394 | 38 | 38 | 0.50% | 0.59% | 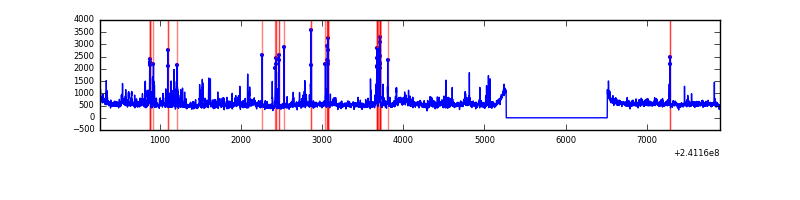 |
Top three noisy pixels from each quadrant. If the there are fewer than three noisy pixels in the level2.evt file, extra rows are filled as -1
| Pixel properties | Quadrant properties | ||||||
|---|---|---|---|---|---|---|---|
| Quadrant | DetID | PixID | Counts | Sigma | Mean | Median | Sigma |
| A | 8 | 15 | 43352 | 255.89 | 827 | 814 | 166.2 |
| A | 0 | 226 | 7531 | 40.41 | 827 | 814 | 166.2 |
| A | 12 | 194 | 6638 | 35.03 | 827 | 814 | 166.2 |
| B | 4 | 239 | 320616 | 2038.41 | 829 | 812 | 156.9 |
| B | 11 | 51 | 38442 | 239.85 | 829 | 812 | 156.9 |
| B | 12 | 111 | 16506 | 100.03 | 829 | 812 | 156.9 |
| C | 4 | 254 | 493889 | 2689.77 | 794 | 799 | 183.3 |
| C | 13 | 61 | 5924 | 27.96 | 794 | 799 | 183.3 |
| C | 14 | 67 | 3188 | 13.03 | 794 | 799 | 183.3 |
| D | 8 | 195 | 252283 | 1268.92 | 786 | 770 | 198.2 |
| D | 1 | 52 | 195495 | 982.42 | 786 | 770 | 198.2 |
| D | 5 | 222 | 75858 | 378.83 | 786 | 770 | 198.2 |
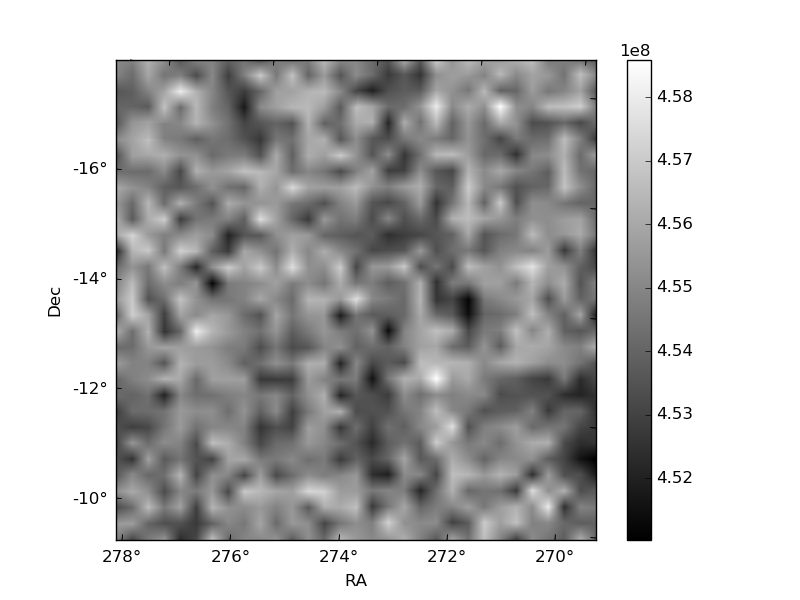
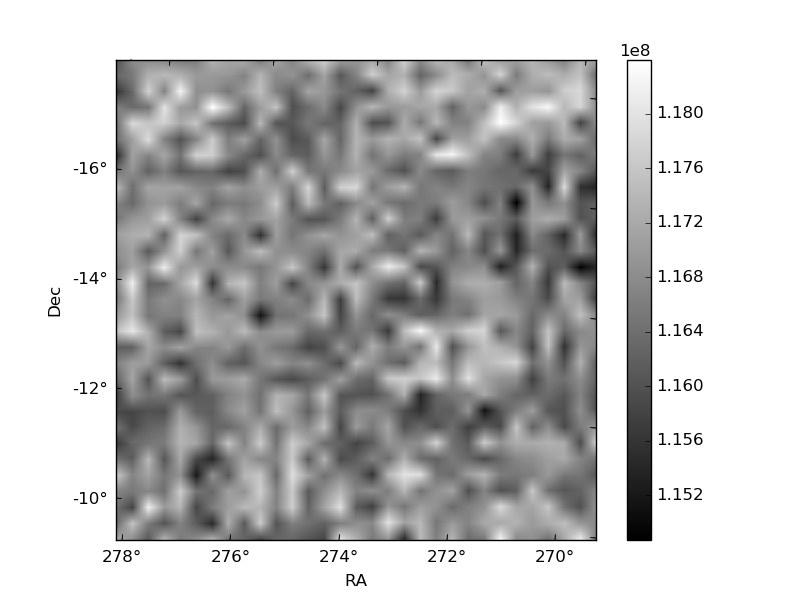
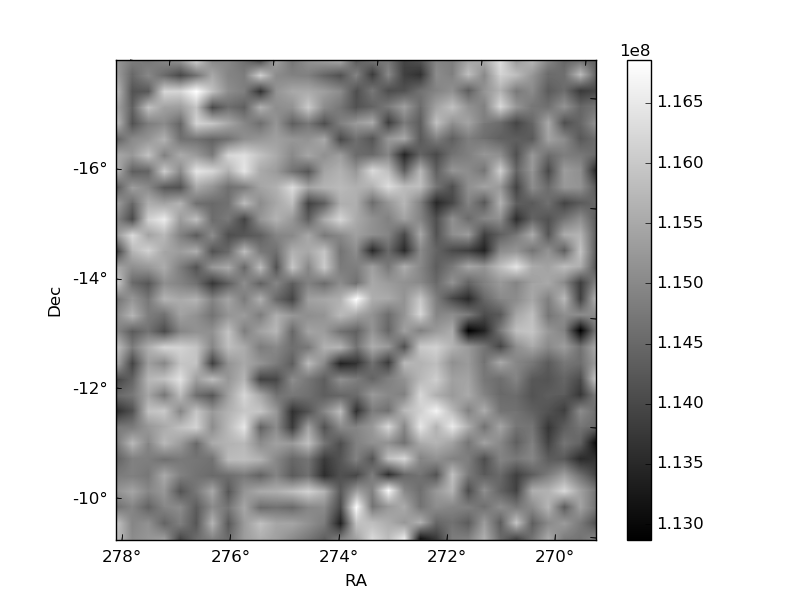
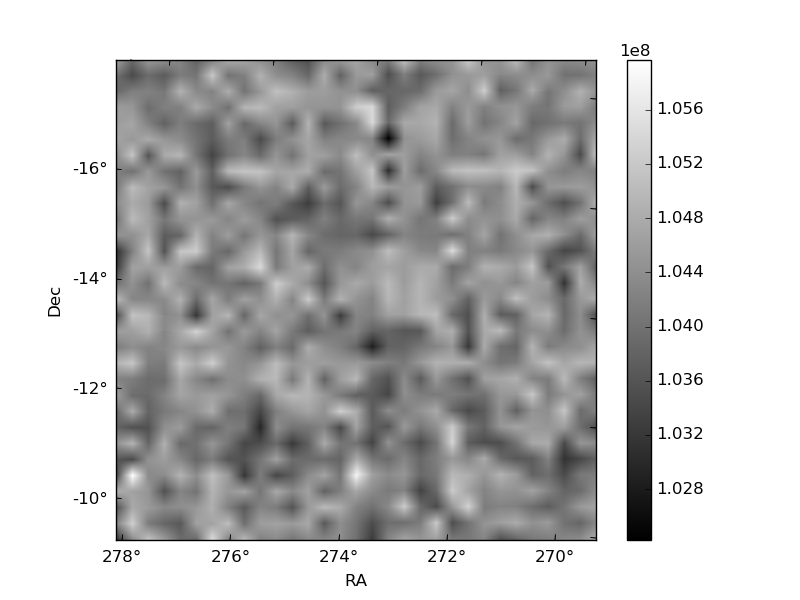
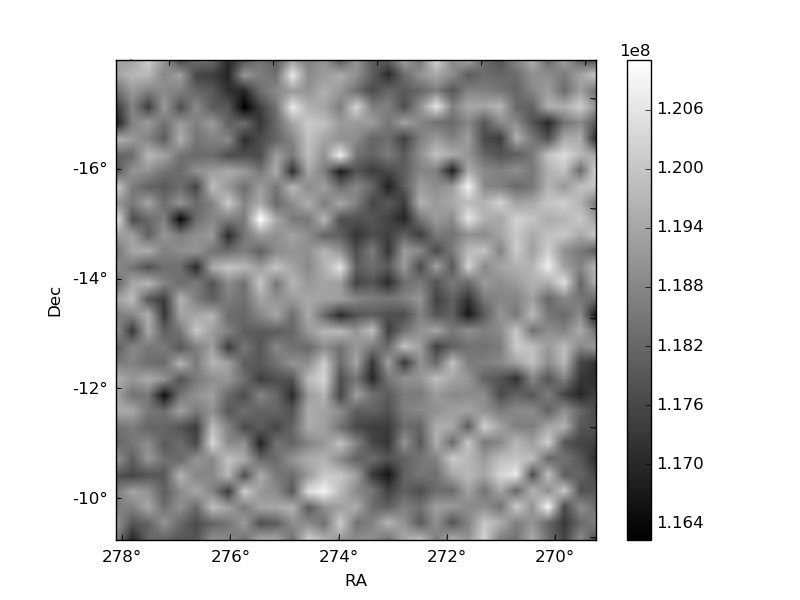
Histogram calculated using DETX and DETY for each event in the final _common_clean file
| Quadrant A | 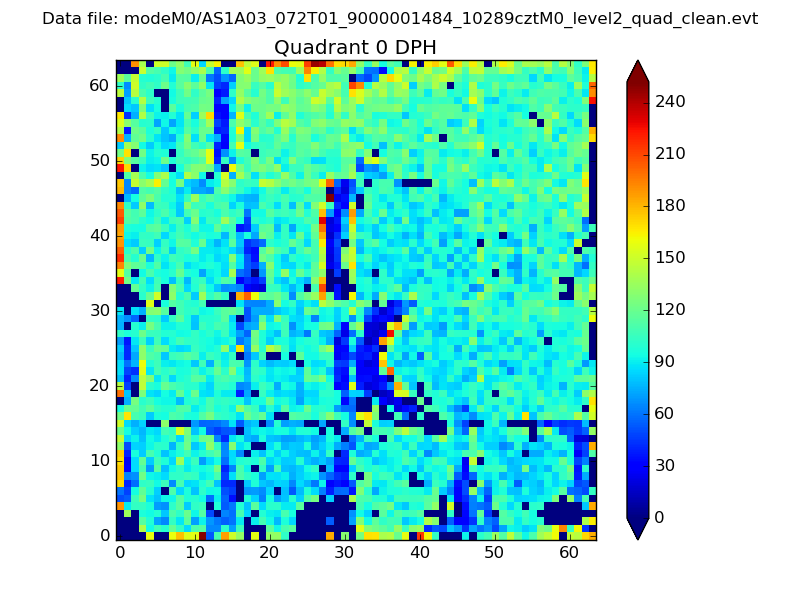 |
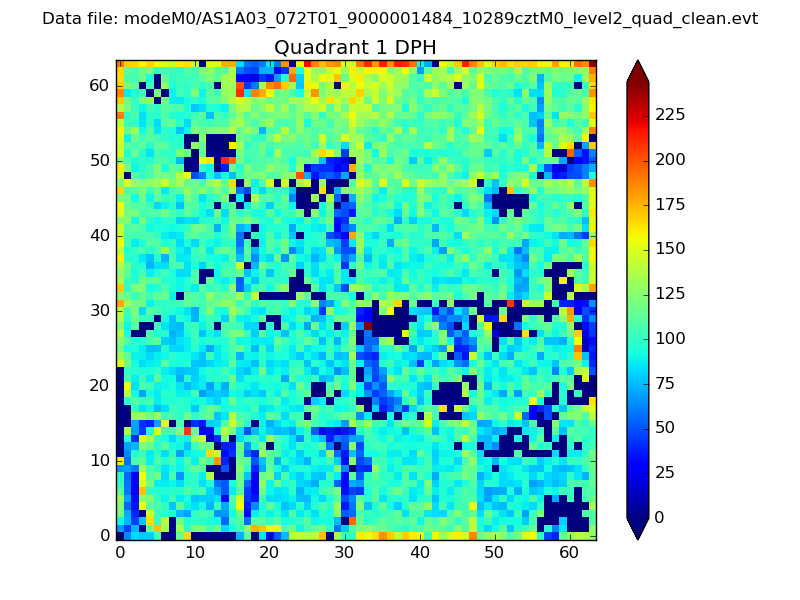 |
Quadrant B |
|---|---|---|---|
| Quadrant D | 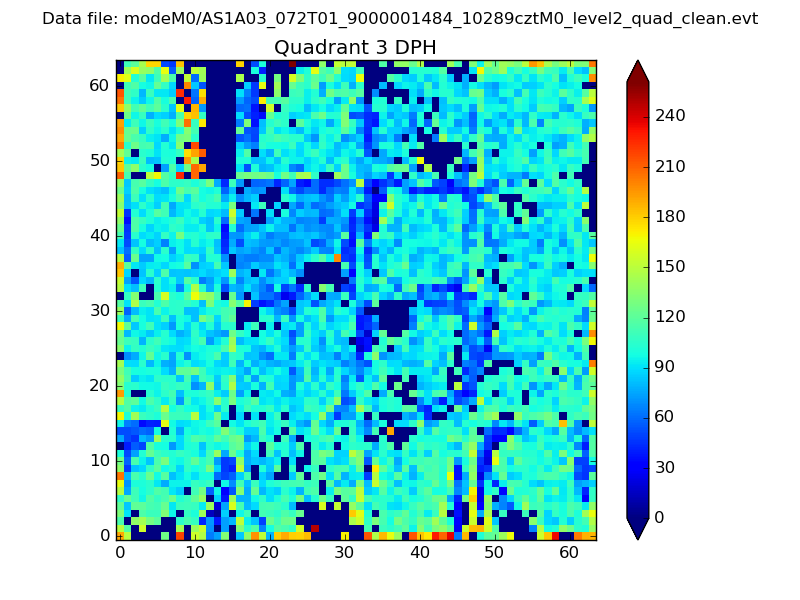 |
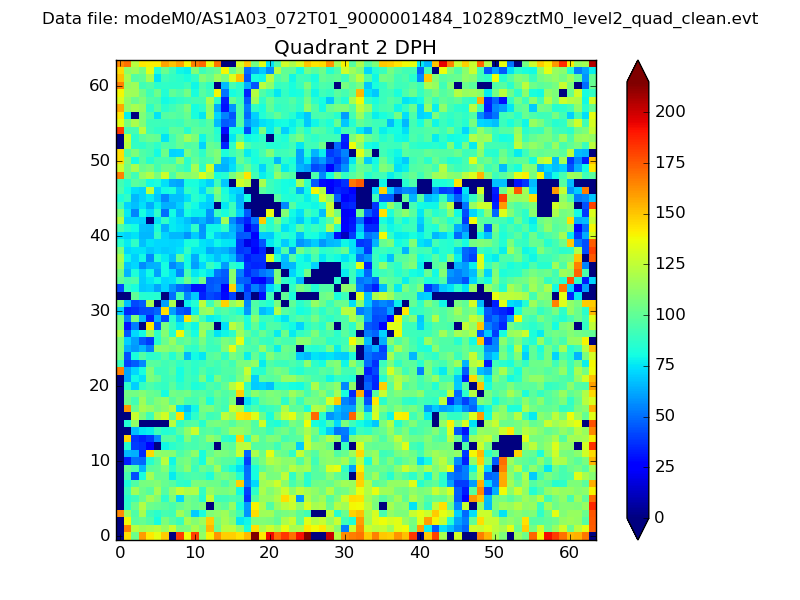 |
Quadrant C |
| Plot type | Count rate plots | Images |
|---|---|---|
| Comparison with Poisson distribution Blue bars denote a histogram of data divided into 1 sec bins. Red curve is a Poisson curve with rate = median count rate of data. |
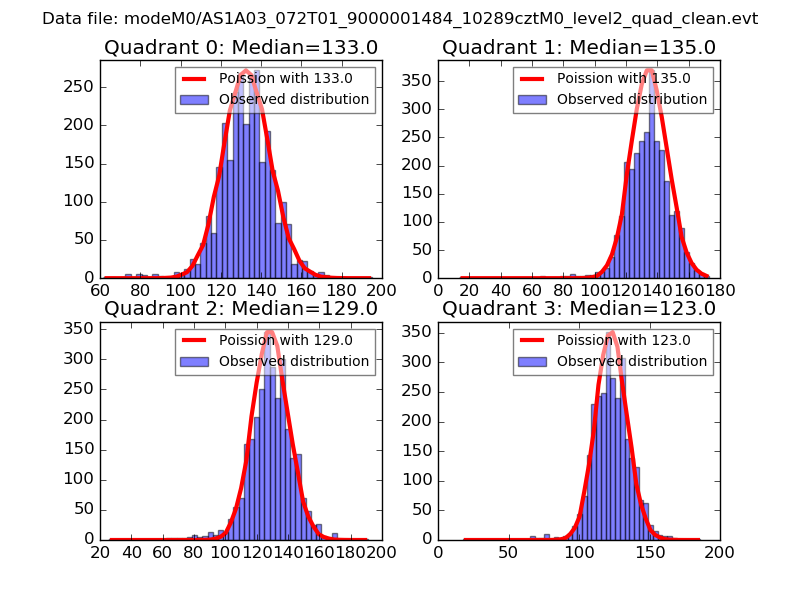 |
 |
| Quadrant-wise count rates Data is divided into 100 sec bins |
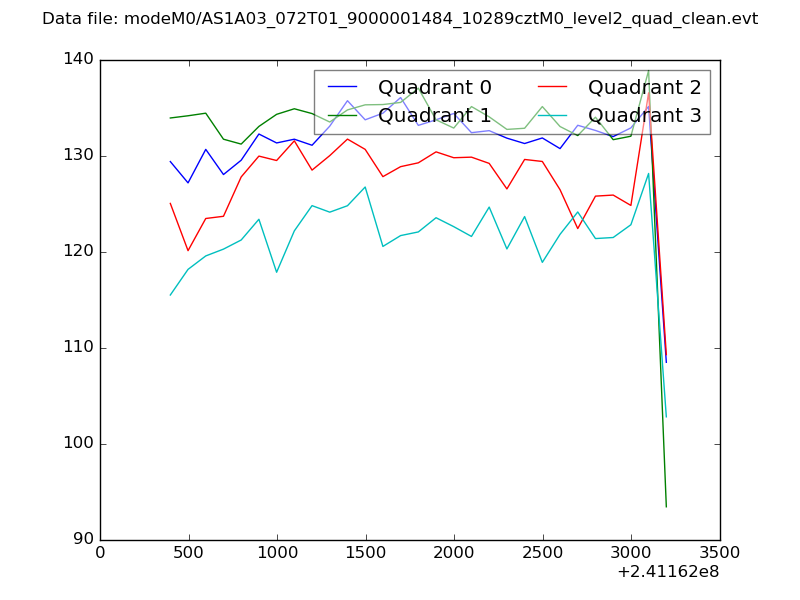 |
|
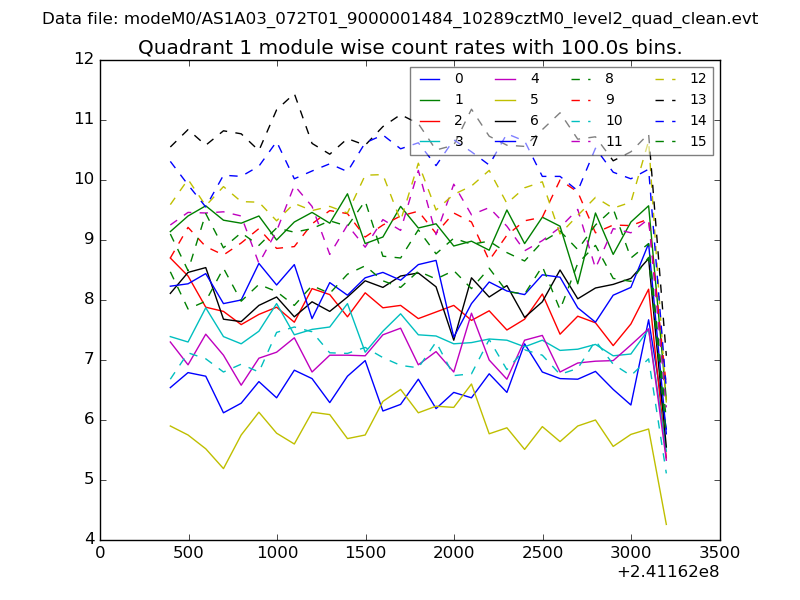
| Module-wise count rates for Quadrant A Data is divided into 100 sec bins |
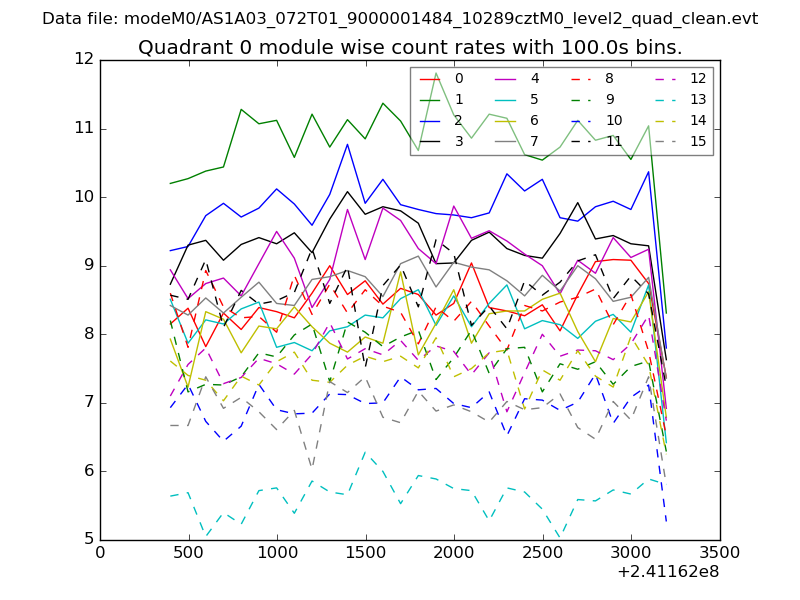 |
 |
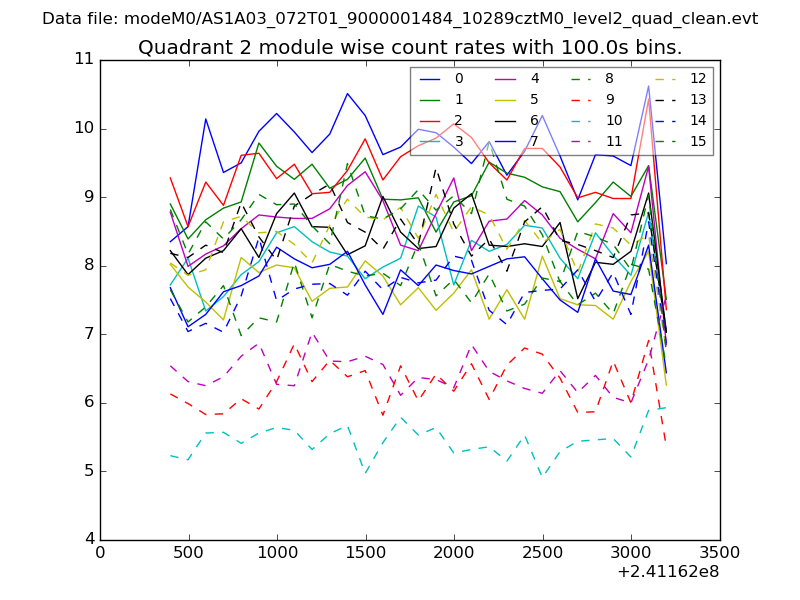
| Module-wise count rates for Quadrant B Data is divided into 100 sec bins |
 |
 |
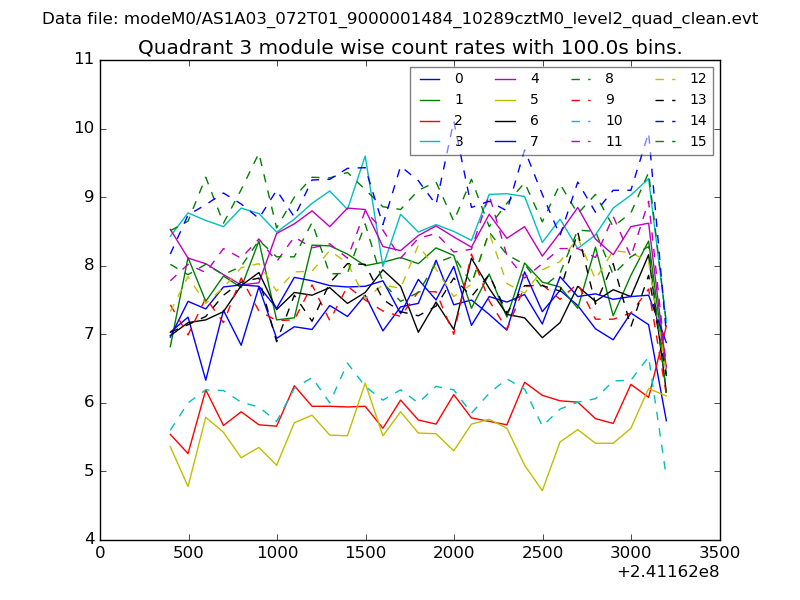
| Module-wise count rates for Quadrant C Data is divided into 100 sec bins |
 |
 |
| Module-wise count rates for Quadrant D Data is divided into 100 sec bins |
 |
 |
| Parameter | Plot |
|---|---|
| CZT HV Monitor | 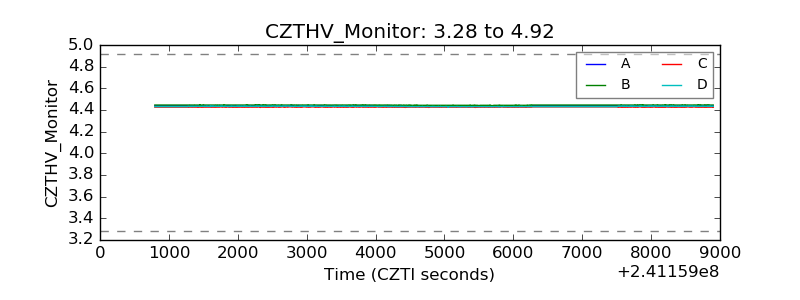 |
| D_VDD | 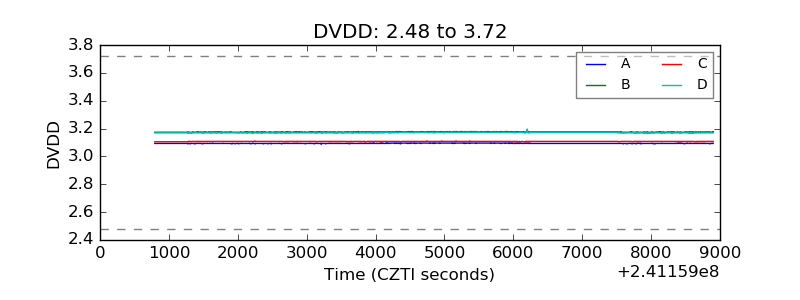 |
| Temperature 1 | 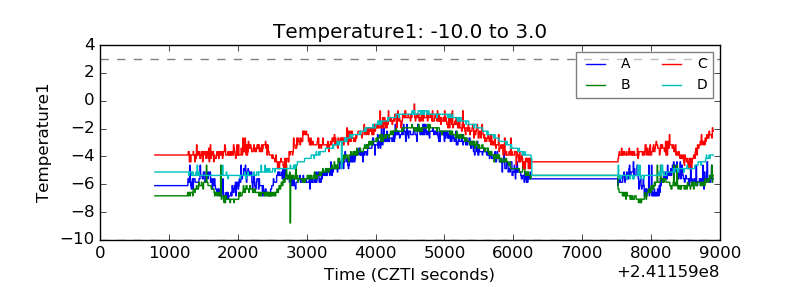 |
| Veto HV Monitor | 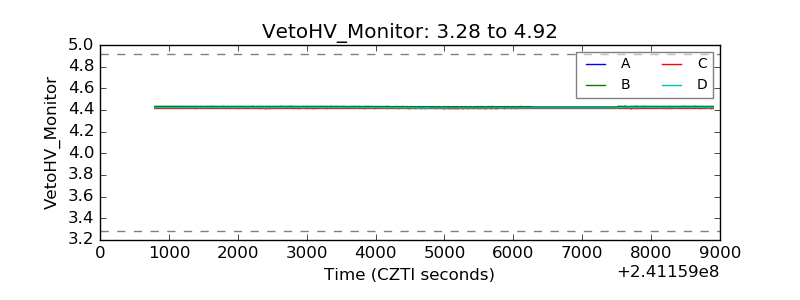 |
| Veto LLD | 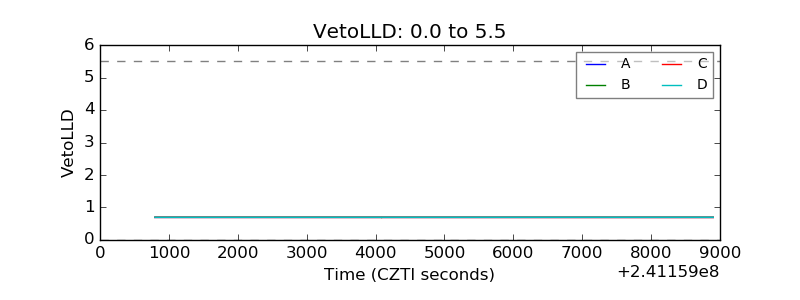 |
| Alpha Counter | 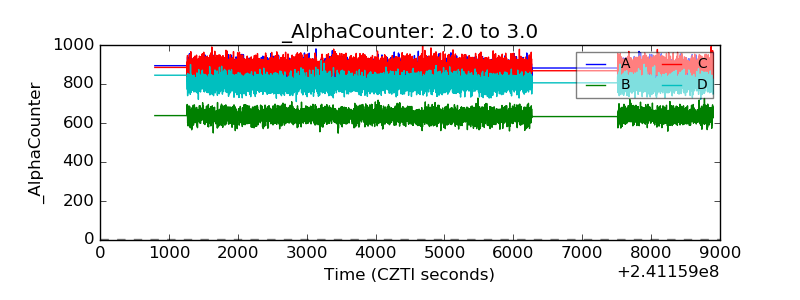 |
| _CPM_Rate | 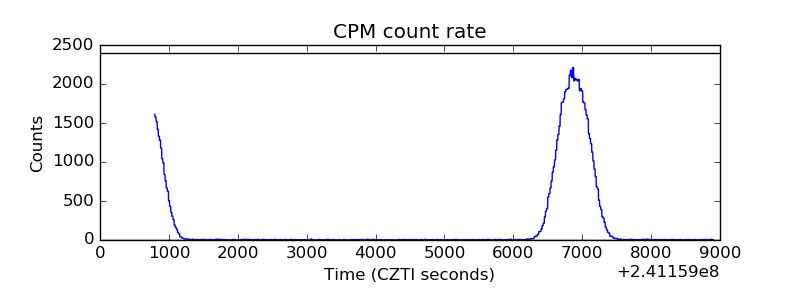 |
| CZT Counter | 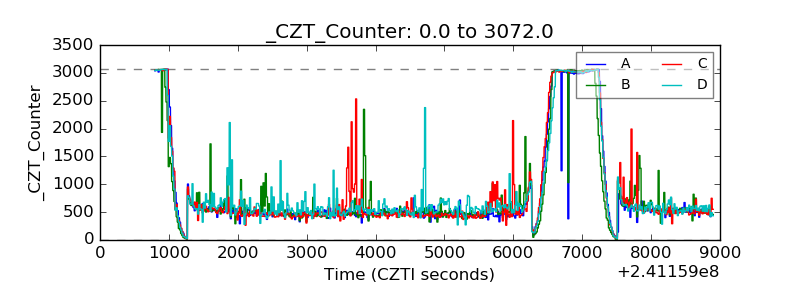 |
| +2.5 Volts monitor |  |
| +5 Volts monitor | 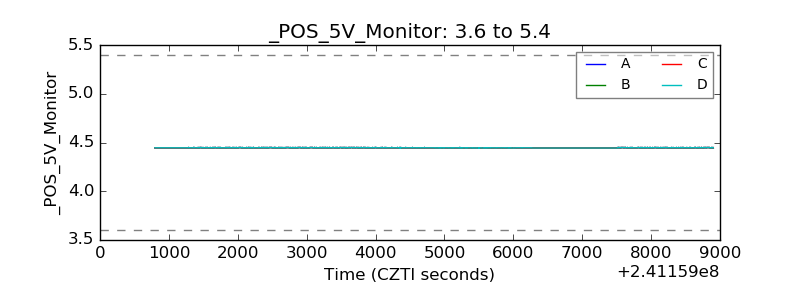 |
| _ROLL_ROT | 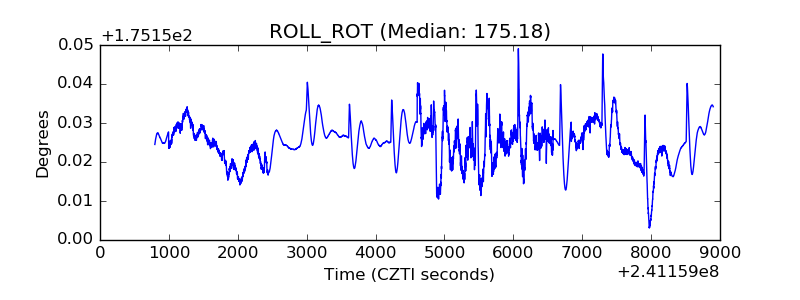 |
| _Roll_DEC |  |
| _Roll_RA | 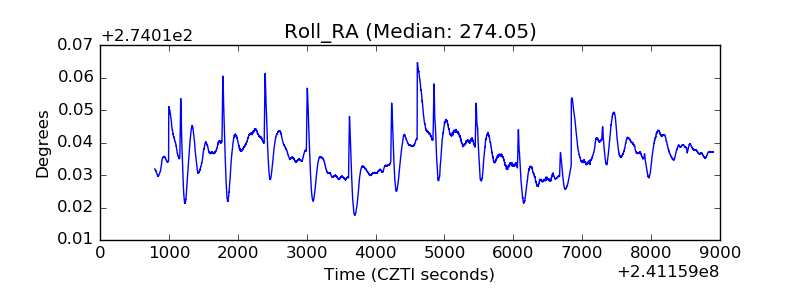 |
| Veto Counter | 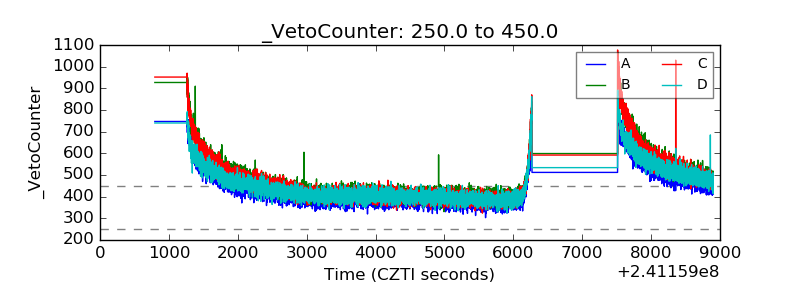 |