| Param | Original file | Final file |
|---|---|---|
| Filename | modeM0/AS1A03_072T01_9000001484_10290cztM0_level2.evt | modeM0/AS1A03_072T01_9000001484_10290cztM0_level2_quad_clean.evt |
| Size (bytes) | 366,431,040 | 58,158,720 |
| Size | 349.5 MB | 55.5 MB |
| Events in quadrant A | 2,596,421 | 358,242 |
| Events in quadrant B | 2,465,078 | 335,108 |
| Events in quadrant C | 2,581,993 | 351,459 |
| Events in quadrant D | 3,109,797 | 363,067 |
| Mode M0 | |||
|---|---|---|---|
| Quadrant | BADHDUFLAG | Total packets | Discarded packets |
| A | 0 | 25037 | 14483 |
| B | 0 | 29680 | 19732 |
| C | 0 | 25981 | 15260 |
| D | 0 | 28870 | 16491 |
| Mode SS | |||
|---|---|---|---|
| Quadrant | BADHDUFLAG | Total packets | Discarded packets |
| A | 0 | 248 | 130 |
| B | 0 | 248 | 136 |
| C | 0 | 248 | 131 |
| D | 0 | 238 | 122 |
| Mode M9 | |||
|---|---|---|---|
| Quadrant | BADHDUFLAG | Total packets | Discarded packets |
| A | 0 | 25 | 8 |
| B | 0 | 30 | 13 |
| C | 0 | 30 | 13 |
| D | 0 | 25 | 7 |
| Quadrant | Total seconds | Saturated seconds | Saturation percentage |
|---|---|---|---|
| A | 5023 | 17 | 0.338443% |
| B | 4494 | 29 | 0.645305% |
| C | 5085 | 45 | 0.884956% |
| D | 5456 | 9 | 0.164956% |
Noise dominated data is calculated using 1-second bins in cleaned event files. If a bin has >2000 counts, and if more than 50% of those come from <1% of pixels, then it is considered to be noise-dominated and hence unusable.
| Quadrant | # 1 sec bins | Bins with >0 counts | Bins with >2000 counts | High rate bins dominated by noise | Noise dominated (total time) | Noise dominated (detector-on time) | Marked lightcurve |
|---|---|---|---|---|---|---|---|
| A | 7551 | 5950 | 0 | 0 | 0.00% | 0.00% |  |
| B | 7551 | 5448 | 1 | 1 | 0.01% | 0.02% | 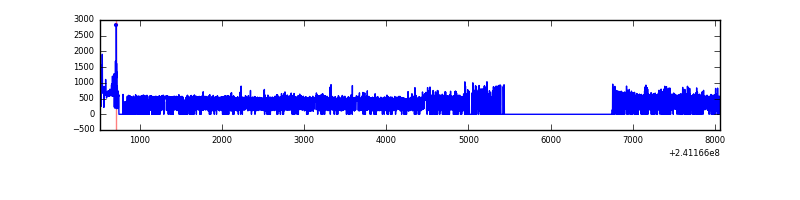 |
| C | 7551 | 5974 | 5 | 5 | 0.07% | 0.08% | 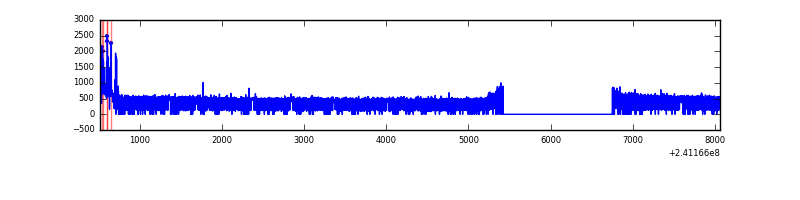 |
| D | 7551 | 5908 | 0 | 0 | 0.00% | 0.00% |  |
Top three noisy pixels from each quadrant. If the there are fewer than three noisy pixels in the level2.evt file, extra rows are filled as -1
| Pixel properties | Quadrant properties | ||||||
|---|---|---|---|---|---|---|---|
| Quadrant | DetID | PixID | Counts | Sigma | Mean | Median | Sigma |
| A | 8 | 5 | 17023 | 122.13 | 667 | 655 | 134.0 |
| A | 0 | 226 | 6139 | 40.92 | 667 | 655 | 134.0 |
| A | 8 | 15 | 6009 | 39.95 | 667 | 655 | 134.0 |
| B | 4 | 239 | 97793 | 876.34 | 593 | 583 | 110.9 |
| B | 11 | 51 | 29923 | 264.5 | 593 | 583 | 110.9 |
| B | 0 | 214 | 17787 | 155.09 | 593 | 583 | 110.9 |
| C | 4 | 254 | 63817 | 428.67 | 645 | 651 | 147.4 |
| C | 13 | 61 | 4842 | 28.44 | 645 | 651 | 147.4 |
| C | 14 | 67 | 1980 | 9.02 | 645 | 651 | 147.4 |
| D | 8 | 195 | 322762 | 1965.32 | 690 | 675 | 163.9 |
| D | 1 | 52 | 75321 | 455.48 | 690 | 675 | 163.9 |
| D | 12 | 233 | 25278 | 150.12 | 690 | 675 | 163.9 |
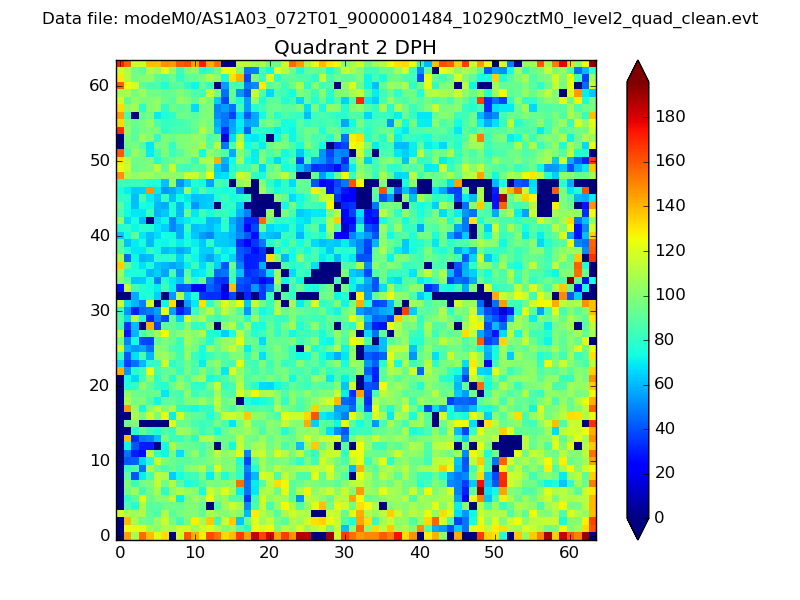
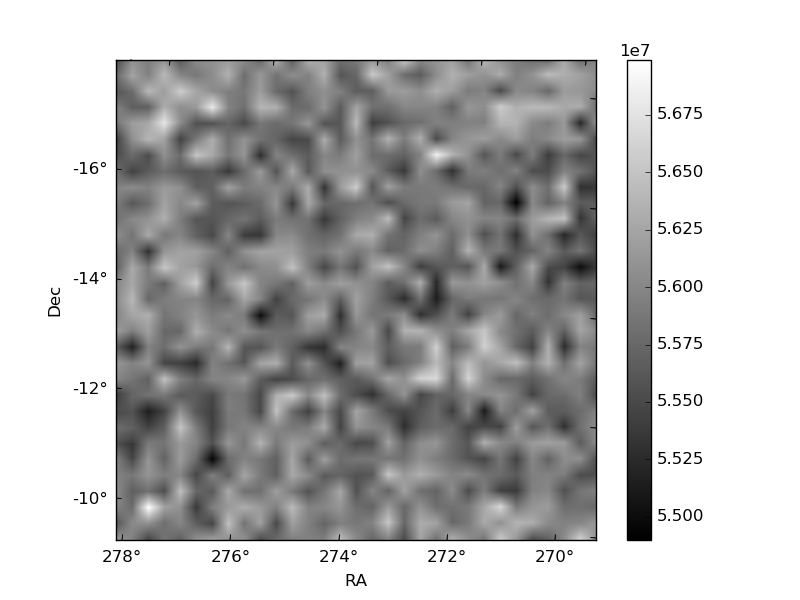
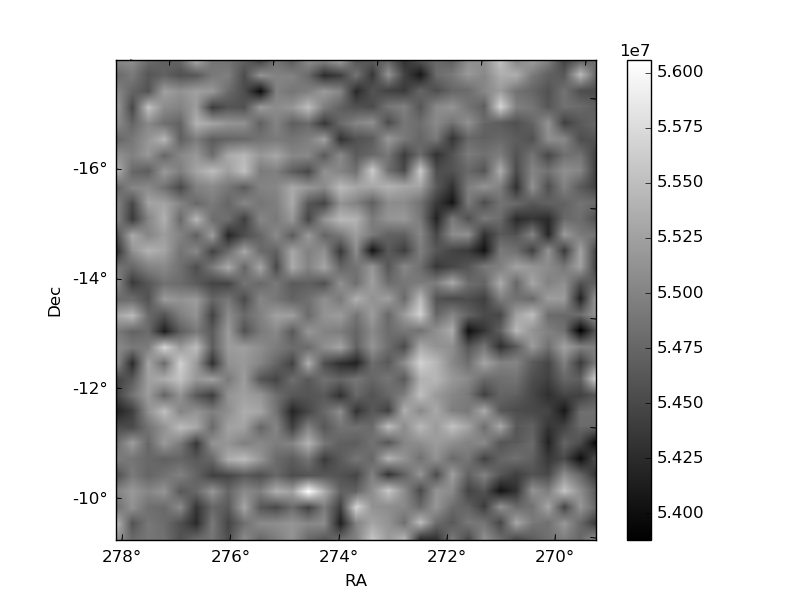
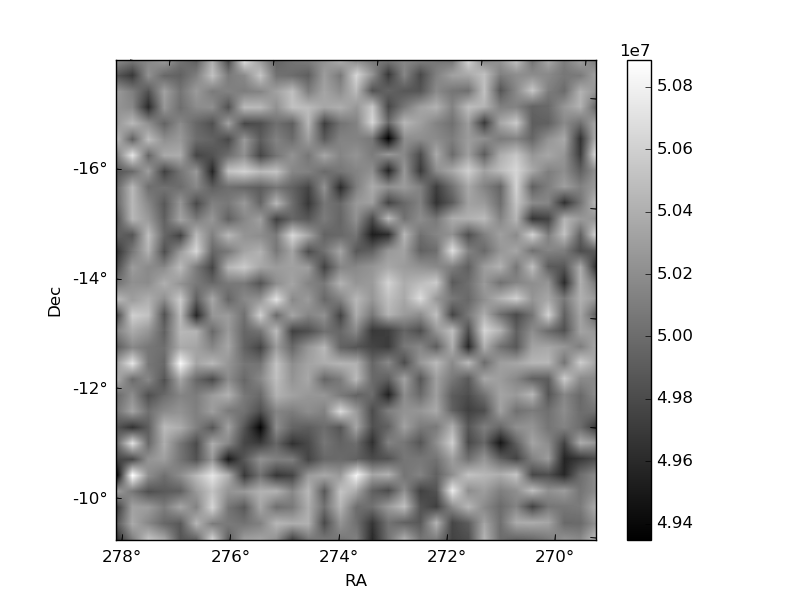
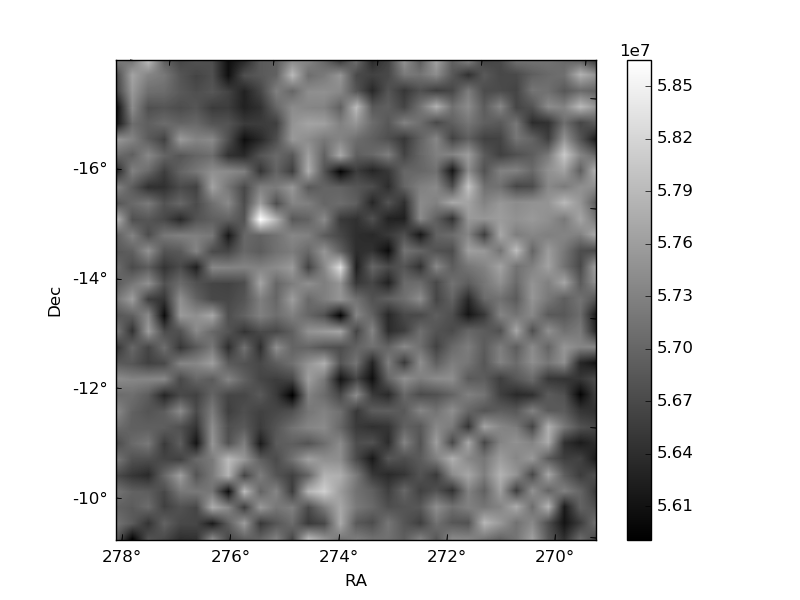
Histogram calculated using DETX and DETY for each event in the final _common_clean file
| Quadrant A | 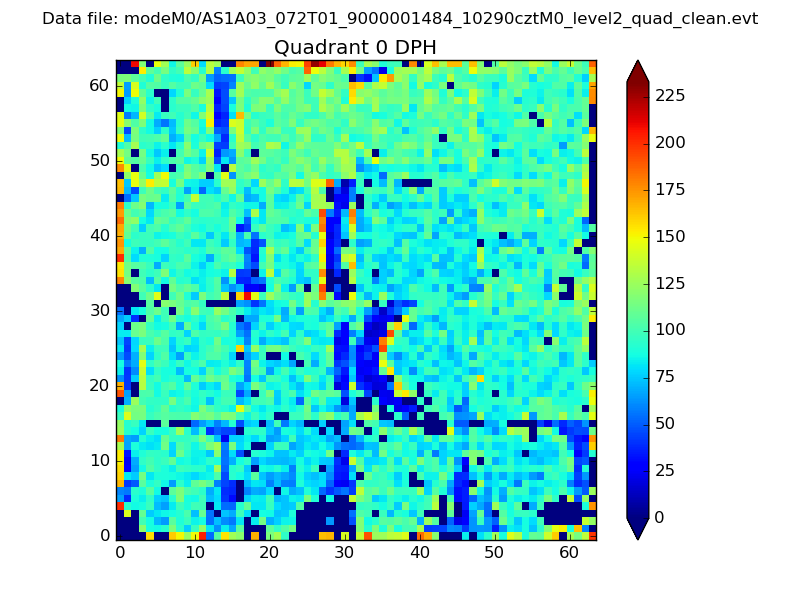 |
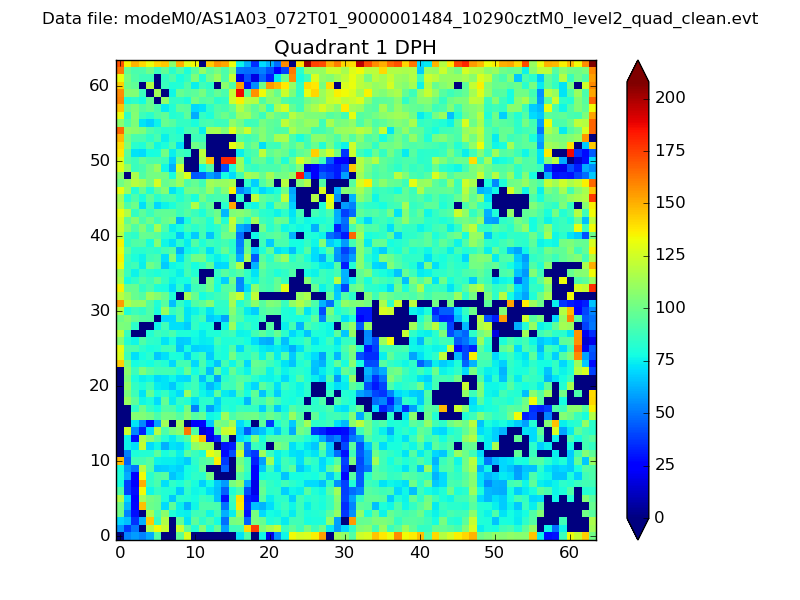 |
Quadrant B |
|---|---|---|---|
| Quadrant D | 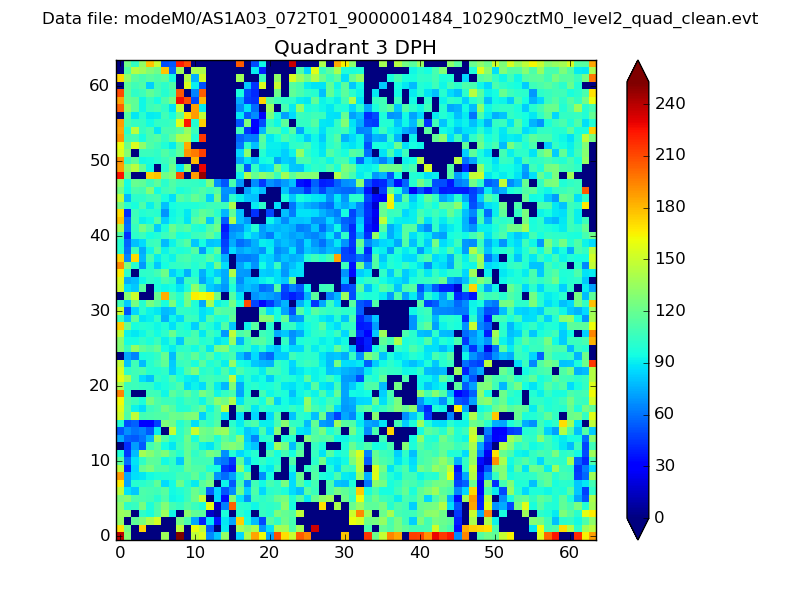 |
 |
Quadrant C |
| Plot type | Count rate plots | Images |
|---|---|---|
| Comparison with Poisson distribution Blue bars denote a histogram of data divided into 1 sec bins. Red curve is a Poisson curve with rate = median count rate of data. |
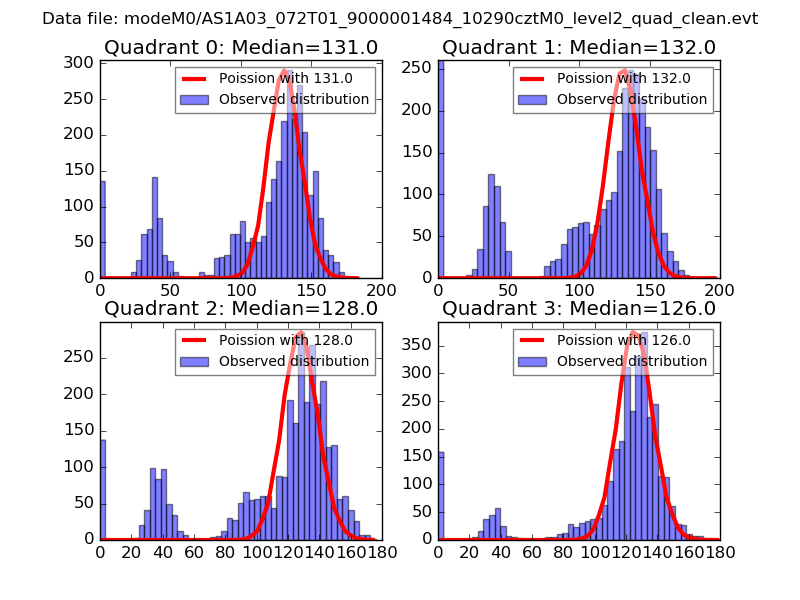 |
 |
| Quadrant-wise count rates Data is divided into 100 sec bins |
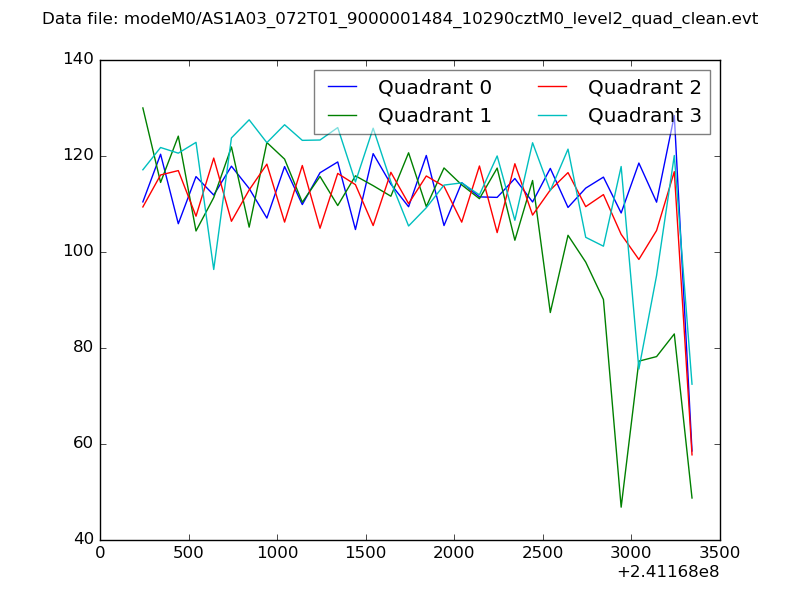 |
|
| Module-wise count rates for Quadrant A Data is divided into 100 sec bins |
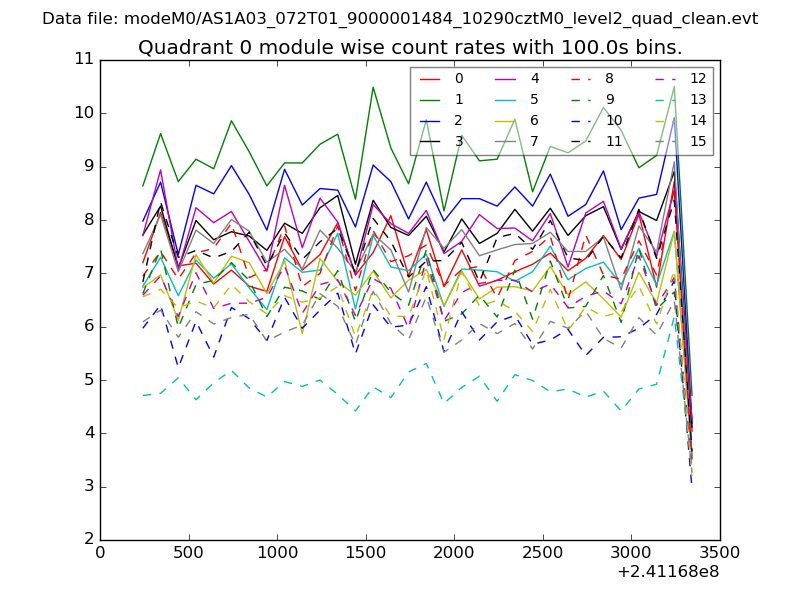 |
 |
| Module-wise count rates for Quadrant B Data is divided into 100 sec bins |
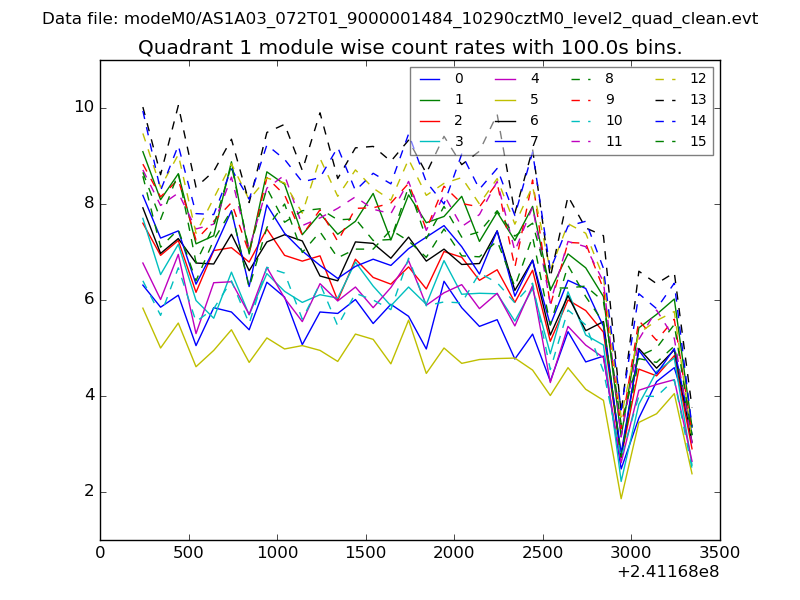 |
 |
| Module-wise count rates for Quadrant C Data is divided into 100 sec bins |
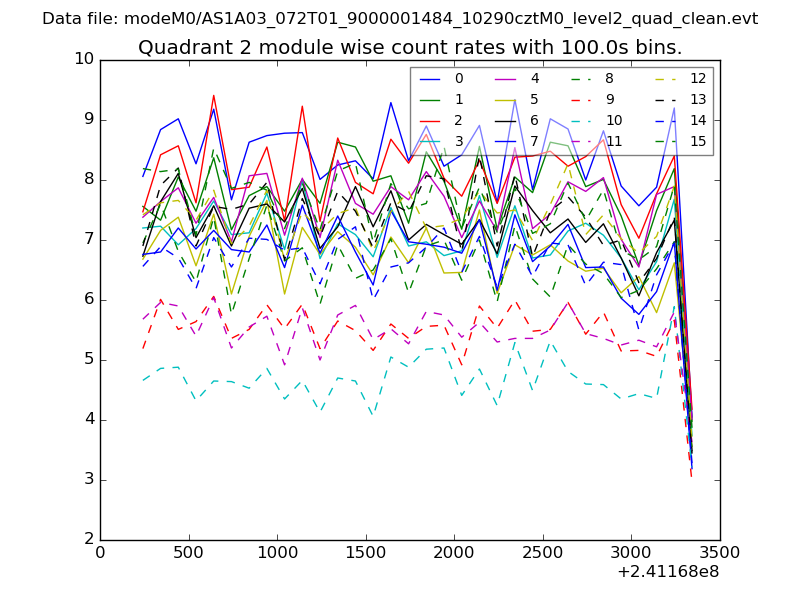 |
 |
| Module-wise count rates for Quadrant D Data is divided into 100 sec bins |
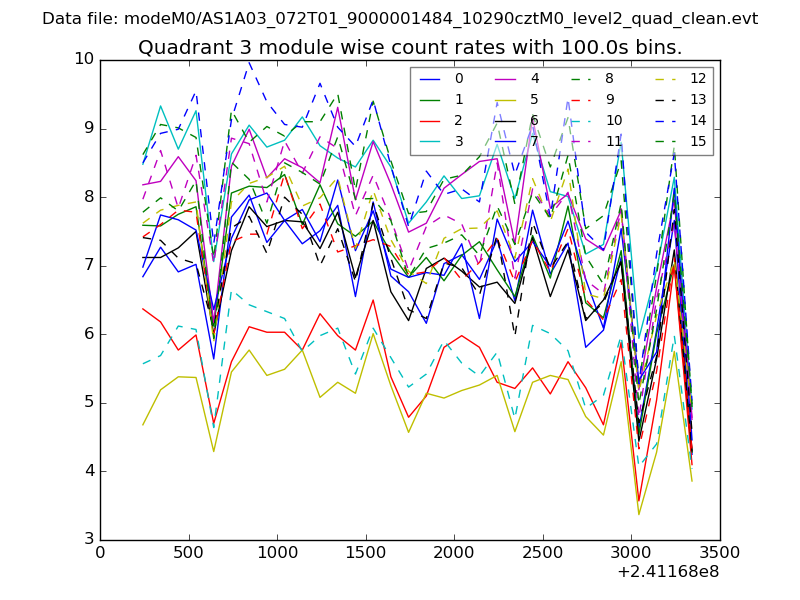 |
 |
| Parameter | Plot |
|---|---|
| CZT HV Monitor | 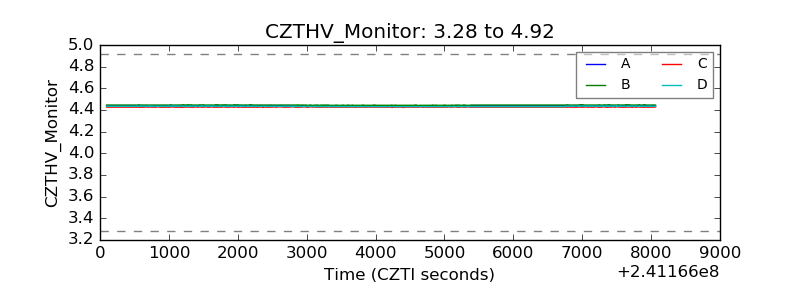 |
| D_VDD | 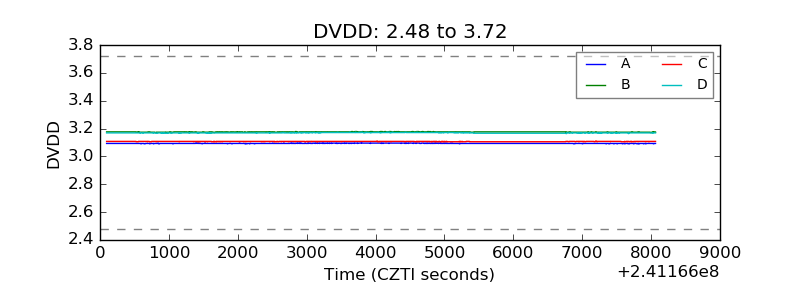 |
| Temperature 1 | 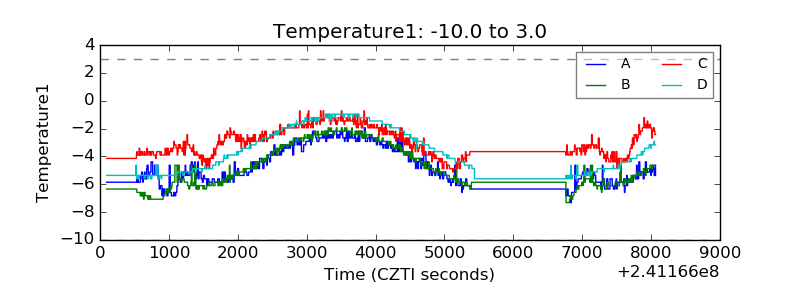 |
| Veto HV Monitor |  |
| Veto LLD | 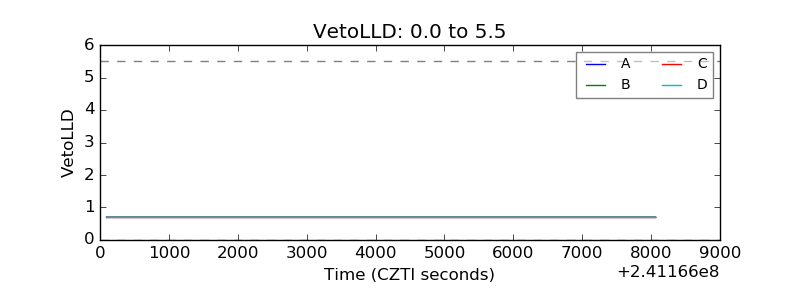 |
| Alpha Counter | 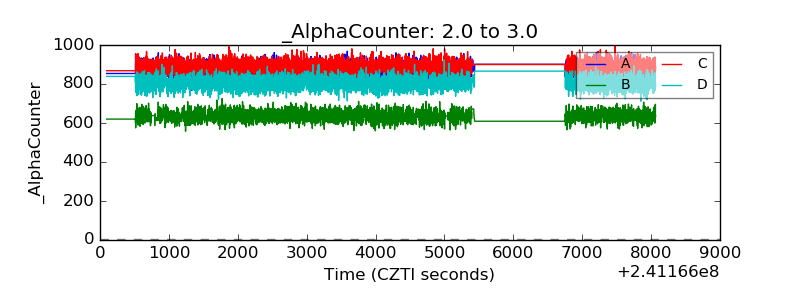 |
| _CPM_Rate | 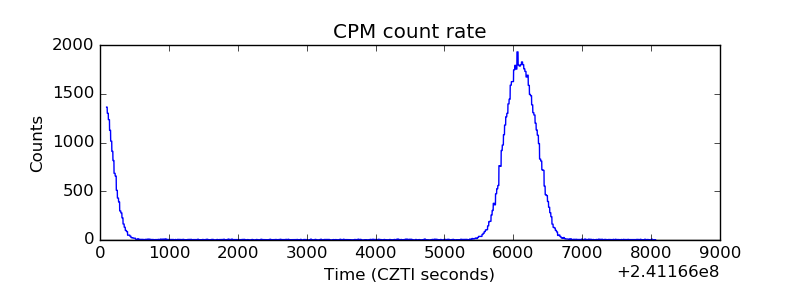 |
| CZT Counter | 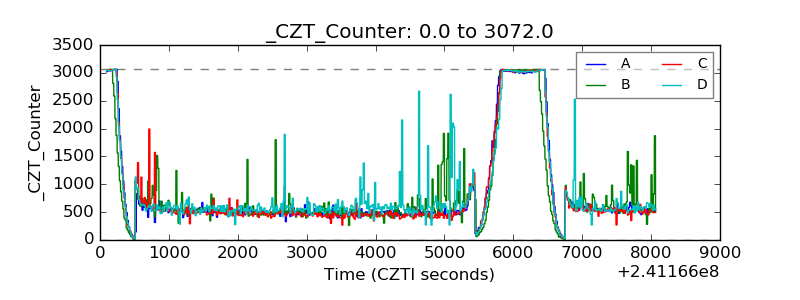 |
| +2.5 Volts monitor |  |
| +5 Volts monitor |  |
| _ROLL_ROT | 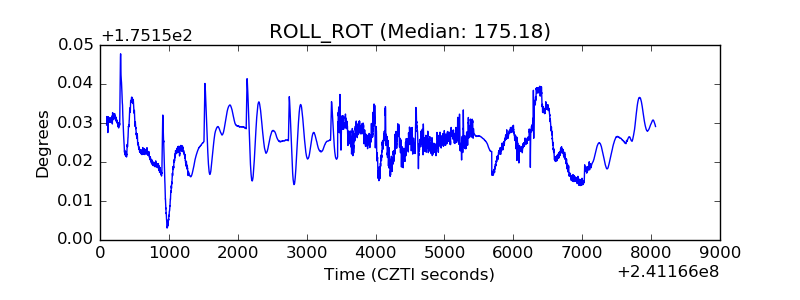 |
| _Roll_DEC | 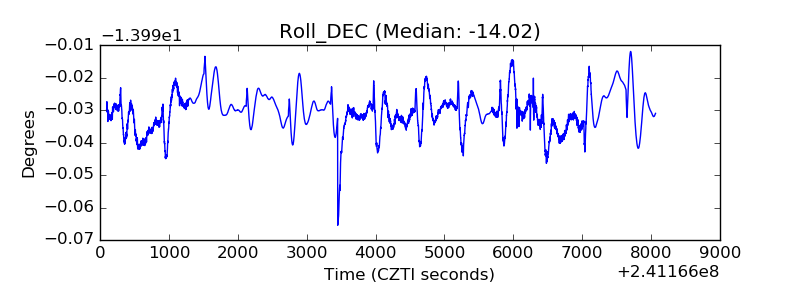 |
| _Roll_RA | 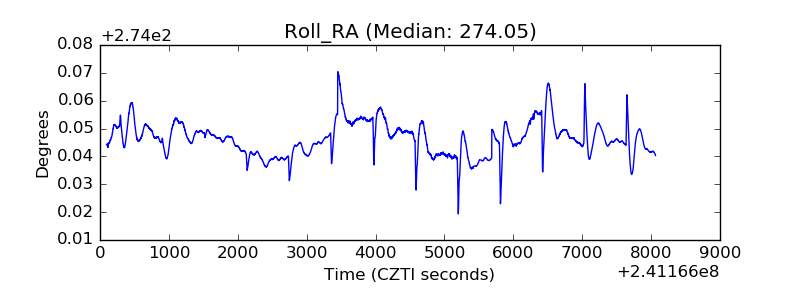 |
| Veto Counter | 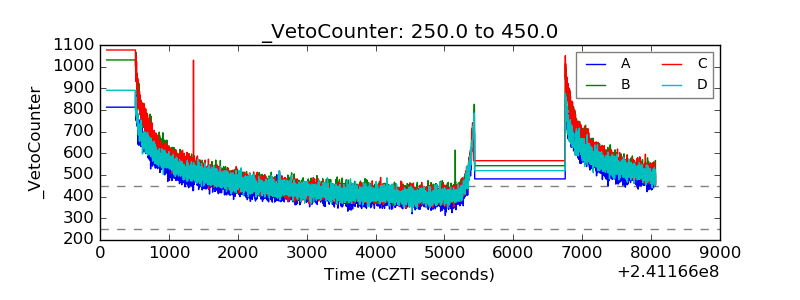 |