| Param | Original file | Final file |
|---|---|---|
| Filename | modeM0/AS1A03_072T01_9000001484_10291cztM0_level2.evt | modeM0/AS1A03_072T01_9000001484_10291cztM0_level2_quad_clean.evt |
| Size (bytes) | 517,383,360 | 84,890,880 |
| Size | 493.4 MB | 81.0 MB |
| Events in quadrant A | 3,946,800 | 546,631 |
| Events in quadrant B | 3,926,775 | 552,480 |
| Events in quadrant C | 3,693,476 | 526,222 |
| Events in quadrant D | 3,682,033 | 513,059 |
| Mode M0 | |||
|---|---|---|---|
| Quadrant | BADHDUFLAG | Total packets | Discarded packets |
| A | 0 | 15464 | 13 |
| B | 0 | 15563 | 6 |
| C | 0 | 14760 | 18 |
| D | 0 | 14847 | 10 |
| Mode SS | |||
|---|---|---|---|
| Quadrant | BADHDUFLAG | Total packets | Discarded packets |
| A | 0 | 124 | 0 |
| B | 0 | 124 | 0 |
| C | 0 | 124 | 0 |
| D | 0 | 124 | 0 |
| Mode M9 | |||
|---|---|---|---|
| Quadrant | BADHDUFLAG | Total packets | Discarded packets |
| A | 0 | 17 | 0 |
| B | 0 | 17 | 0 |
| C | 0 | 17 | 0 |
| D | 0 | 18 | 0 |
| Quadrant | Total seconds | Saturated seconds | Saturation percentage |
|---|---|---|---|
| A | 6197 | 390 | 6.293368% |
| B | 6200 | 223 | 3.596774% |
| C | 6194 | 256 | 4.133032% |
| D | 6198 | 110 | 1.774766% |
Noise dominated data is calculated using 1-second bins in cleaned event files. If a bin has >2000 counts, and if more than 50% of those come from <1% of pixels, then it is considered to be noise-dominated and hence unusable.
| Quadrant | # 1 sec bins | Bins with >0 counts | Bins with >2000 counts | High rate bins dominated by noise | Noise dominated (total time) | Noise dominated (detector-on time) | Marked lightcurve |
|---|---|---|---|---|---|---|---|
| A | 7517 | 6202 | 265 | 265 | 3.53% | 4.27% | 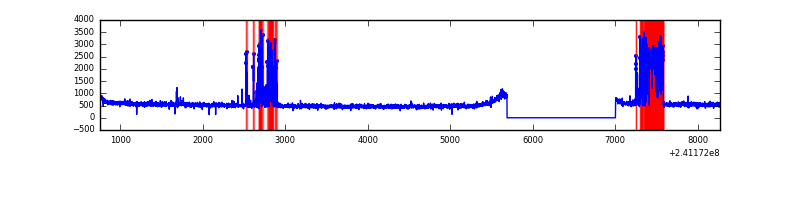 |
| B | 7517 | 6202 | 59 | 59 | 0.78% | 0.95% | 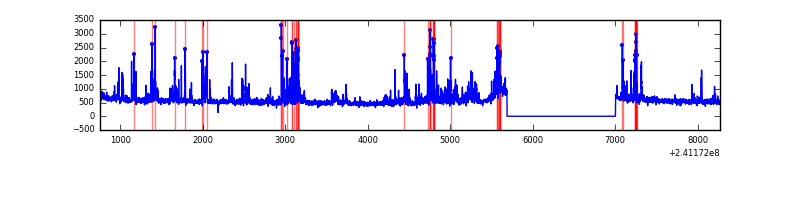 |
| C | 7517 | 6202 | 103 | 103 | 1.37% | 1.66% | 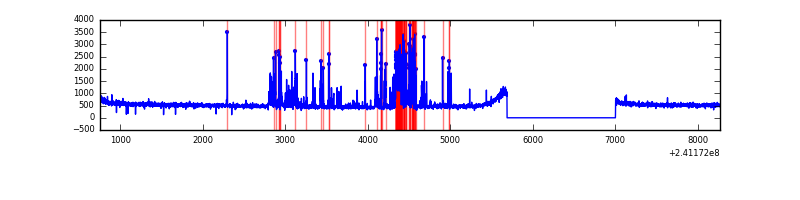 |
| D | 7517 | 6202 | 18 | 18 | 0.24% | 0.29% | 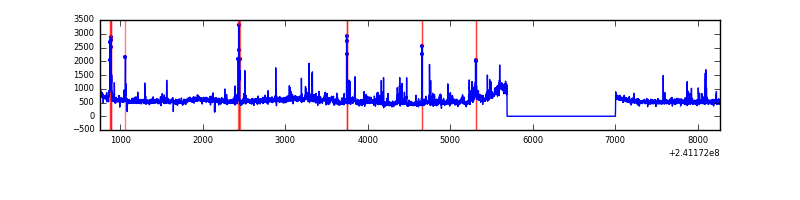 |
Top three noisy pixels from each quadrant. If the there are fewer than three noisy pixels in the level2.evt file, extra rows are filled as -1
| Pixel properties | Quadrant properties | ||||||
|---|---|---|---|---|---|---|---|
| Quadrant | DetID | PixID | Counts | Sigma | Mean | Median | Sigma |
| A | 5 | 16 | 800041 | 4838.93 | 815 | 801 | 165.2 |
| A | 8 | 5 | 8366 | 45.8 | 815 | 801 | 165.2 |
| A | 0 | 226 | 7586 | 41.08 | 815 | 801 | 165.2 |
| B | 4 | 239 | 424092 | 2725.18 | 825 | 809 | 155.3 |
| B | 4 | 81 | 130295 | 833.66 | 825 | 809 | 155.3 |
| B | 11 | 51 | 79587 | 507.19 | 825 | 809 | 155.3 |
| C | 4 | 254 | 587712 | 3204.79 | 793 | 800 | 183.1 |
| C | 14 | 234 | 8560 | 42.37 | 793 | 800 | 183.1 |
| C | 13 | 61 | 5887 | 27.77 | 793 | 800 | 183.1 |
| D | 8 | 195 | 288811 | 1506.99 | 802 | 783 | 191.1 |
| D | 2 | 33 | 89253 | 462.88 | 802 | 783 | 191.1 |
| D | 1 | 20 | 69096 | 357.42 | 802 | 783 | 191.1 |
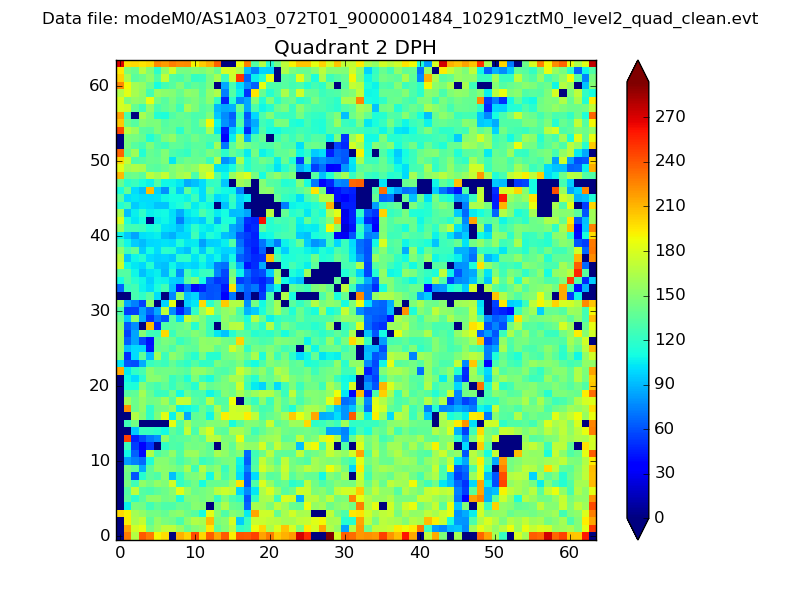
Histogram calculated using DETX and DETY for each event in the final _common_clean file
| Quadrant A | 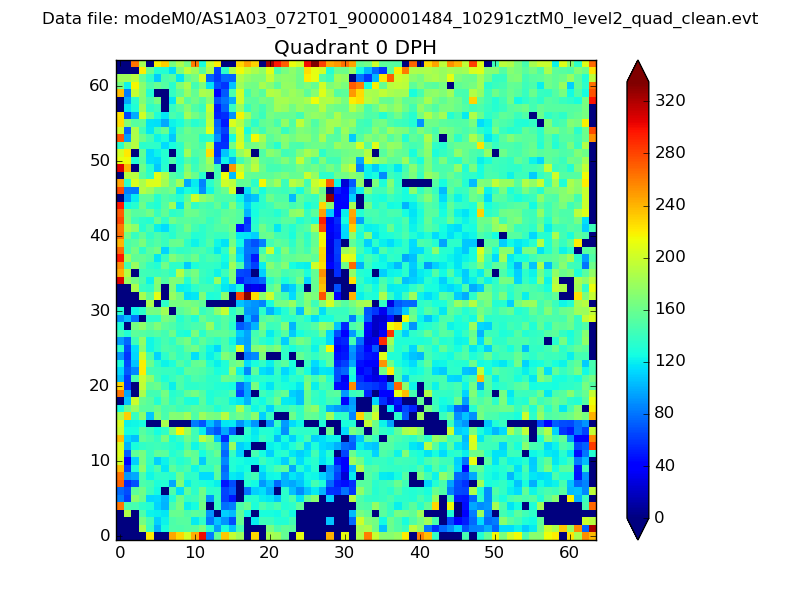 |
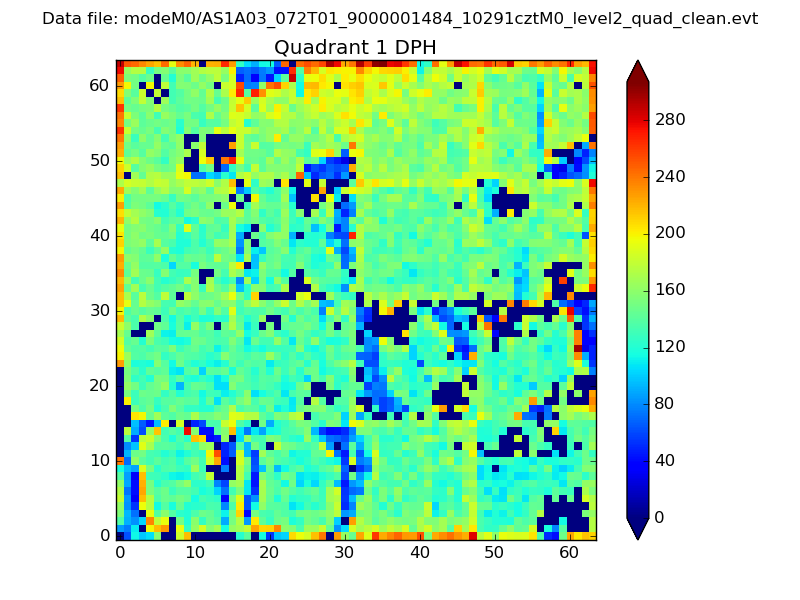 |
Quadrant B |
|---|---|---|---|
| Quadrant D | 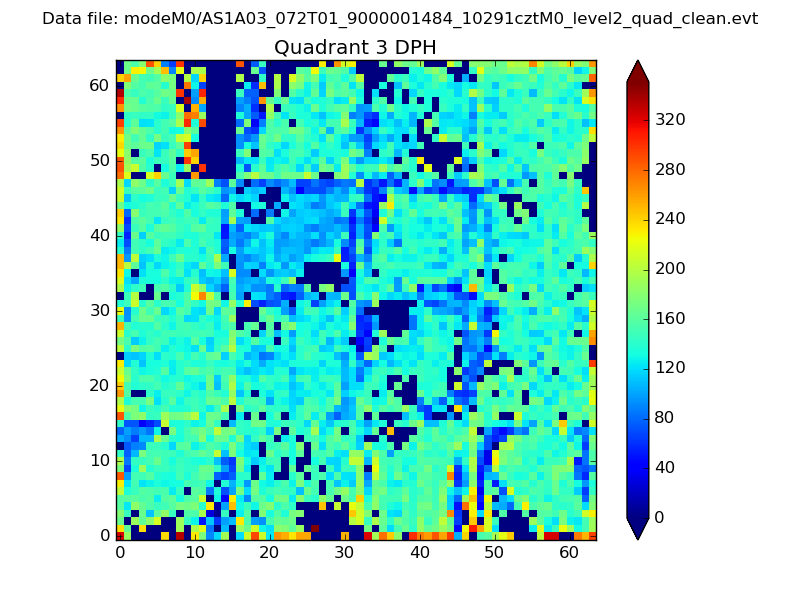 |
 |
Quadrant C |
| Plot type | Count rate plots | Images |
|---|---|---|
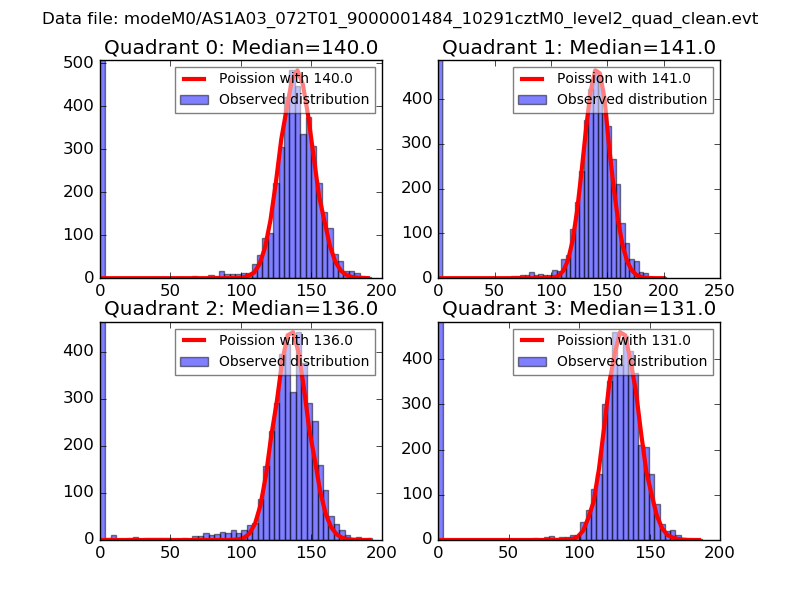
| Comparison with Poisson distribution Blue bars denote a histogram of data divided into 1 sec bins. Red curve is a Poisson curve with rate = median count rate of data. |
 |
 |
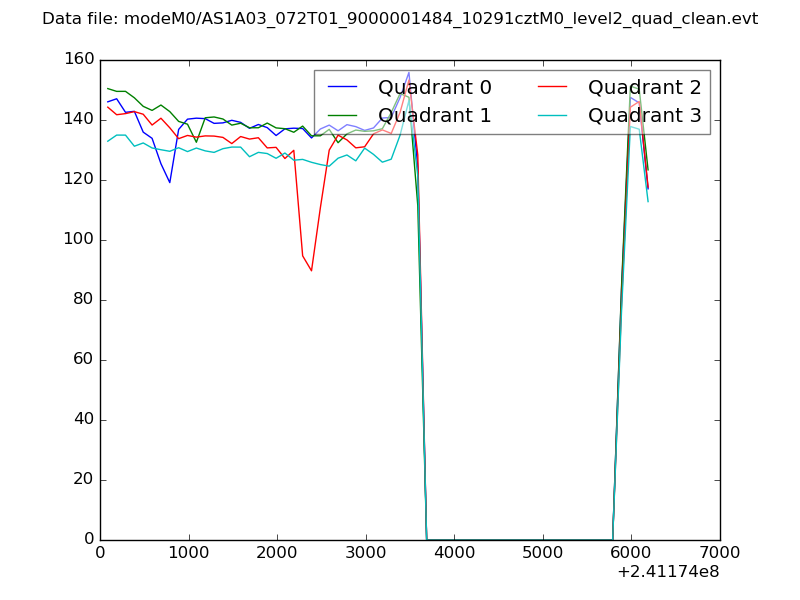
| Quadrant-wise count rates Data is divided into 100 sec bins |
 |
|
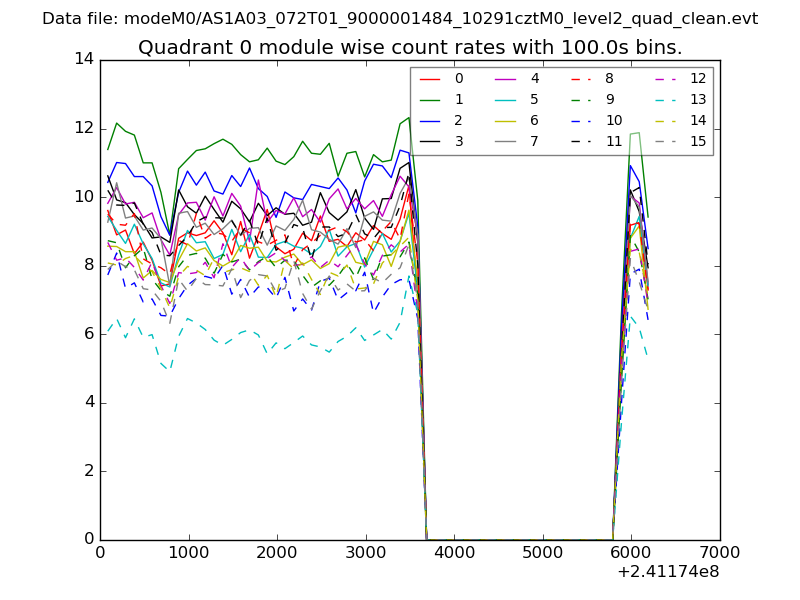
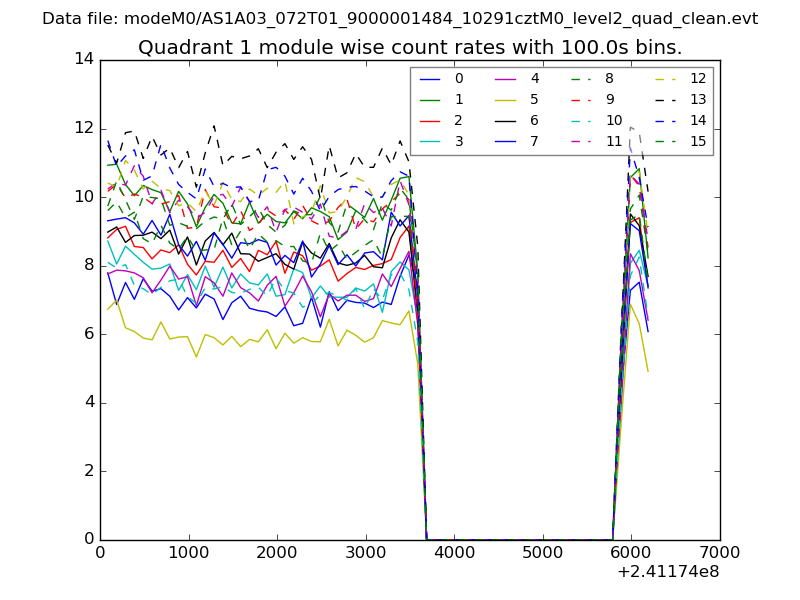
| Module-wise count rates for Quadrant A Data is divided into 100 sec bins |
 |
 |
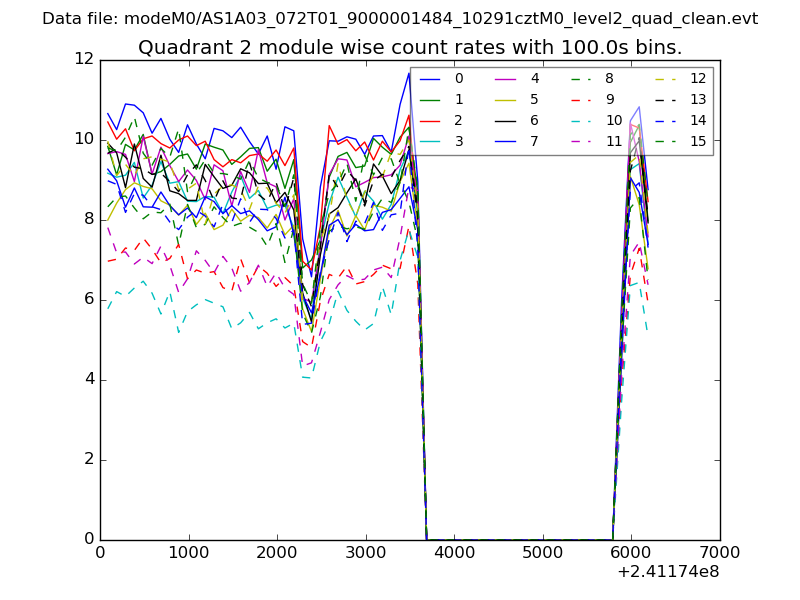
| Module-wise count rates for Quadrant B Data is divided into 100 sec bins |
 |
 |
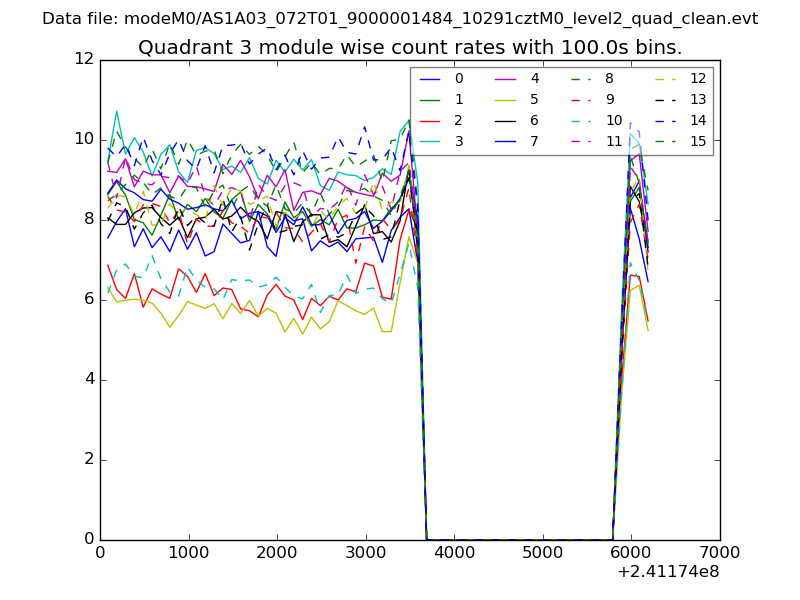
| Module-wise count rates for Quadrant C Data is divided into 100 sec bins |
 |
 |
| Module-wise count rates for Quadrant D Data is divided into 100 sec bins |
 |
 |
| Parameter | Plot |
|---|---|
| CZT HV Monitor | 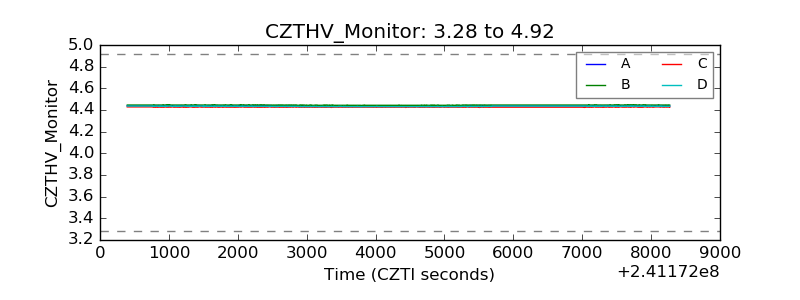 |
| D_VDD | 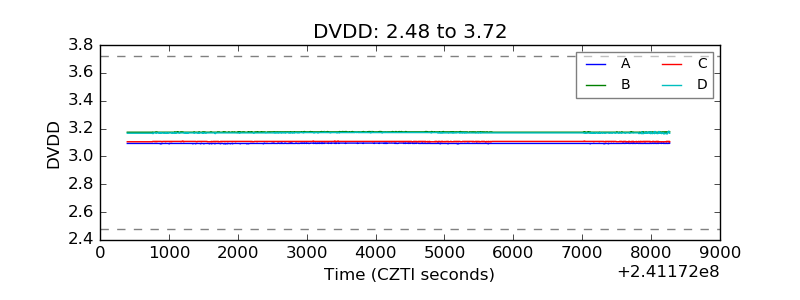 |
| Temperature 1 | 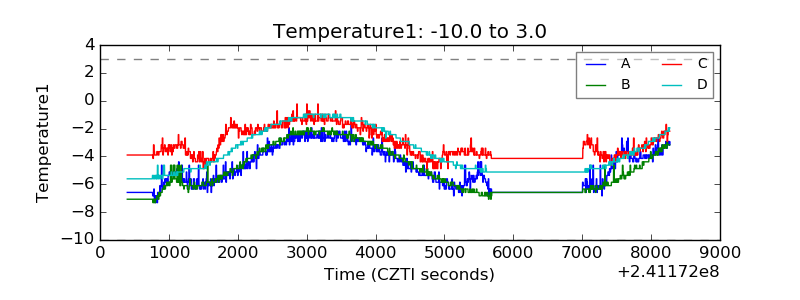 |
| Veto HV Monitor | 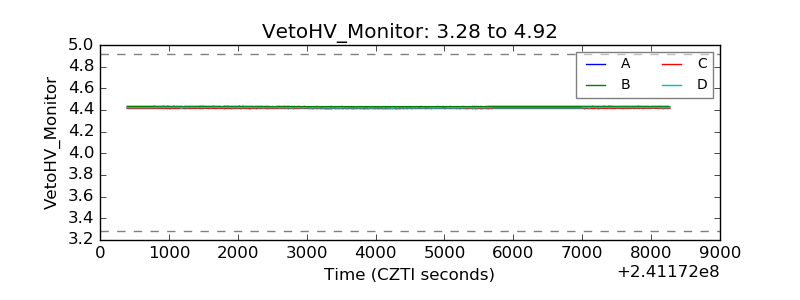 |
| Veto LLD | 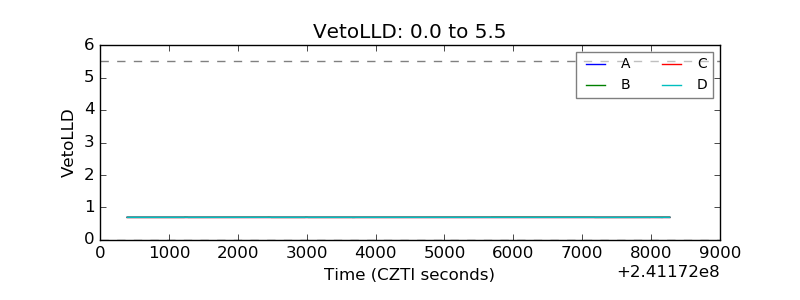 |
| Alpha Counter | 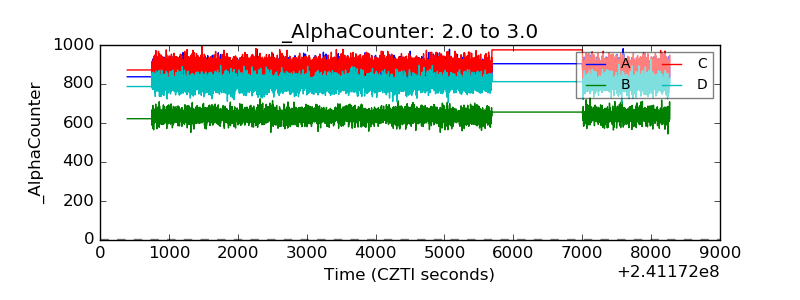 |
| _CPM_Rate | 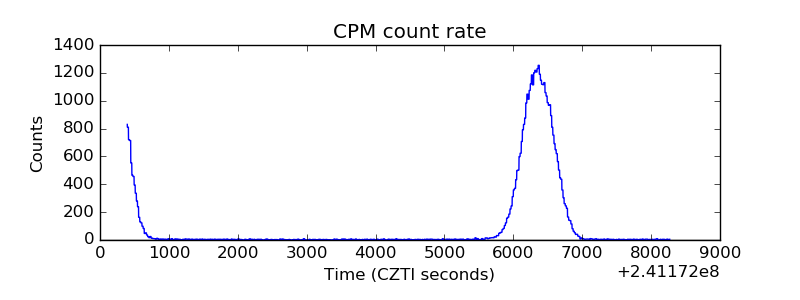 |
| CZT Counter | 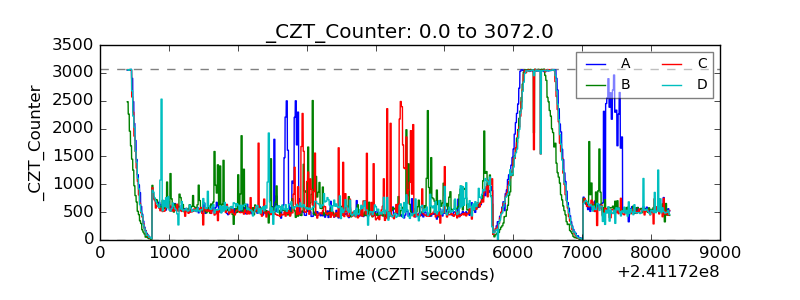 |
| +2.5 Volts monitor | 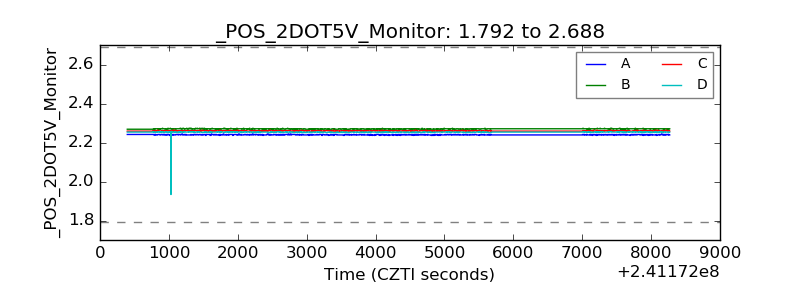 |
| +5 Volts monitor | 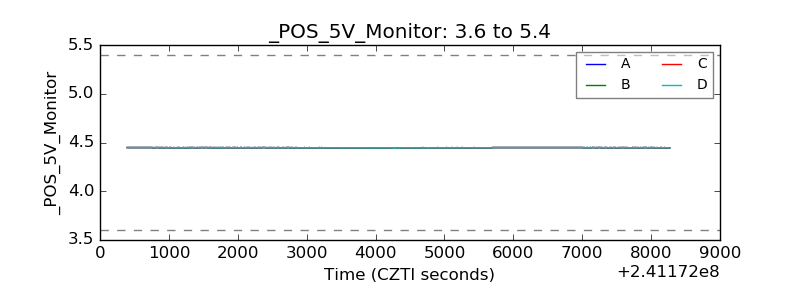 |
| _ROLL_ROT | 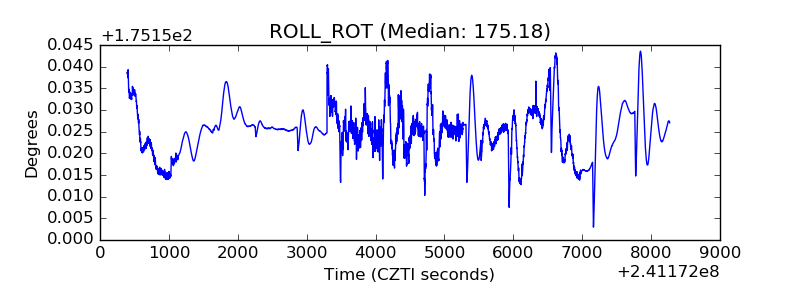 |
| _Roll_DEC | 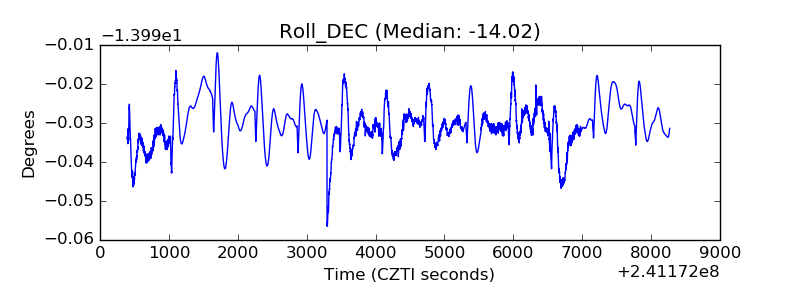 |
| _Roll_RA | 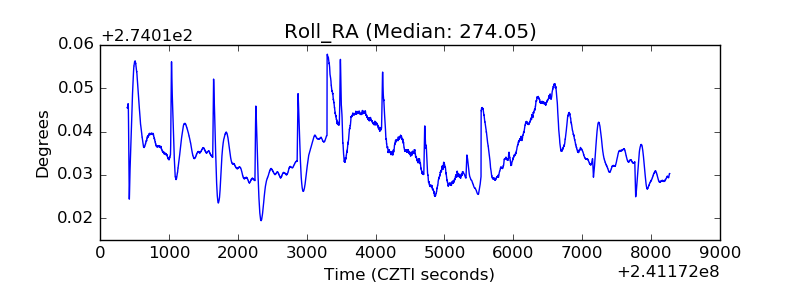 |
| Veto Counter | 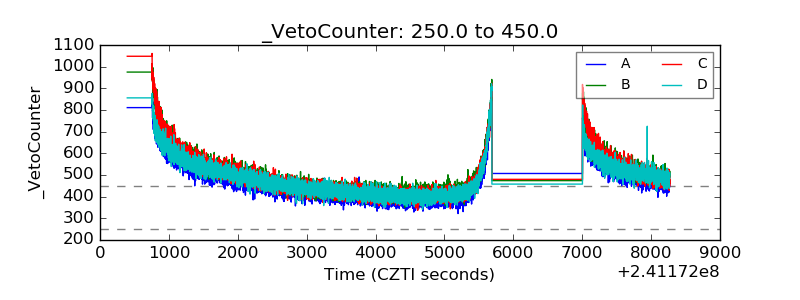 |