| Param | Original file | Final file |
|---|---|---|
| Filename | modeM0/AS1A03_072T01_9000001484_10292cztM0_level2.evt | modeM0/AS1A03_072T01_9000001484_10292cztM0_level2_quad_clean.evt |
| Size (bytes) | 335,312,640 | 68,503,680 |
| Size | 319.8 MB | 65.3 MB |
| Events in quadrant A | 2,750,919 | 461,923 |
| Events in quadrant B | 2,301,832 | 423,966 |
| Events in quadrant C | 2,429,899 | 484,792 |
| Events in quadrant D | 2,353,529 | 375,989 |
| Mode M0 | |||
|---|---|---|---|
| Quadrant | BADHDUFLAG | Total packets | Discarded packets |
| A | 0 | 28280 | 17504 |
| B | 0 | 27921 | 18708 |
| C | 0 | 24811 | 14468 |
| D | 0 | 32851 | 23661 |
| Mode SS | |||
|---|---|---|---|
| Quadrant | BADHDUFLAG | Total packets | Discarded packets |
| A | 0 | 240 | 122 |
| B | 0 | 240 | 118 |
| C | 0 | 240 | 123 |
| D | 0 | 227 | 112 |
| Mode M9 | |||
|---|---|---|---|
| Quadrant | BADHDUFLAG | Total packets | Discarded packets |
| A | 0 | 21 | 8 |
| B | 0 | 25 | 12 |
| C | 0 | 25 | 12 |
| D | 0 | 25 | 11 |
| Quadrant | Total seconds | Saturated seconds | Saturation percentage |
|---|---|---|---|
| A | 4559 | 238 | 5.220443% |
| B | 4362 | 28 | 0.641907% |
| C | 5097 | 8 | 0.156955% |
| D | 4404 | 13 | 0.295186% |
Noise dominated data is calculated using 1-second bins in cleaned event files. If a bin has >2000 counts, and if more than 50% of those come from <1% of pixels, then it is considered to be noise-dominated and hence unusable.
| Quadrant | # 1 sec bins | Bins with >0 counts | Bins with >2000 counts | High rate bins dominated by noise | Noise dominated (total time) | Noise dominated (detector-on time) | Marked lightcurve |
|---|---|---|---|---|---|---|---|
| A | 7546 | 5355 | 207 | 207 | 2.74% | 3.87% | 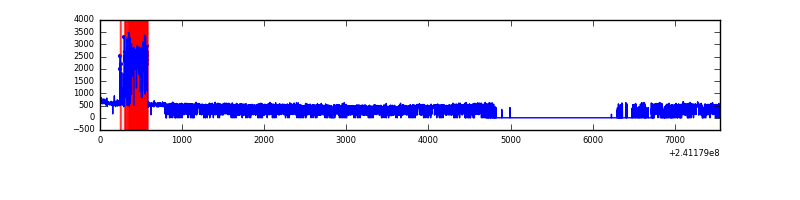 |
| B | 7545 | 5250 | 13 | 13 | 0.17% | 0.25% | 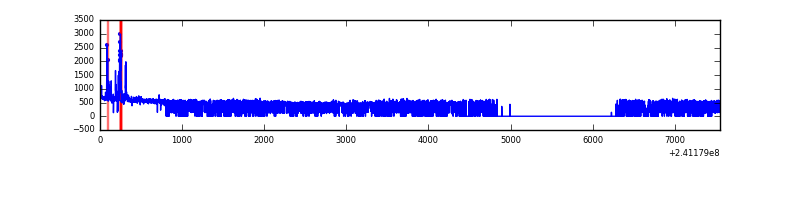 |
| C | 7546 | 5875 | 0 | 0 | 0.00% | 0.00% | 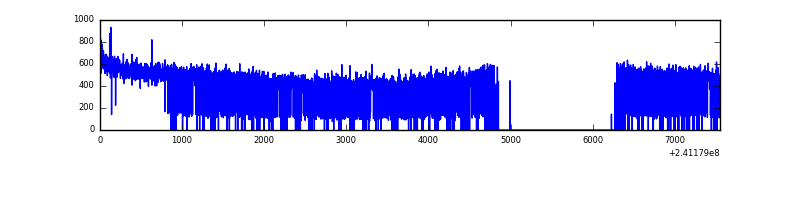 |
| D | 7546 | 5002 | 0 | 0 | 0.00% | 0.00% |  |
Top three noisy pixels from each quadrant. If the there are fewer than three noisy pixels in the level2.evt file, extra rows are filled as -1
| Pixel properties | Quadrant properties | ||||||
|---|---|---|---|---|---|---|---|
| Quadrant | DetID | PixID | Counts | Sigma | Mean | Median | Sigma |
| A | 5 | 16 | 554395 | 4933.19 | 558 | 548 | 112.3 |
| A | 8 | 15 | 43356 | 381.3 | 558 | 548 | 112.3 |
| A | 0 | 226 | 5120 | 40.72 | 558 | 548 | 112.3 |
| B | 4 | 239 | 101842 | 969.7 | 551 | 541 | 104.5 |
| B | 11 | 51 | 30952 | 291.11 | 551 | 541 | 104.5 |
| B | 0 | 214 | 18483 | 171.75 | 551 | 541 | 104.5 |
| C | 13 | 61 | 4652 | 28.02 | 622 | 627 | 143.6 |
| C | 8 | 222 | 2205 | 10.99 | 622 | 627 | 143.6 |
| C | 14 | 234 | 1629 | 6.98 | 622 | 627 | 143.6 |
| D | 8 | 195 | 153922 | 1167.56 | 546 | 532 | 131.4 |
| D | 1 | 20 | 48398 | 364.34 | 546 | 532 | 131.4 |
| D | 2 | 152 | 29187 | 218.11 | 546 | 532 | 131.4 |
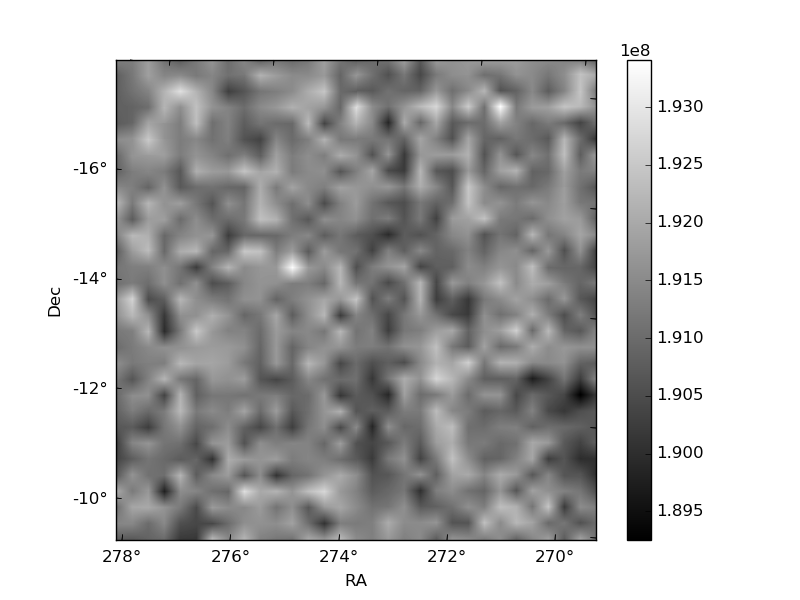
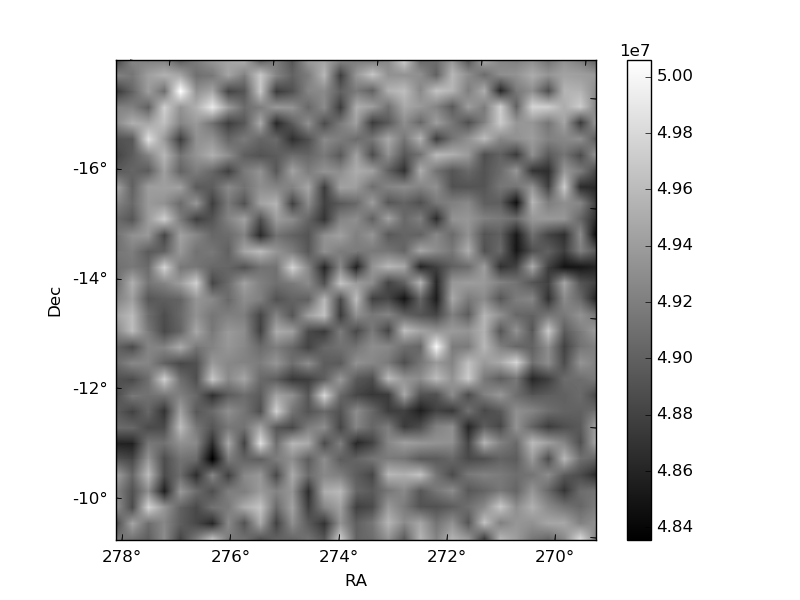
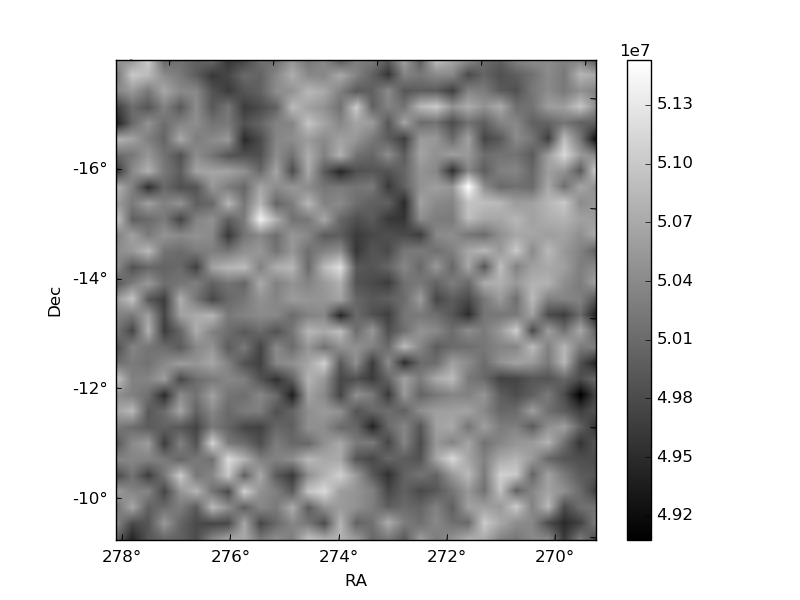
Histogram calculated using DETX and DETY for each event in the final _common_clean file
| Quadrant A | 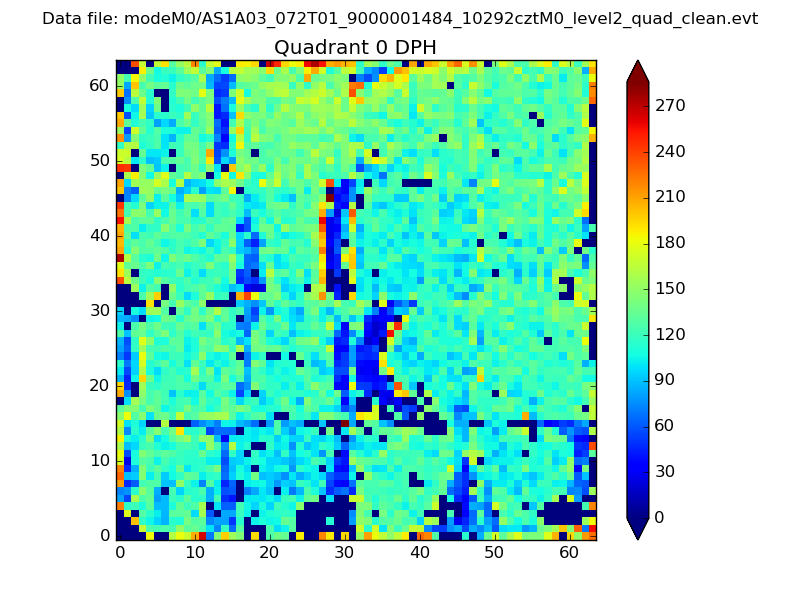 |
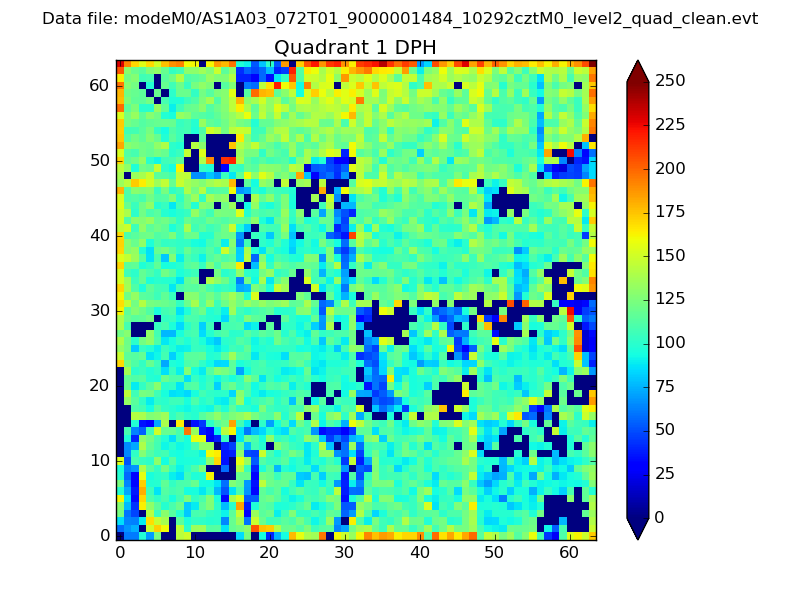 |
Quadrant B |
|---|---|---|---|
| Quadrant D | 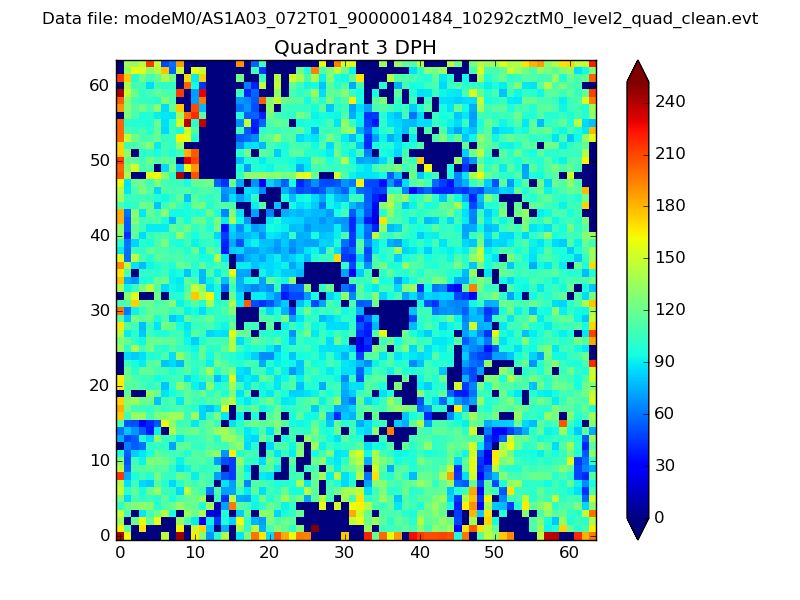 |
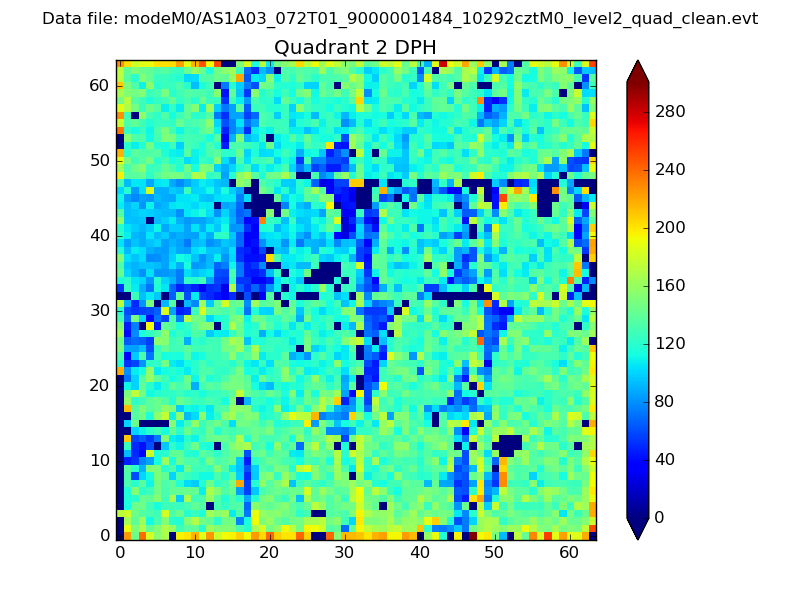 |
Quadrant C |
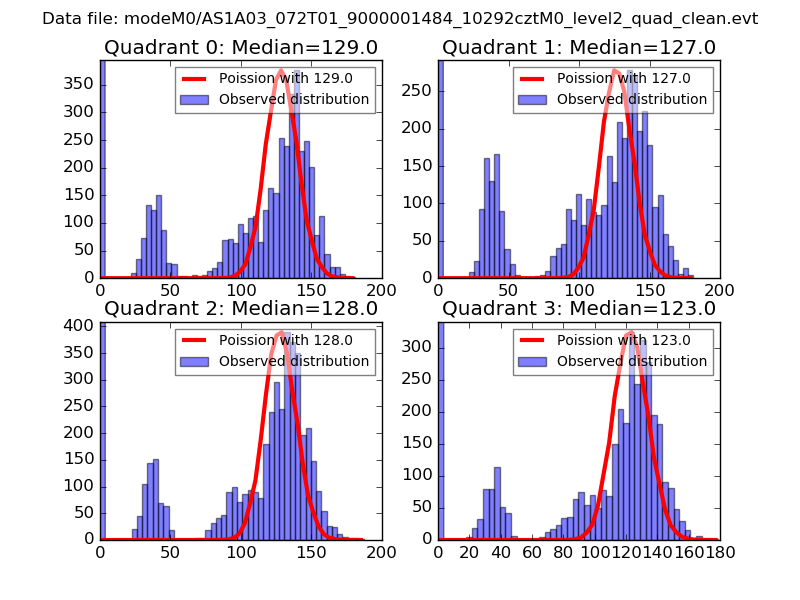
| Plot type | Count rate plots | Images |
|---|---|---|
| Comparison with Poisson distribution Blue bars denote a histogram of data divided into 1 sec bins. Red curve is a Poisson curve with rate = median count rate of data. |
 |
 |
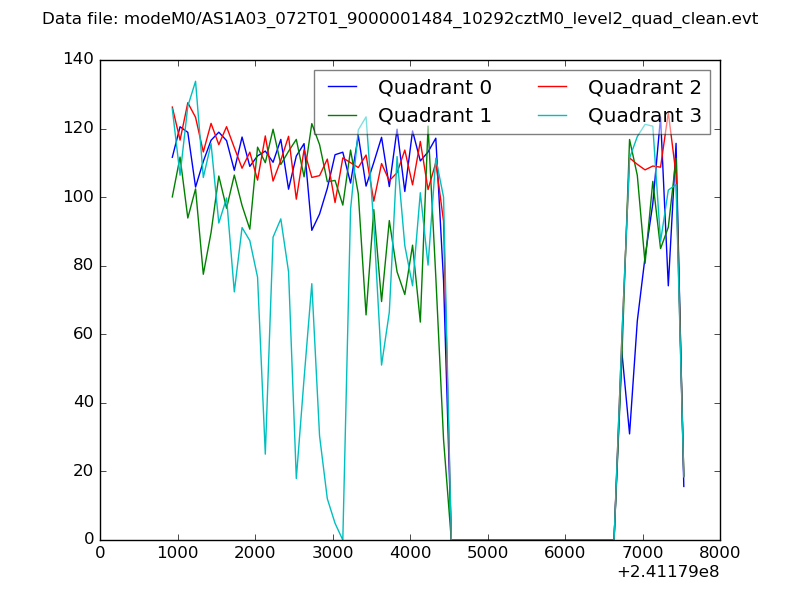
| Quadrant-wise count rates Data is divided into 100 sec bins |
 |
|
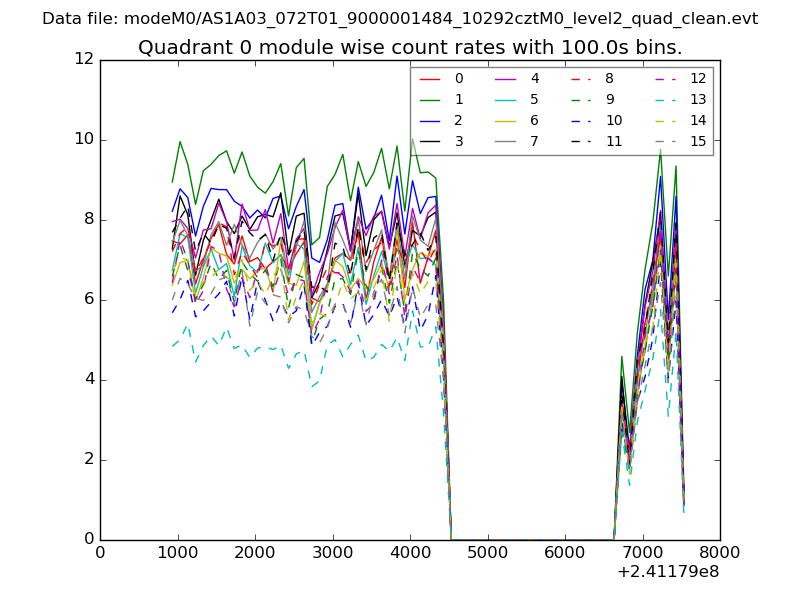
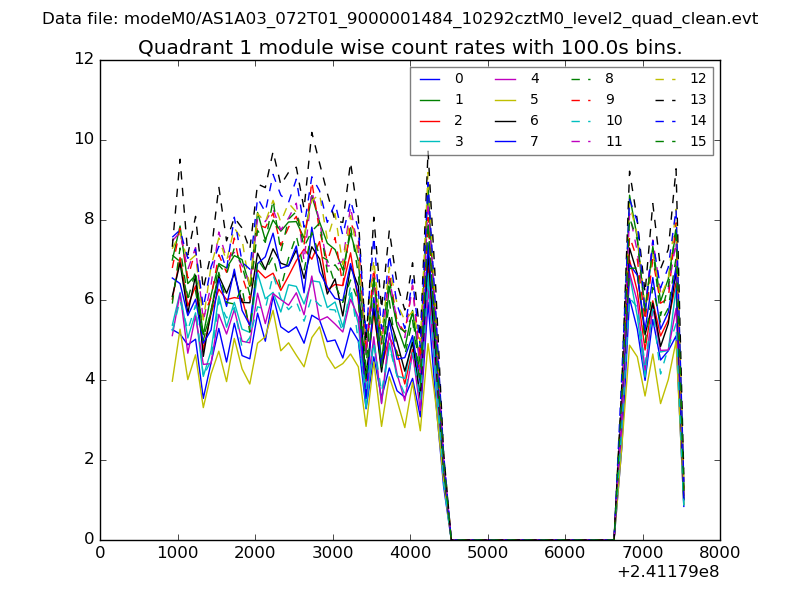
| Module-wise count rates for Quadrant A Data is divided into 100 sec bins |
 |
 |
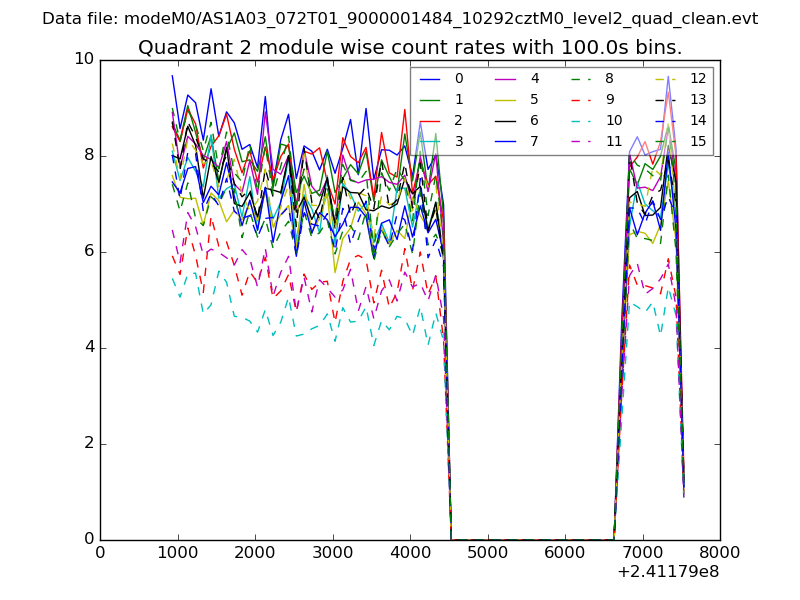
| Module-wise count rates for Quadrant B Data is divided into 100 sec bins |
 |
 |
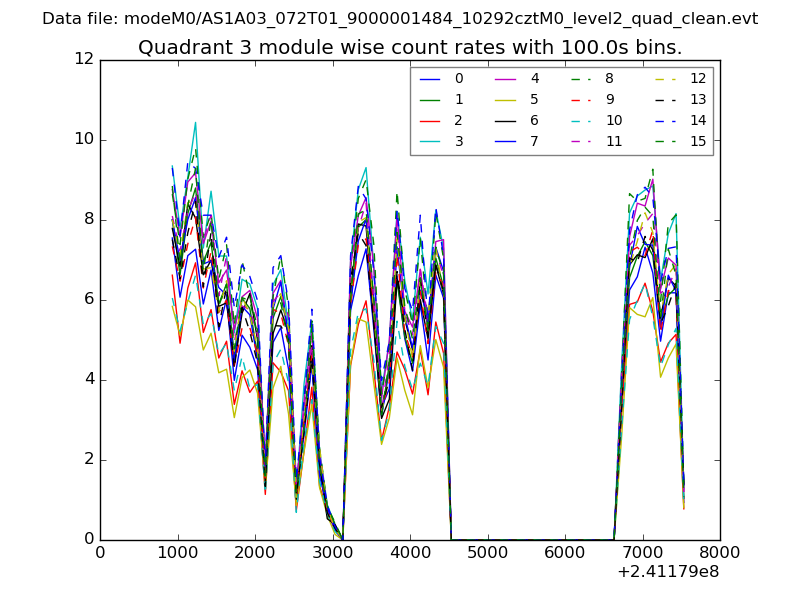
| Module-wise count rates for Quadrant C Data is divided into 100 sec bins |
 |
 |
| Module-wise count rates for Quadrant D Data is divided into 100 sec bins |
 |
 |
| Parameter | Plot |
|---|---|
| CZT HV Monitor | 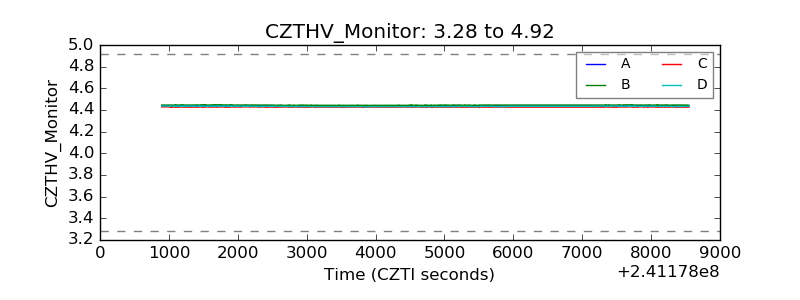 |
| D_VDD | 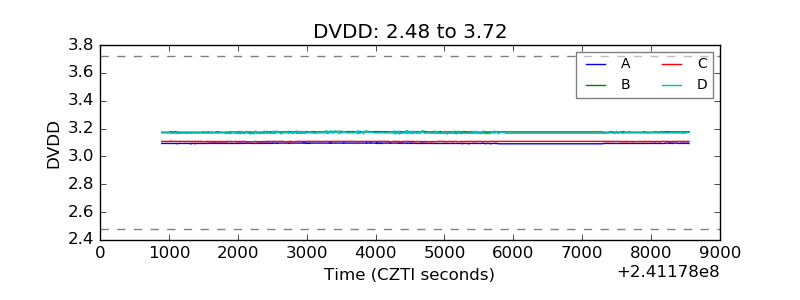 |
| Temperature 1 |  |
| Veto HV Monitor | 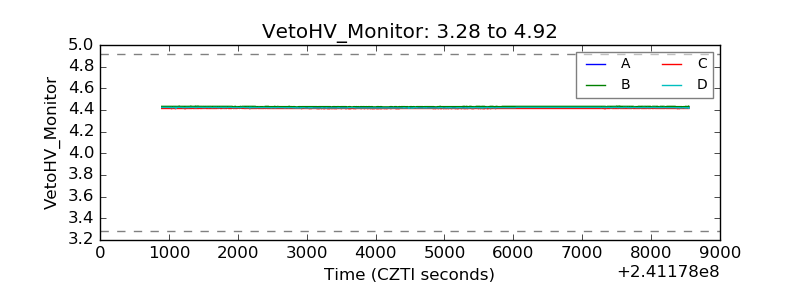 |
| Veto LLD | 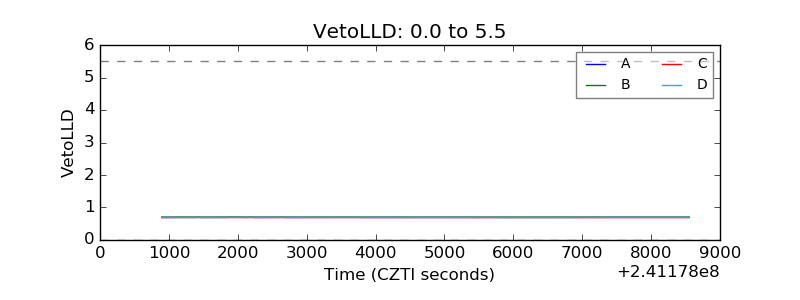 |
| Alpha Counter | 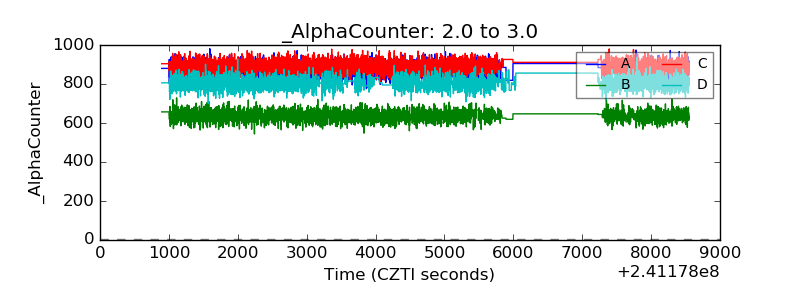 |
| _CPM_Rate | 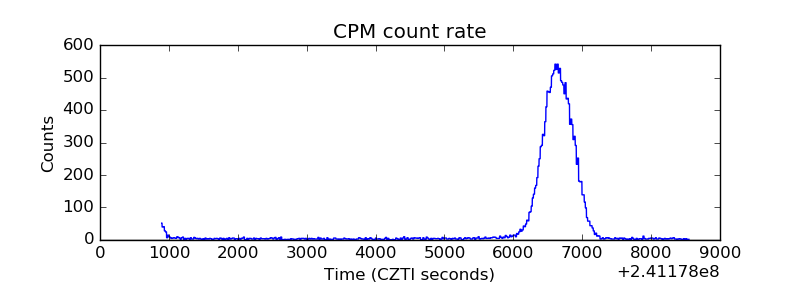 |
| CZT Counter | 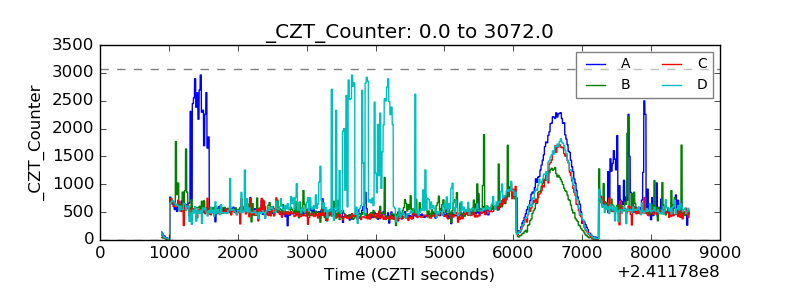 |
| +2.5 Volts monitor |  |
| +5 Volts monitor |  |
| _ROLL_ROT | 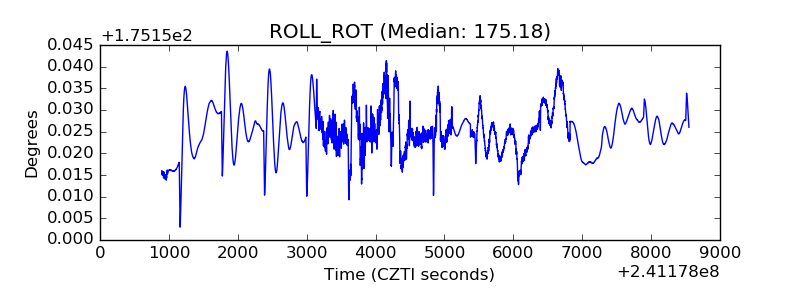 |
| _Roll_DEC | 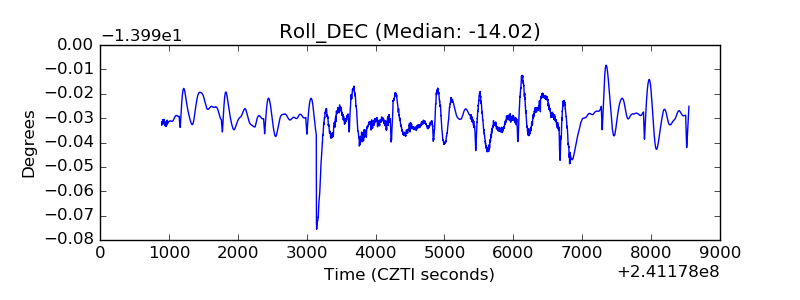 |
| _Roll_RA | 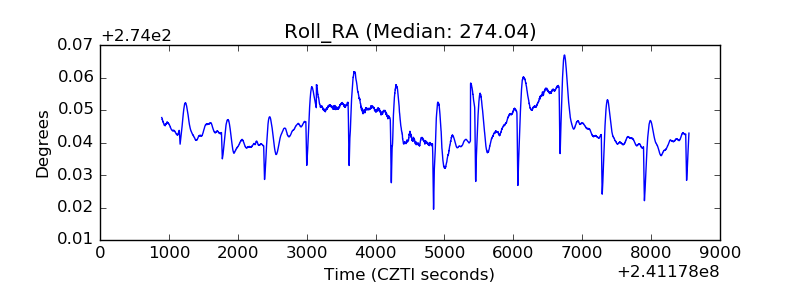 |
| Veto Counter | 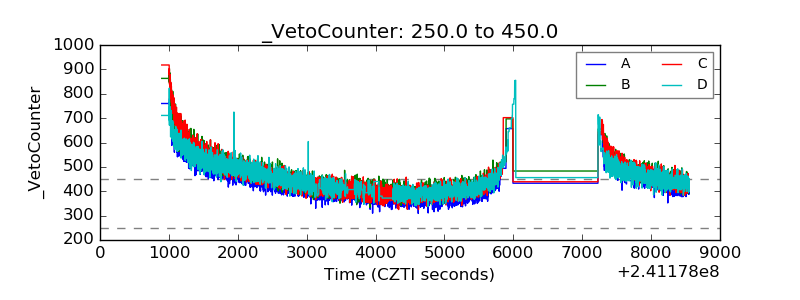 |