| Param | Original file | Final file |
|---|---|---|
| Filename | modeM0/AS1A03_072T01_9000001484_10293cztM0_level2.evt | modeM0/AS1A03_072T01_9000001484_10293cztM0_level2_quad_clean.evt |
| Size (bytes) | 508,204,800 | 96,465,600 |
| Size | 484.7 MB | 92.0 MB |
| Events in quadrant A | 3,610,421 | 626,891 |
| Events in quadrant B | 3,891,873 | 633,069 |
| Events in quadrant C | 3,207,051 | 617,997 |
| Events in quadrant D | 4,235,240 | 584,898 |
| Mode M0 | |||
|---|---|---|---|
| Quadrant | BADHDUFLAG | Total packets | Discarded packets |
| A | 0 | 15006 | 38 |
| B | 0 | 15663 | 32 |
| C | 0 | 13957 | 23 |
| D | 0 | 16722 | 49 |
| Mode SS | |||
|---|---|---|---|
| Quadrant | BADHDUFLAG | Total packets | Discarded packets |
| A | 0 | 134 | 0 |
| B | 0 | 134 | 0 |
| C | 0 | 134 | 0 |
| D | 0 | 134 | 0 |
| Mode M9 | |||
|---|---|---|---|
| Quadrant | BADHDUFLAG | Total packets | Discarded packets |
| A | 0 | 9 | 0 |
| B | 0 | 9 | 0 |
| C | 0 | 9 | 0 |
| D | 0 | 9 | 0 |
| Quadrant | Total seconds | Saturated seconds | Saturation percentage |
|---|---|---|---|
| A | 6574 | 250 | 3.802860% |
| B | 6575 | 230 | 3.498099% |
| C | 6578 | 136 | 2.067498% |
| D | 6574 | 176 | 2.677213% |
Noise dominated data is calculated using 1-second bins in cleaned event files. If a bin has >2000 counts, and if more than 50% of those come from <1% of pixels, then it is considered to be noise-dominated and hence unusable.
| Quadrant | # 1 sec bins | Bins with >0 counts | Bins with >2000 counts | High rate bins dominated by noise | Noise dominated (total time) | Noise dominated (detector-on time) | Marked lightcurve |
|---|---|---|---|---|---|---|---|
| A | 7519 | 6589 | 92 | 92 | 1.22% | 1.40% | 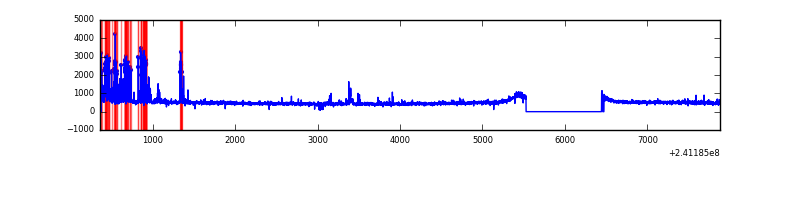 |
| B | 7519 | 6590 | 70 | 70 | 0.93% | 1.06% | 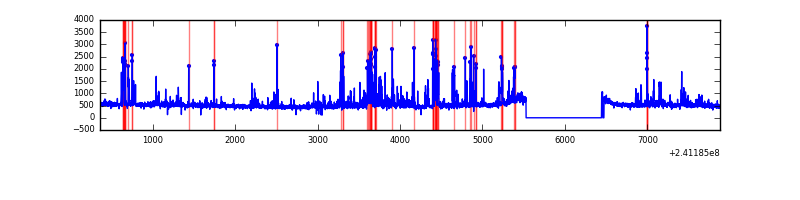 |
| C | 7519 | 6590 | 20 | 20 | 0.27% | 0.30% | 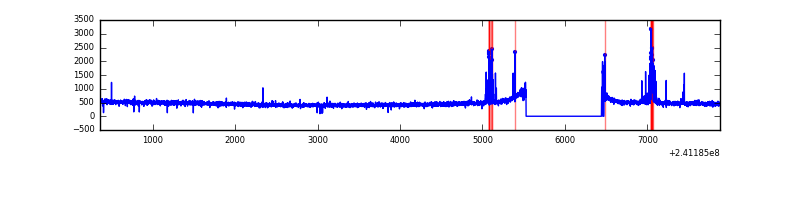 |
| D | 7519 | 6590 | 83 | 83 | 1.10% | 1.26% | 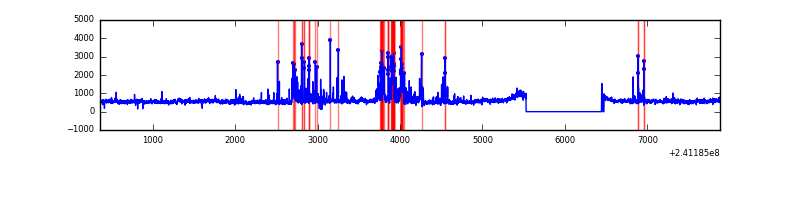 |
Top three noisy pixels from each quadrant. If the there are fewer than three noisy pixels in the level2.evt file, extra rows are filled as -1
| Pixel properties | Quadrant properties | ||||||
|---|---|---|---|---|---|---|---|
| Quadrant | DetID | PixID | Counts | Sigma | Mean | Median | Sigma |
| A | 5 | 16 | 405552 | 2434.74 | 820 | 804 | 166.2 |
| A | 15 | 174 | 19808 | 114.32 | 820 | 804 | 166.2 |
| A | 3 | 1 | 11402 | 63.75 | 820 | 804 | 166.2 |
| B | 4 | 239 | 511473 | 3257.59 | 816 | 797 | 156.8 |
| B | 11 | 51 | 106726 | 675.72 | 816 | 797 | 156.8 |
| B | 0 | 214 | 43317 | 271.23 | 816 | 797 | 156.8 |
| C | 4 | 254 | 141295 | 777.08 | 785 | 791 | 180.8 |
| C | 13 | 61 | 5874 | 28.11 | 785 | 791 | 180.8 |
| C | 14 | 234 | 3157 | 13.09 | 785 | 791 | 180.8 |
| D | 2 | 16 | 404487 | 2137.01 | 791 | 770 | 188.9 |
| D | 8 | 195 | 342705 | 1809.97 | 791 | 770 | 188.9 |
| D | 1 | 20 | 151925 | 800.11 | 791 | 770 | 188.9 |
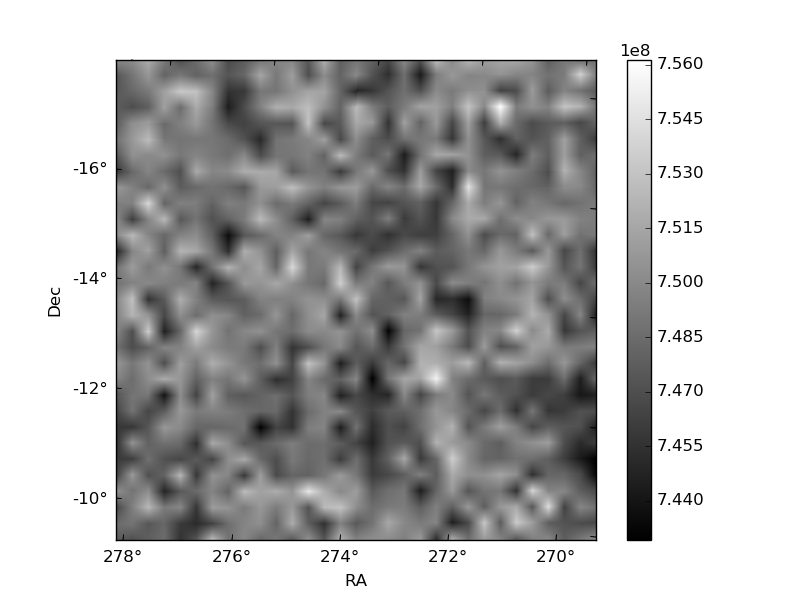
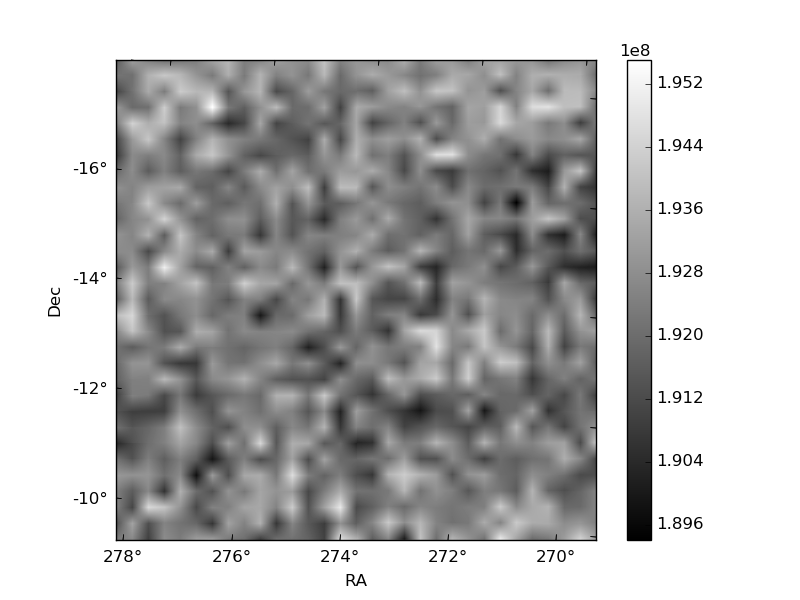
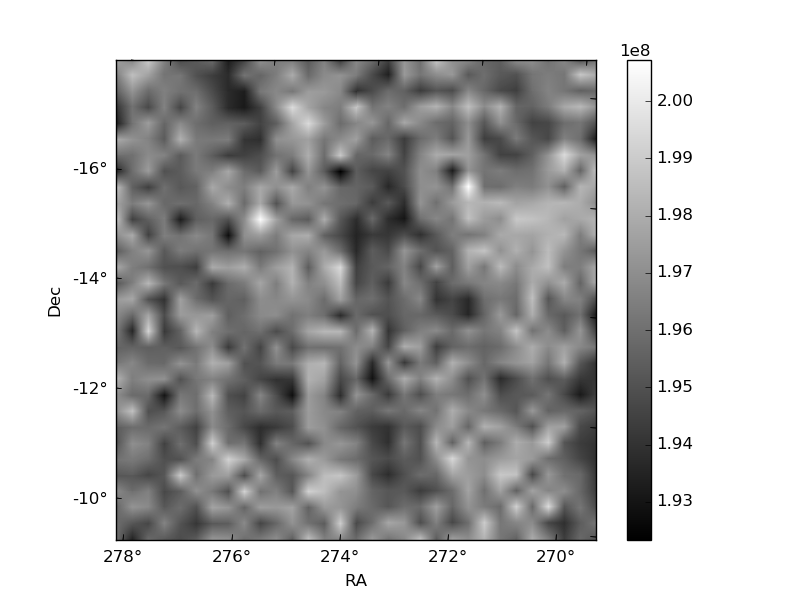
Histogram calculated using DETX and DETY for each event in the final _common_clean file
| Quadrant A | 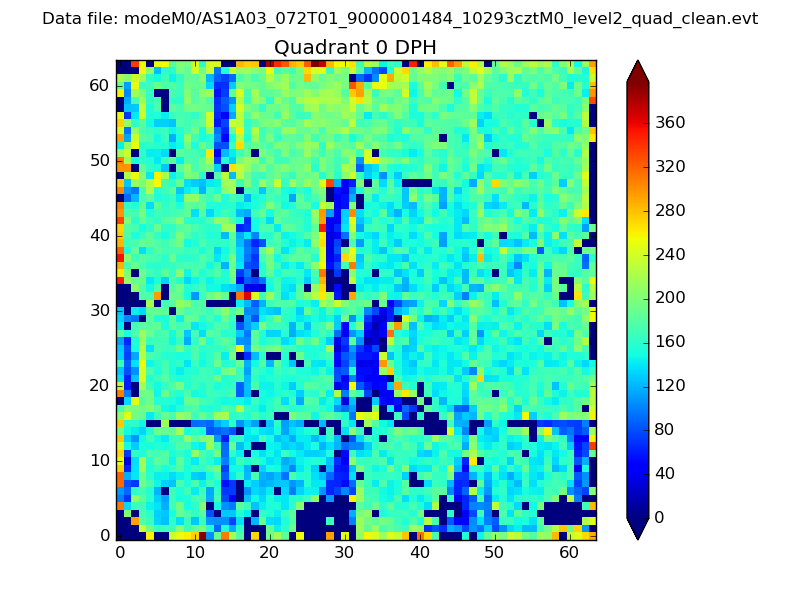 |
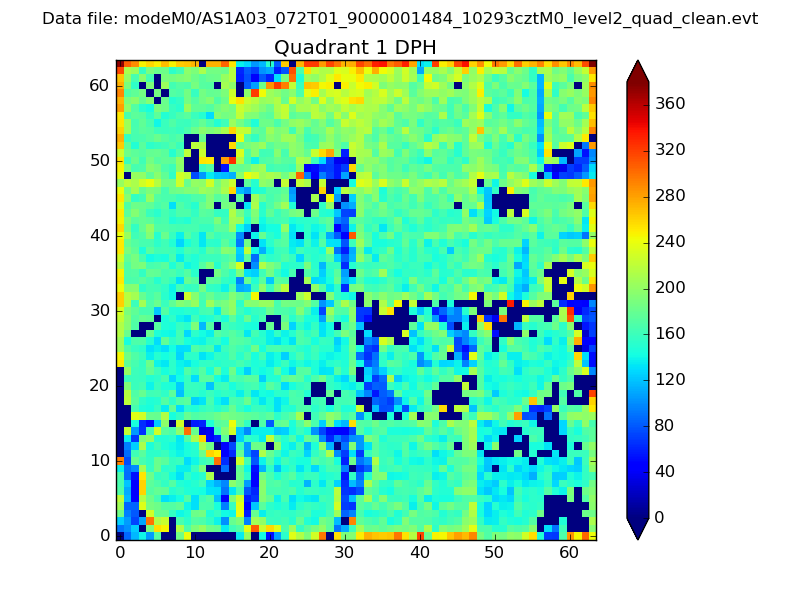 |
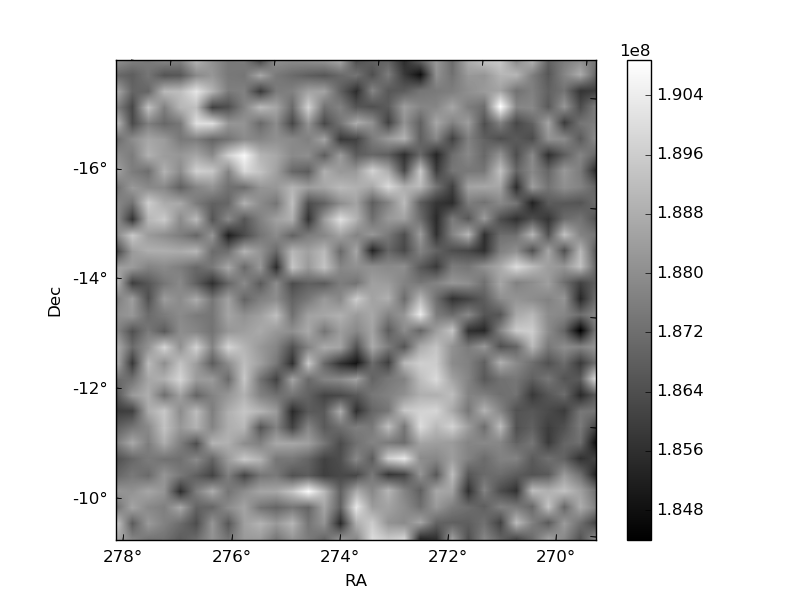
Quadrant B |
|---|---|---|---|
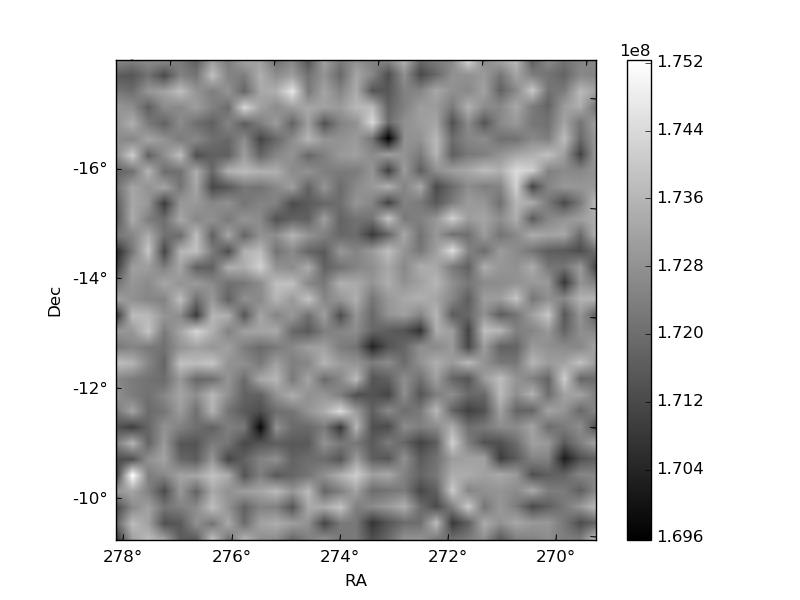
| Quadrant D | 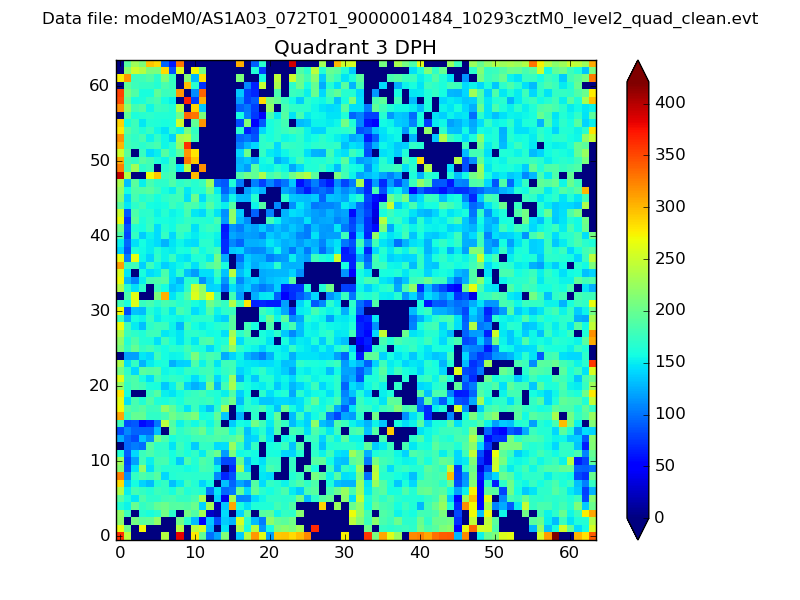 |
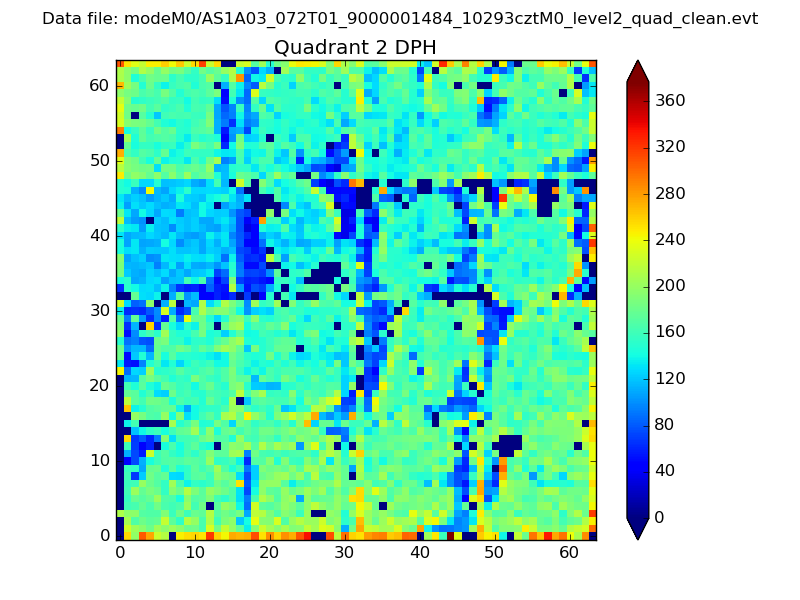 |
Quadrant C |
| Plot type | Count rate plots | Images |
|---|---|---|
| Comparison with Poisson distribution Blue bars denote a histogram of data divided into 1 sec bins. Red curve is a Poisson curve with rate = median count rate of data. |
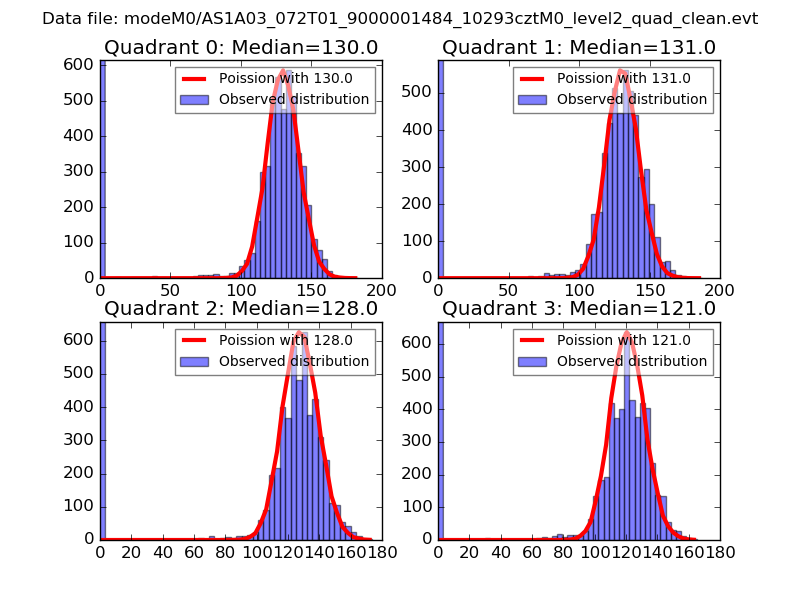 |
 |
| Quadrant-wise count rates Data is divided into 100 sec bins |
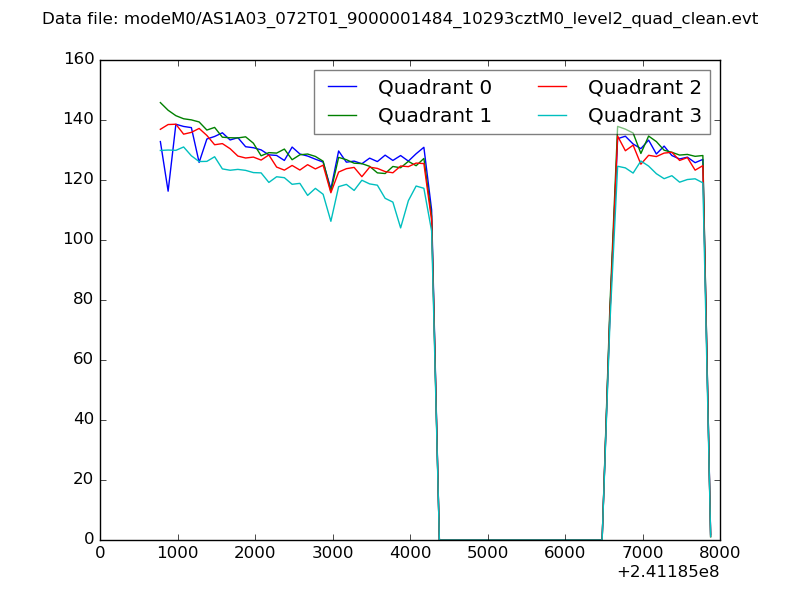 |
|
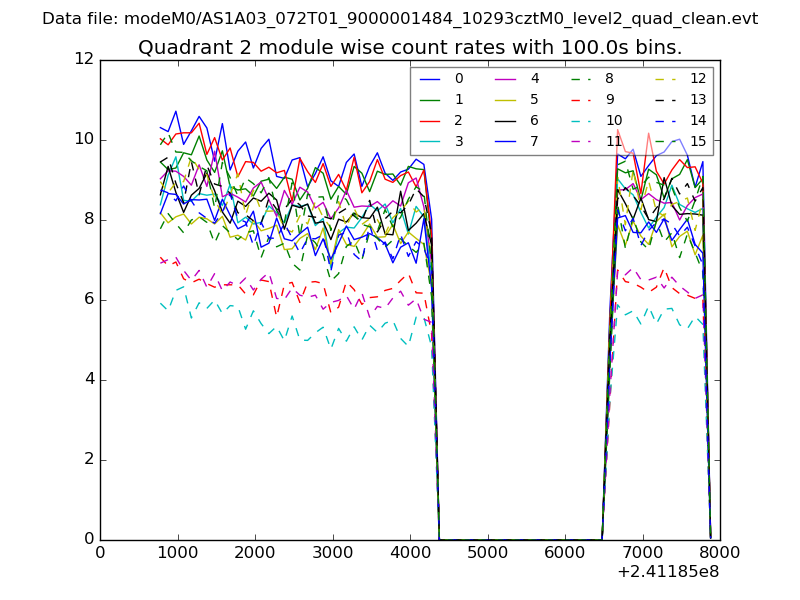
| Module-wise count rates for Quadrant A Data is divided into 100 sec bins |
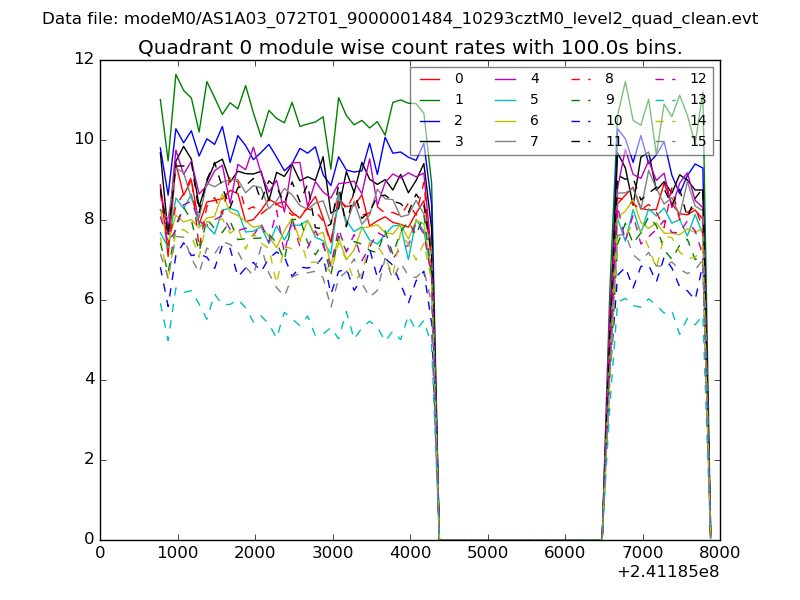 |
 |
| Module-wise count rates for Quadrant B Data is divided into 100 sec bins |
 |
 |
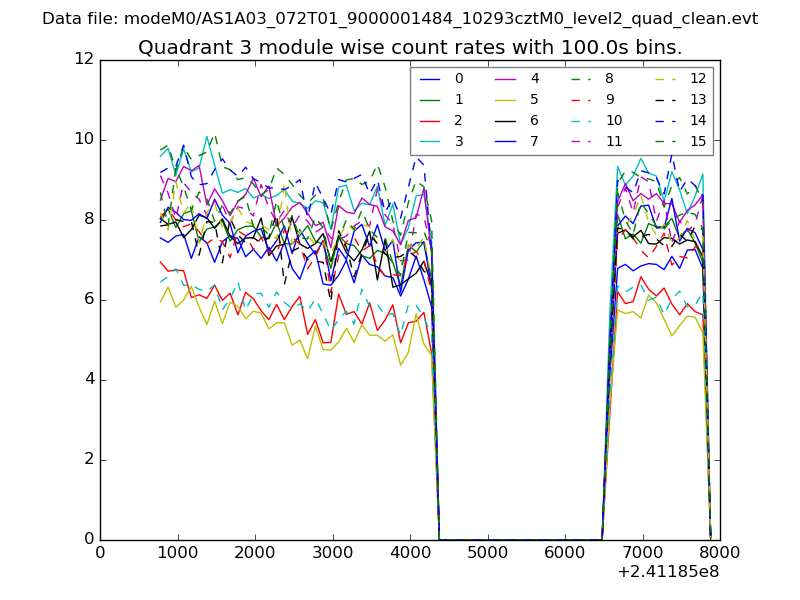
| Module-wise count rates for Quadrant C Data is divided into 100 sec bins |
 |
 |
| Module-wise count rates for Quadrant D Data is divided into 100 sec bins |
 |
 |
| Parameter | Plot |
|---|---|
| CZT HV Monitor | 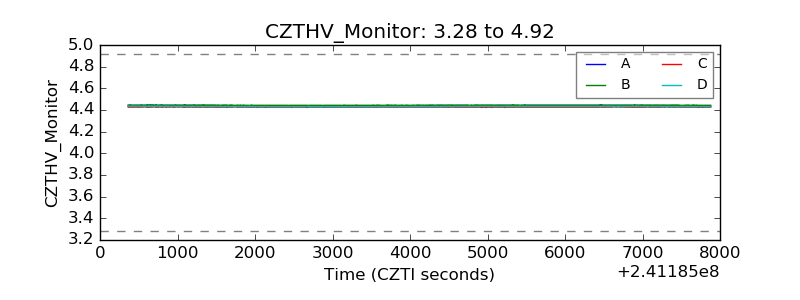 |
| D_VDD | 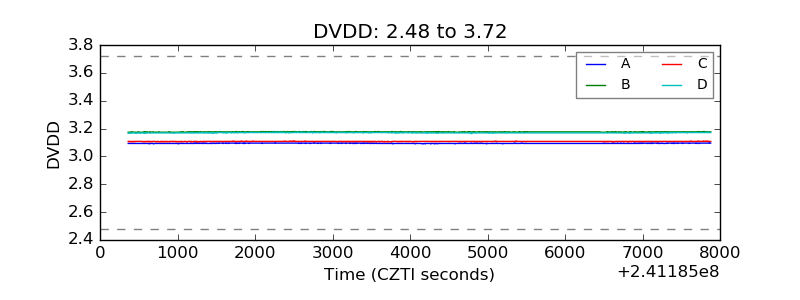 |
| Temperature 1 | 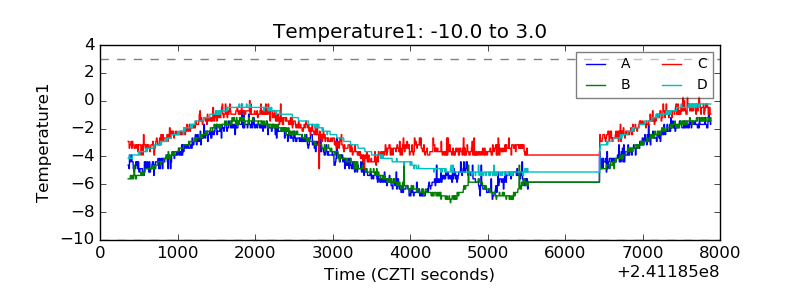 |
| Veto HV Monitor | 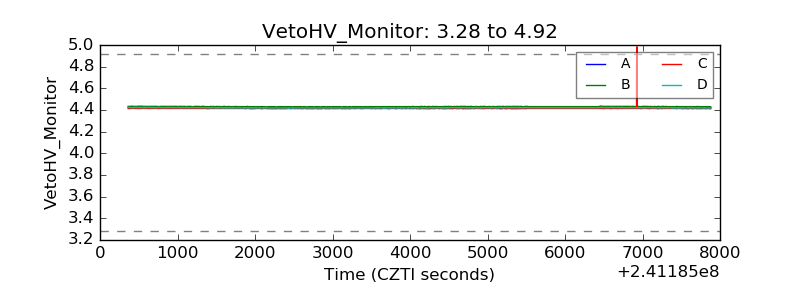 |
| Veto LLD | 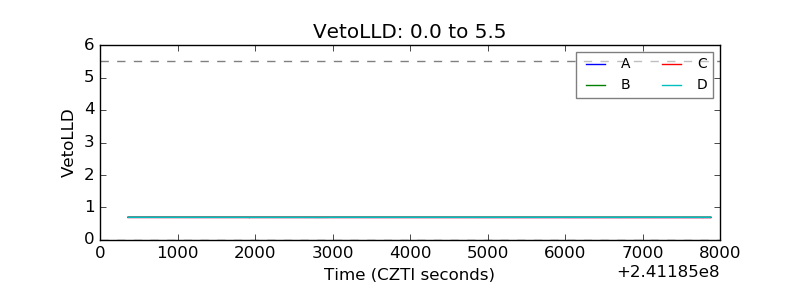 |
| Alpha Counter | 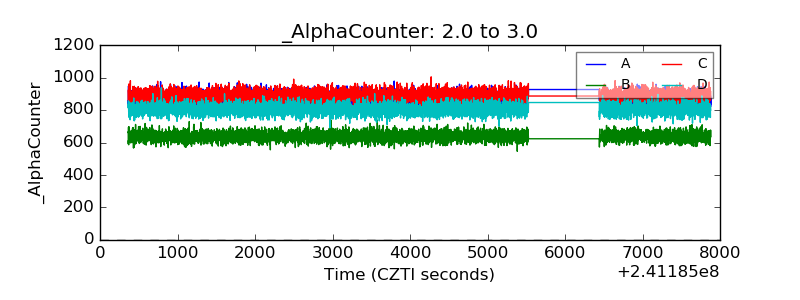 |
| _CPM_Rate | 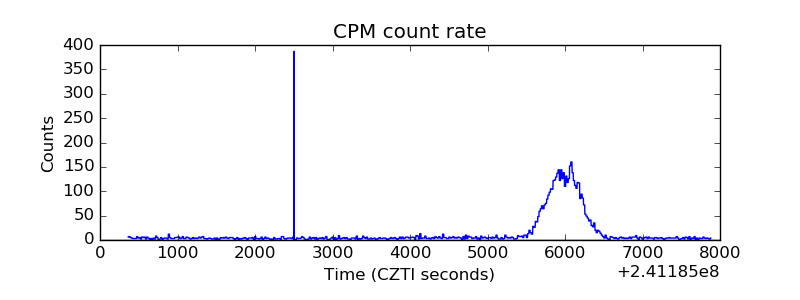 |
| CZT Counter |  |
| +2.5 Volts monitor |  |
| +5 Volts monitor |  |
| _ROLL_ROT | 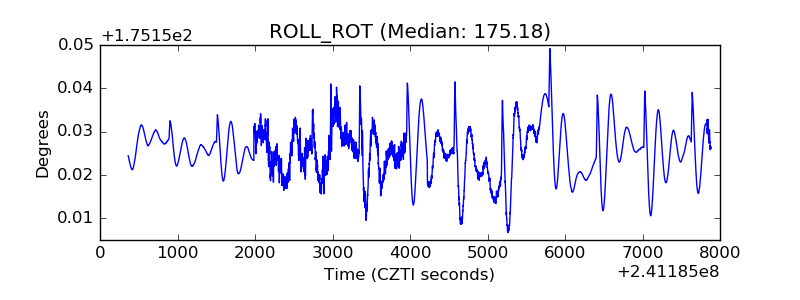 |
| _Roll_DEC | 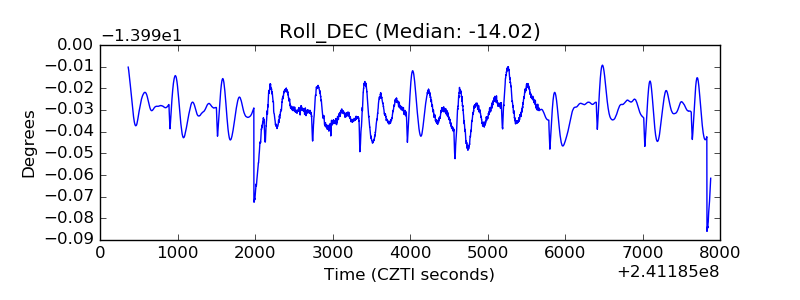 |
| _Roll_RA | 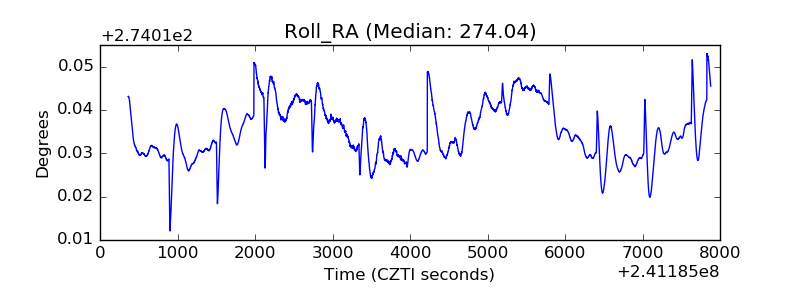 |
| Veto Counter | 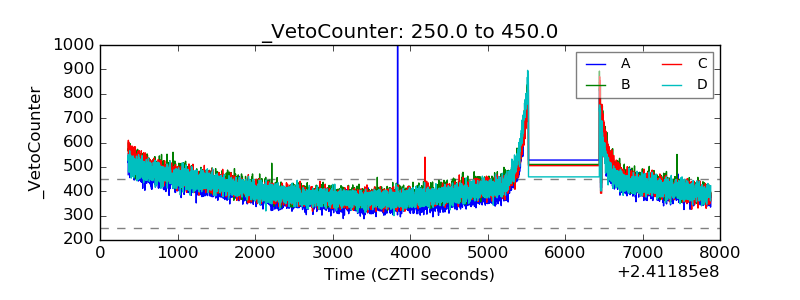 |