| Param | Original file | Final file |
|---|---|---|
| Filename | modeM0/AS1A03_072T01_9000001484_10295cztM0_level2.evt | modeM0/AS1A03_072T01_9000001484_10295cztM0_level2_quad_clean.evt |
| Size (bytes) | 406,370,880 | 77,610,240 |
| Size | 387.5 MB | 74.0 MB |
| Events in quadrant A | 2,711,604 | 476,666 |
| Events in quadrant B | 2,854,821 | 466,371 |
| Events in quadrant C | 2,630,118 | 479,861 |
| Events in quadrant D | 3,706,506 | 513,661 |
| Mode M0 | |||
|---|---|---|---|
| Quadrant | BADHDUFLAG | Total packets | Discarded packets |
| A | 0 | 28642 | 16736 |
| B | 0 | 32453 | 20471 |
| C | 0 | 29360 | 17404 |
| D | 0 | 31720 | 16840 |
| Mode SS | |||
|---|---|---|---|
| Quadrant | BADHDUFLAG | Total packets | Discarded packets |
| A | 0 | 284 | 150 |
| B | 0 | 284 | 155 |
| C | 0 | 284 | 153 |
| D | 0 | 270 | 142 |
| Quadrant | Total seconds | Saturated seconds | Saturation percentage |
|---|---|---|---|
| A | 5720 | 68 | 1.188811% |
| B | 5513 | 99 | 1.795755% |
| C | 5793 | 36 | 0.621440% |
| D | 6574 | 43 | 0.654092% |
Noise dominated data is calculated using 1-second bins in cleaned event files. If a bin has >2000 counts, and if more than 50% of those come from <1% of pixels, then it is considered to be noise-dominated and hence unusable.
| Quadrant | # 1 sec bins | Bins with >0 counts | Bins with >2000 counts | High rate bins dominated by noise | Noise dominated (total time) | Noise dominated (detector-on time) | Marked lightcurve |
|---|---|---|---|---|---|---|---|
| A | 7102 | 6756 | 0 | 0 | 0.00% | 0.00% | 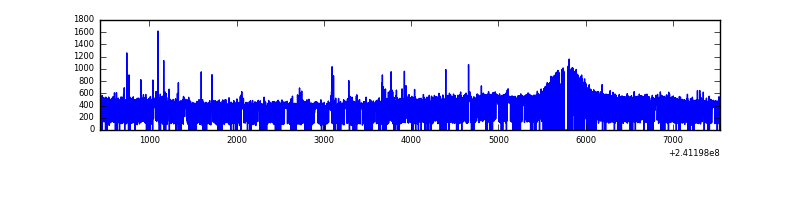 |
| B | 7102 | 6566 | 1 | 1 | 0.01% | 0.02% | 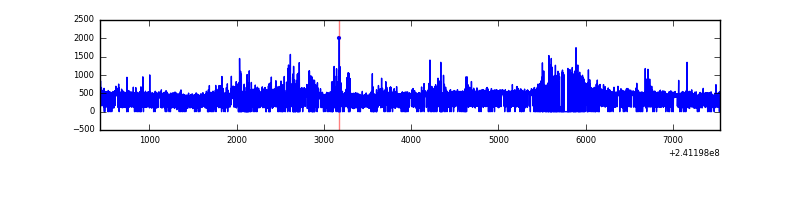 |
| C | 7101 | 6783 | 0 | 0 | 0.00% | 0.00% | 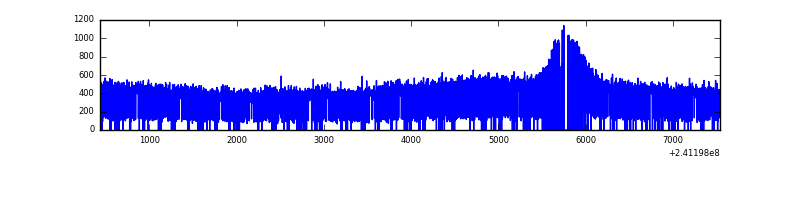 |
| D | 7102 | 6945 | 0 | 0 | 0.00% | 0.00% | 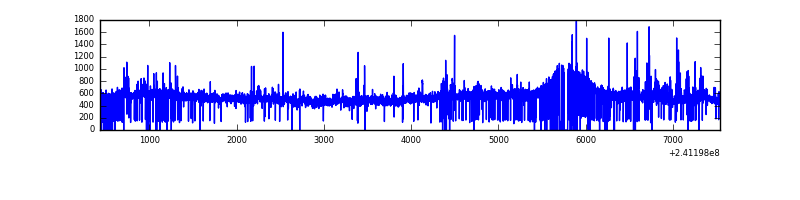 |
Top three noisy pixels from each quadrant. If the there are fewer than three noisy pixels in the level2.evt file, extra rows are filled as -1
| Pixel properties | Quadrant properties | ||||||
|---|---|---|---|---|---|---|---|
| Quadrant | DetID | PixID | Counts | Sigma | Mean | Median | Sigma |
| A | 8 | 5 | 35020 | 241.75 | 689 | 673 | 142.1 |
| A | 8 | 15 | 18977 | 128.83 | 689 | 673 | 142.1 |
| A | 15 | 174 | 8535 | 55.34 | 689 | 673 | 142.1 |
| B | 4 | 239 | 126291 | 975.71 | 663 | 648 | 128.8 |
| B | 11 | 51 | 80913 | 623.32 | 663 | 648 | 128.8 |
| B | 0 | 214 | 29716 | 225.73 | 663 | 648 | 128.8 |
| C | 10 | 169 | 5390 | 29.88 | 672 | 675 | 157.8 |
| C | 13 | 61 | 5134 | 28.26 | 672 | 675 | 157.8 |
| C | 14 | 234 | 2647 | 12.5 | 672 | 675 | 157.8 |
| D | 8 | 195 | 631682 | 3413.1 | 757 | 734 | 184.9 |
| D | 2 | 152 | 39035 | 207.19 | 757 | 734 | 184.9 |
| D | 7 | 71 | 38156 | 202.43 | 757 | 734 | 184.9 |
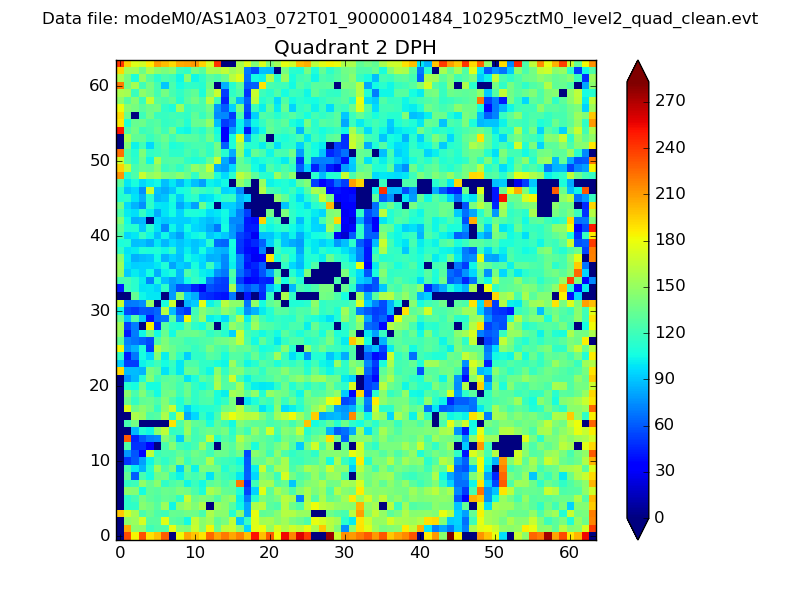
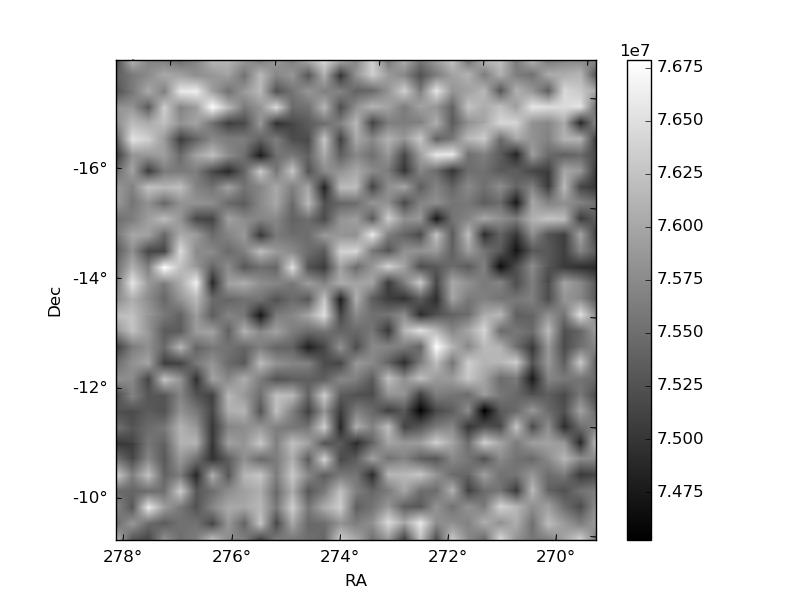
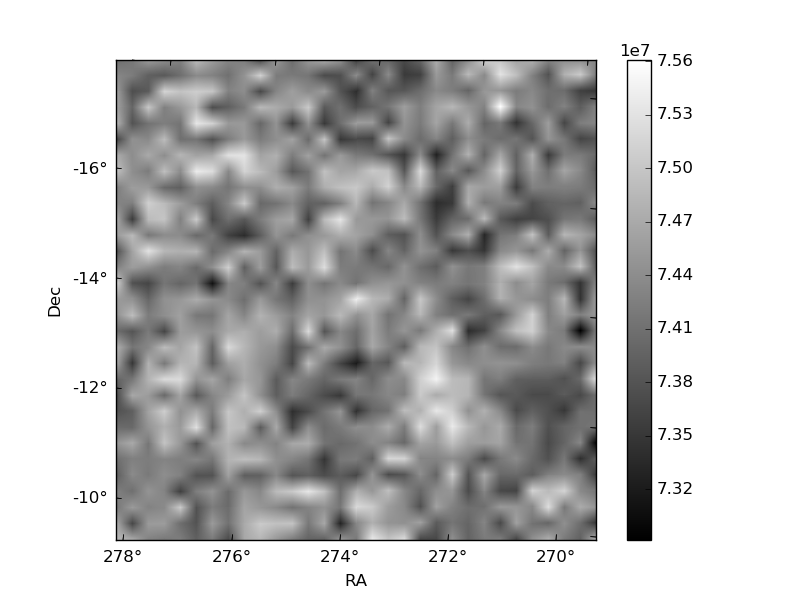
Histogram calculated using DETX and DETY for each event in the final _common_clean file
| Quadrant A | 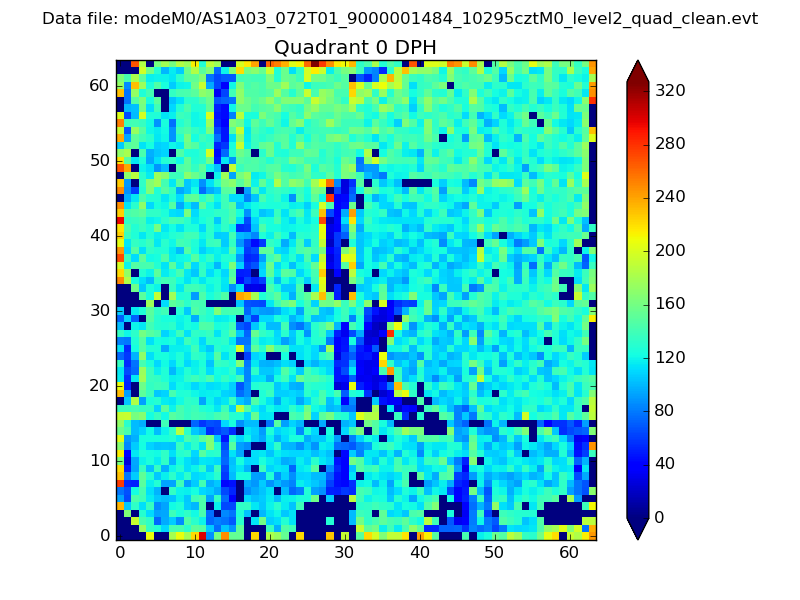 |
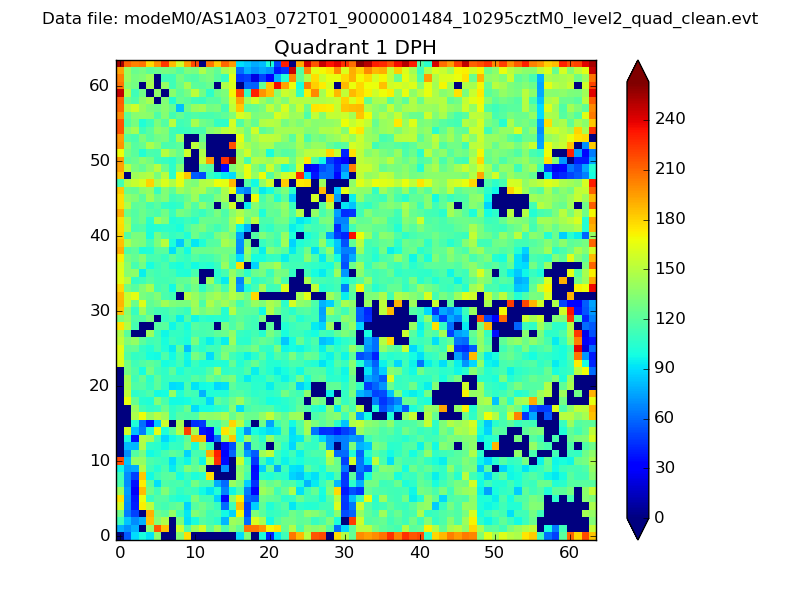 |
Quadrant B |
|---|---|---|---|
| Quadrant D | 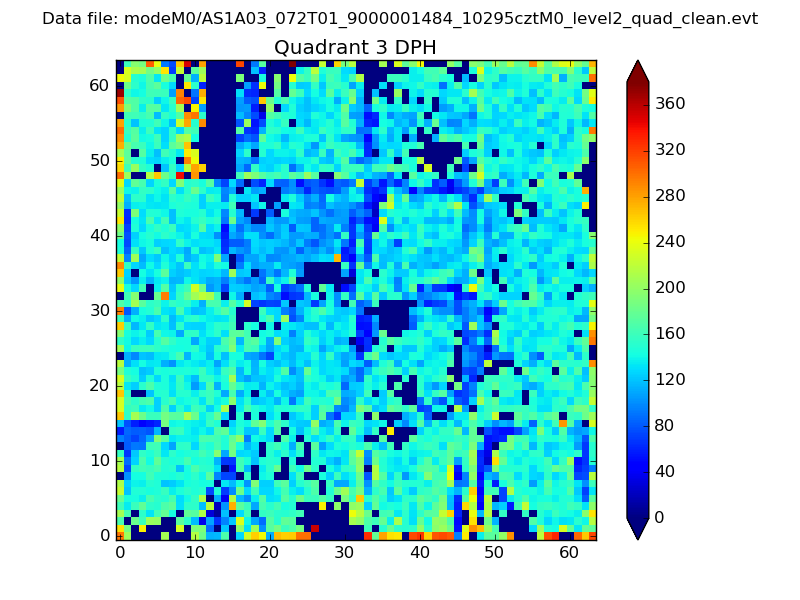 |
 |
Quadrant C |
| Plot type | Count rate plots | Images |
|---|---|---|
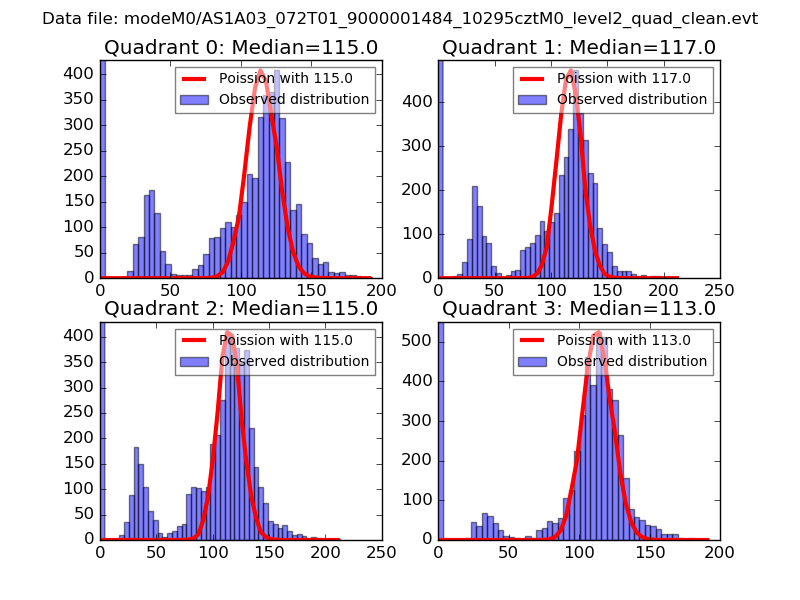
| Comparison with Poisson distribution Blue bars denote a histogram of data divided into 1 sec bins. Red curve is a Poisson curve with rate = median count rate of data. |
 |
 |
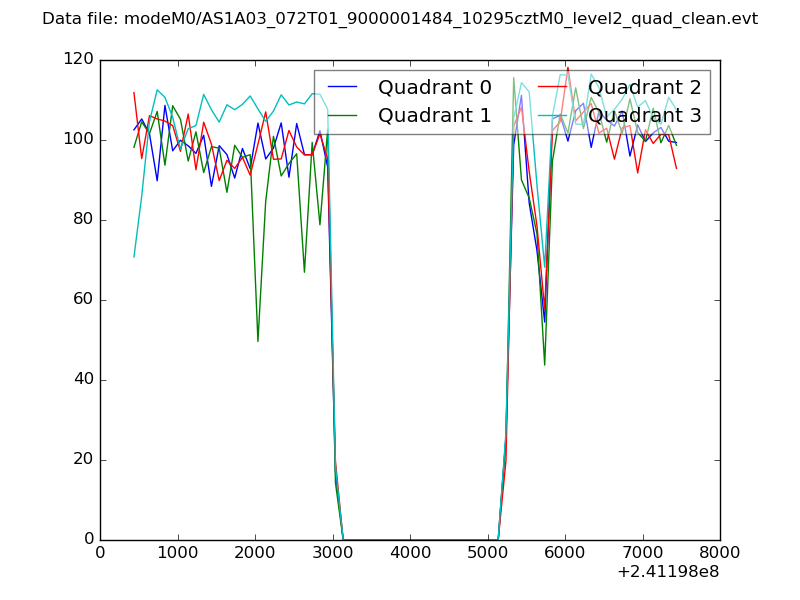
| Quadrant-wise count rates Data is divided into 100 sec bins |
 |
|
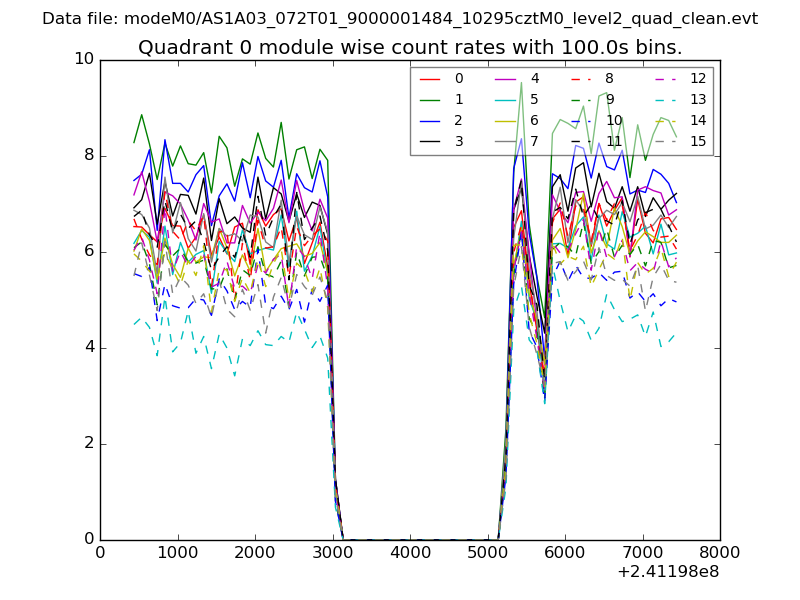
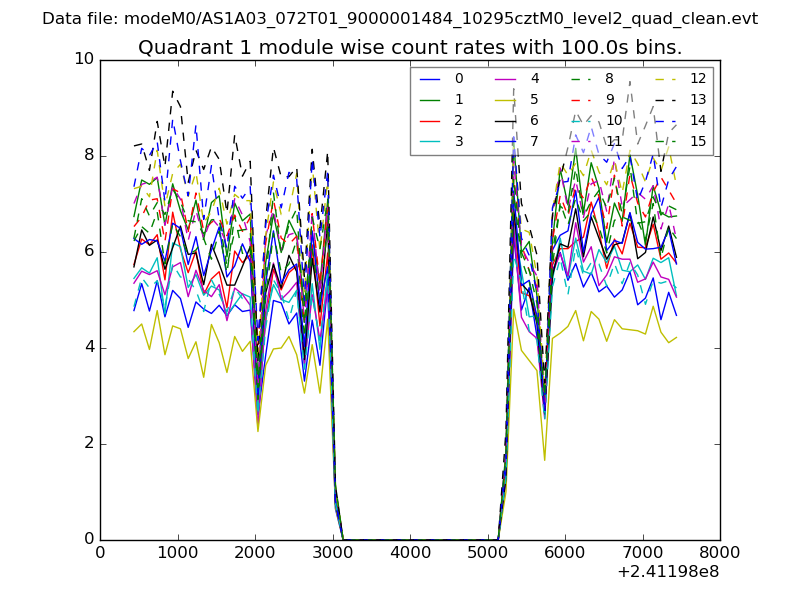
| Module-wise count rates for Quadrant A Data is divided into 100 sec bins |
 |
 |
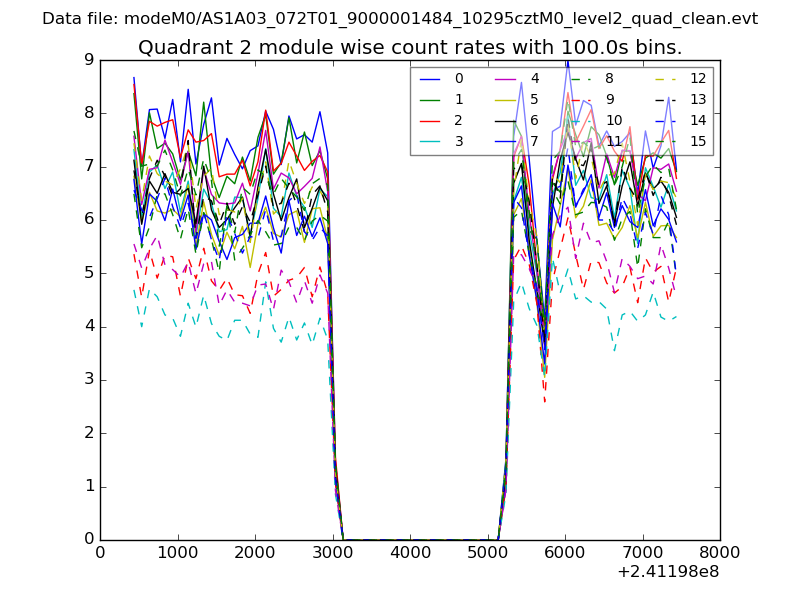
| Module-wise count rates for Quadrant B Data is divided into 100 sec bins |
 |
 |
| Module-wise count rates for Quadrant C Data is divided into 100 sec bins |
 |
 |
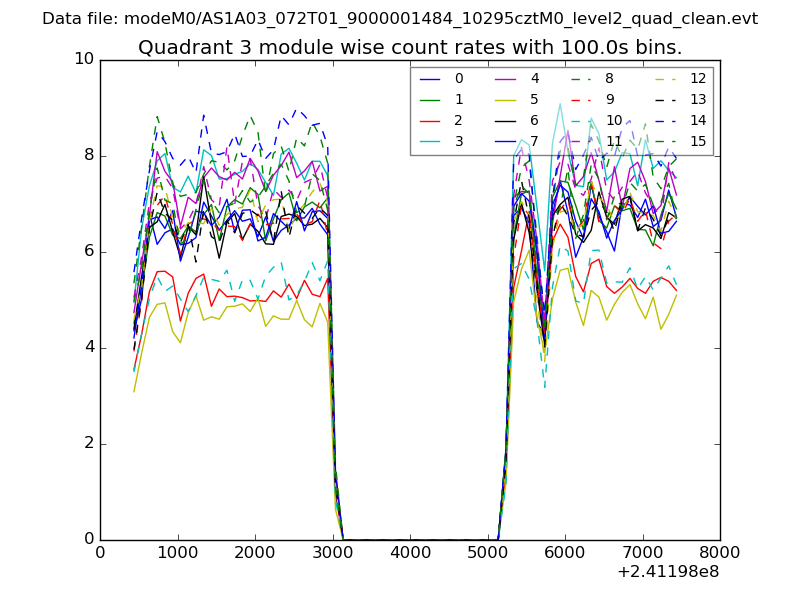
| Module-wise count rates for Quadrant D Data is divided into 100 sec bins |
 |
 |
| Parameter | Plot |
|---|---|
| CZT HV Monitor | 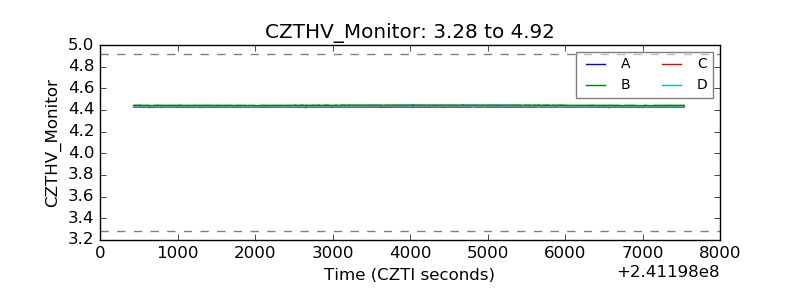 |
| D_VDD | 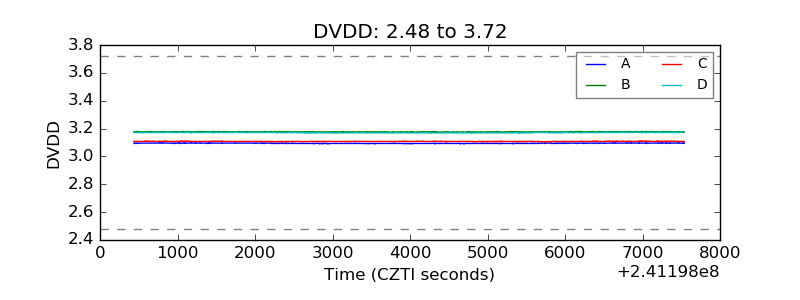 |
| Temperature 1 | 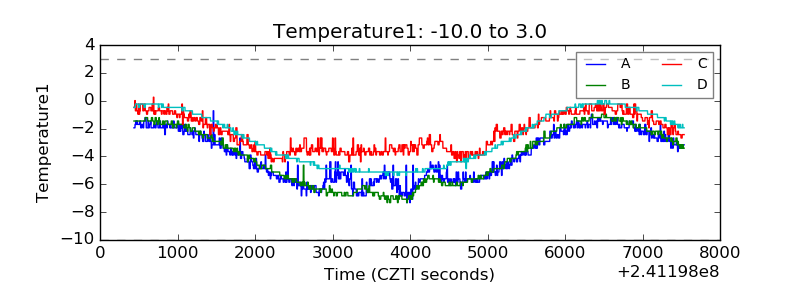 |
| Veto HV Monitor |  |
| Veto LLD | 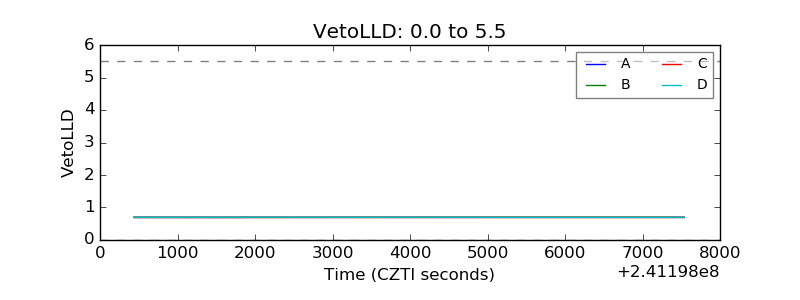 |
| Alpha Counter | 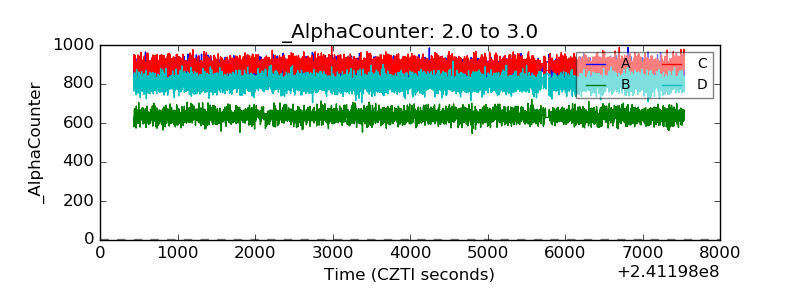 |
| _CPM_Rate | 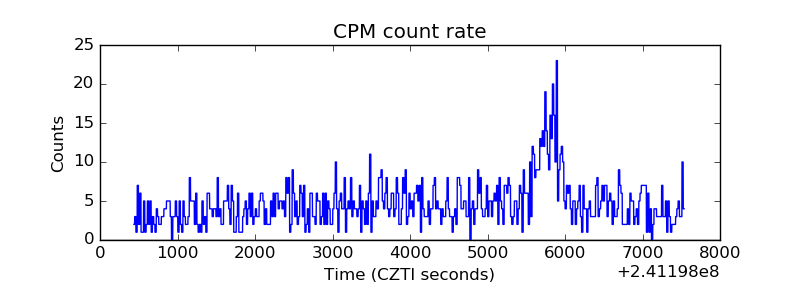 |
| CZT Counter |  |
| +2.5 Volts monitor |  |
| +5 Volts monitor | 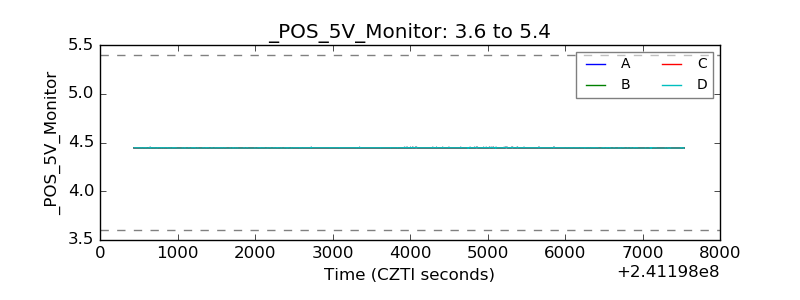 |
| _ROLL_ROT | 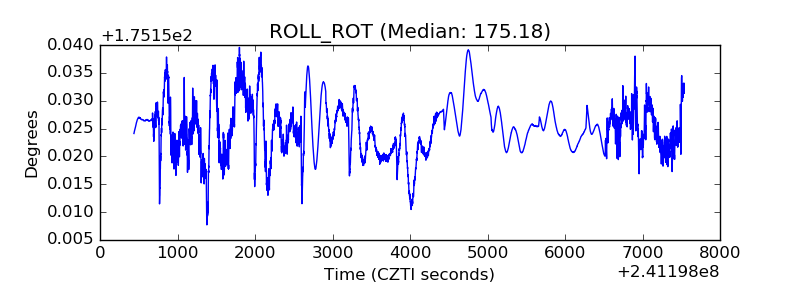 |
| _Roll_DEC | 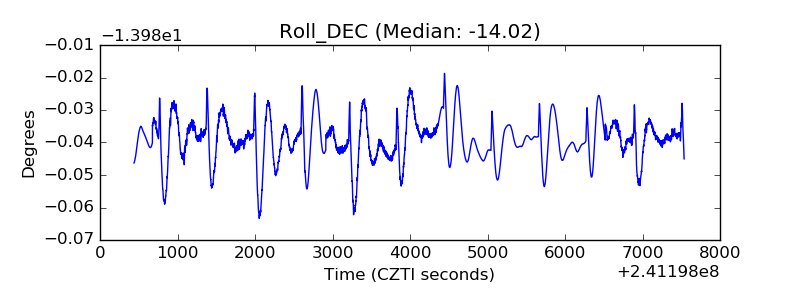 |
| _Roll_RA | 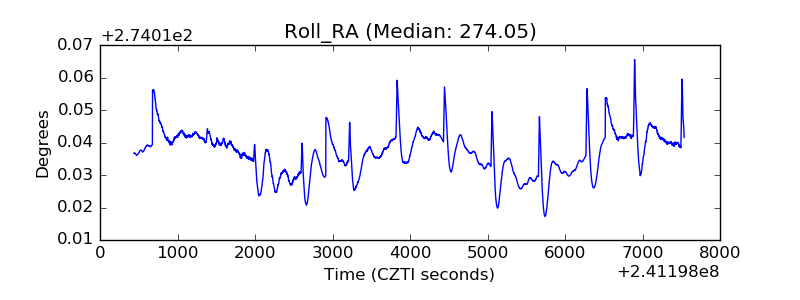 |
| Veto Counter | 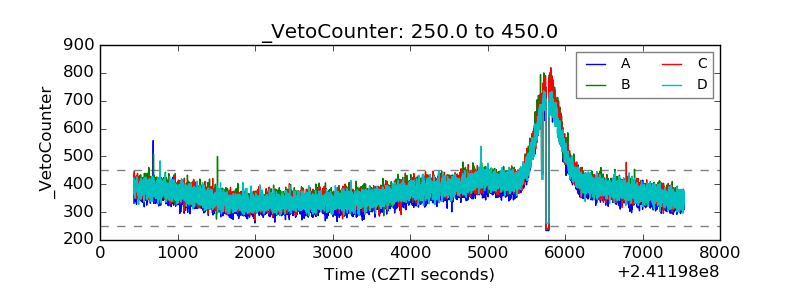 |