| Param | Original file | Final file |
|---|---|---|
| Filename | modeM0/AS1A03_072T01_9000001484_10299cztM0_level2.evt | modeM0/AS1A03_072T01_9000001484_10299cztM0_level2_quad_clean.evt |
| Size (bytes) | 1,372,109,760 | 230,592,960 |
| Size | 1.3 GB | 219.9 MB |
| Events in quadrant A | 8,694,363 | 1,461,183 |
| Events in quadrant B | 10,312,976 | 1,467,024 |
| Events in quadrant C | 8,639,763 | 1,438,734 |
| Events in quadrant D | 12,642,463 | 1,326,585 |
| Mode M0 | |||
|---|---|---|---|
| Quadrant | BADHDUFLAG | Total packets | Discarded packets |
| A | 0 | 38606 | 5 |
| B | 0 | 42939 | 4 |
| C | 0 | 39023 | 4 |
| D | 0 | 49652 | 4 |
| Mode SS | |||
|---|---|---|---|
| Quadrant | BADHDUFLAG | Total packets | Discarded packets |
| A | 0 | 386 | 0 |
| B | 0 | 386 | 0 |
| C | 0 | 386 | 0 |
| D | 0 | 386 | 0 |
| Mode M9 | |||
|---|---|---|---|
| Quadrant | BADHDUFLAG | Total packets | Discarded packets |
| A | 0 | 19 | 0 |
| B | 0 | 19 | 0 |
| C | 0 | 19 | 0 |
| D | 0 | 19 | 0 |
| Quadrant | Total seconds | Saturated seconds | Saturation percentage |
|---|---|---|---|
| A | 18716 | 105 | 0.561017% |
| B | 18716 | 365 | 1.950203% |
| C | 18716 | 113 | 0.603761% |
| D | 18716 | 882 | 4.712545% |
Noise dominated data is calculated using 1-second bins in cleaned event files. If a bin has >2000 counts, and if more than 50% of those come from <1% of pixels, then it is considered to be noise-dominated and hence unusable.
| Quadrant | # 1 sec bins | Bins with >0 counts | Bins with >2000 counts | High rate bins dominated by noise | Noise dominated (total time) | Noise dominated (detector-on time) | Marked lightcurve |
|---|---|---|---|---|---|---|---|
| A | 20706 | 18720 | 3 | 3 | 0.01% | 0.02% |  |
| B | 20706 | 18720 | 157 | 157 | 0.76% | 0.84% |  |
| C | 20706 | 18721 | 34 | 34 | 0.16% | 0.18% | 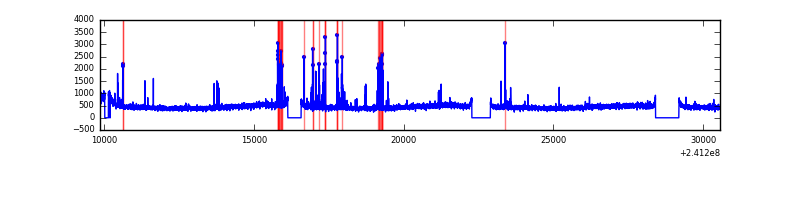 |
| D | 20706 | 18721 | 750 | 750 | 3.62% | 4.01% | 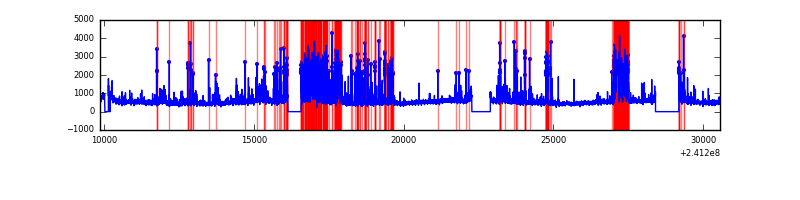 |
Top three noisy pixels from each quadrant. If the there are fewer than three noisy pixels in the level2.evt file, extra rows are filled as -1
| Pixel properties | Quadrant properties | ||||||
|---|---|---|---|---|---|---|---|
| Quadrant | DetID | PixID | Counts | Sigma | Mean | Median | Sigma |
| A | 8 | 15 | 154490 | 342.25 | 2192 | 2145 | 445.1 |
| A | 5 | 16 | 40706 | 86.63 | 2192 | 2145 | 445.1 |
| A | 8 | 5 | 25978 | 53.54 | 2192 | 2145 | 445.1 |
| B | 4 | 239 | 1184440 | 2800.85 | 2195 | 2140 | 422.1 |
| B | 11 | 51 | 267466 | 628.55 | 2195 | 2140 | 422.1 |
| B | 5 | 255 | 108853 | 252.8 | 2195 | 2140 | 422.1 |
| C | 4 | 254 | 350644 | 707.01 | 2116 | 2126 | 492.9 |
| C | 13 | 61 | 16166 | 28.48 | 2116 | 2126 | 492.9 |
| C | 8 | 128 | 12281 | 20.6 | 2116 | 2126 | 492.9 |
| D | 12 | 233 | 1635010 | 3295.96 | 2064 | 2003 | 495.5 |
| D | 8 | 195 | 1224758 | 2467.93 | 2064 | 2003 | 495.5 |
| D | 13 | 104 | 1143015 | 2302.95 | 2064 | 2003 | 495.5 |
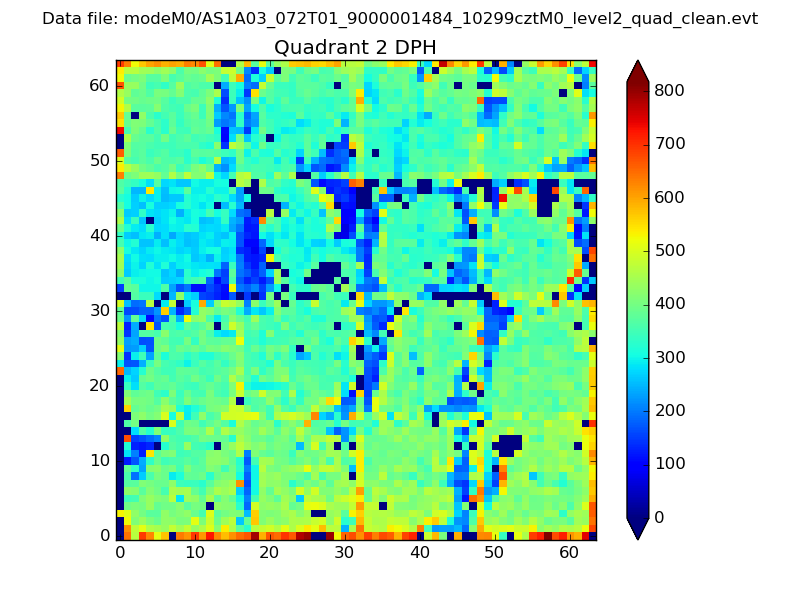
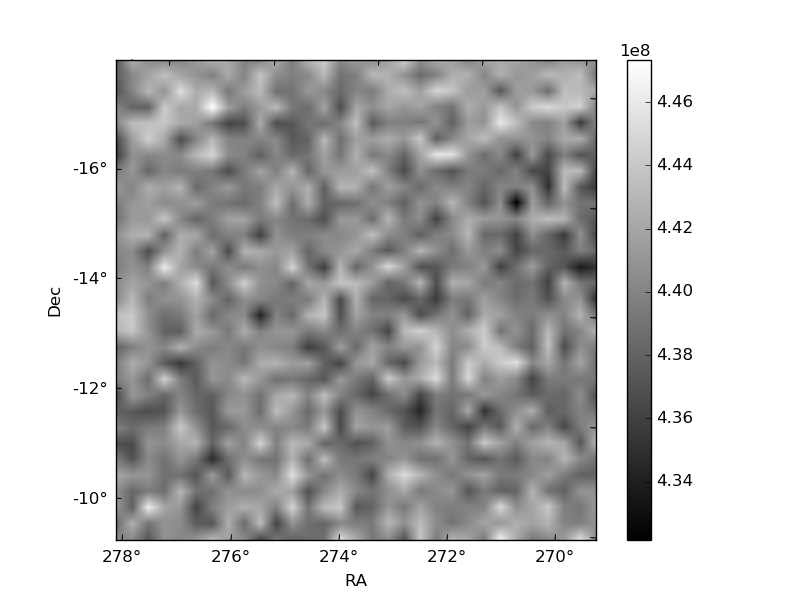
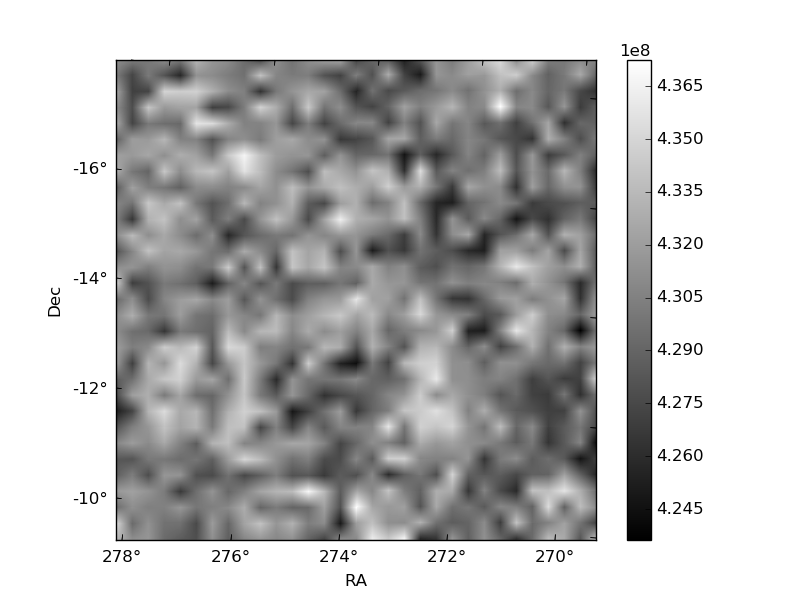
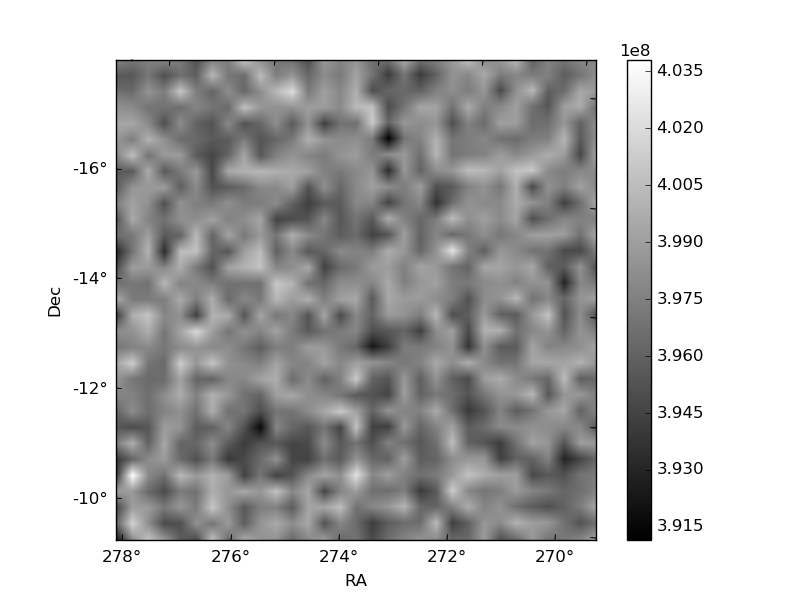
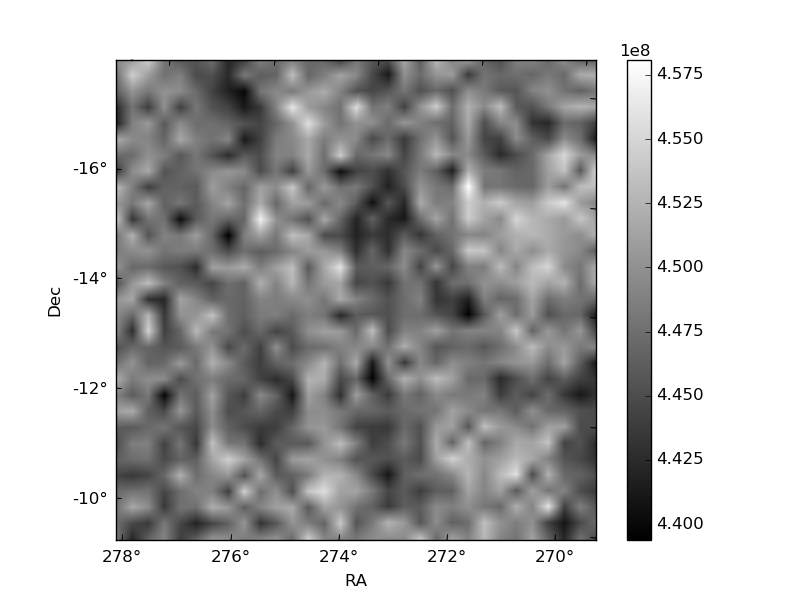
Histogram calculated using DETX and DETY for each event in the final _common_clean file
| Quadrant A | 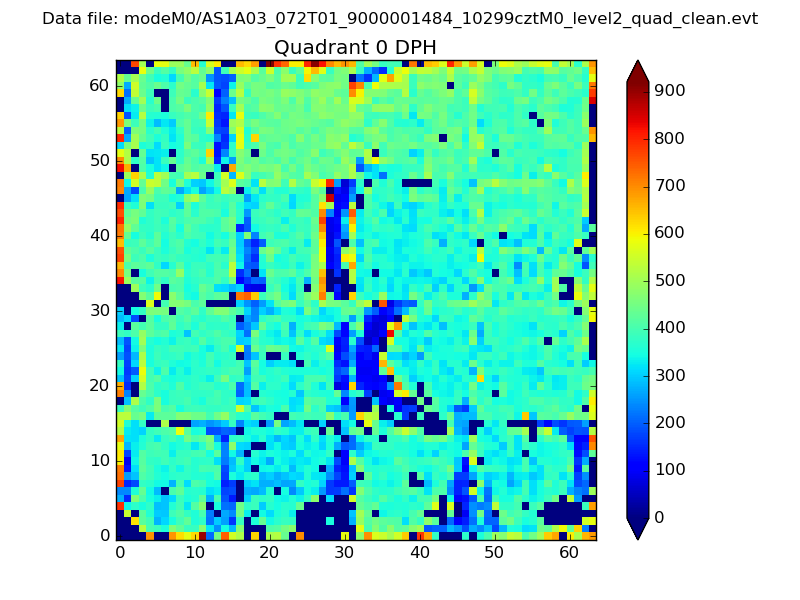 |
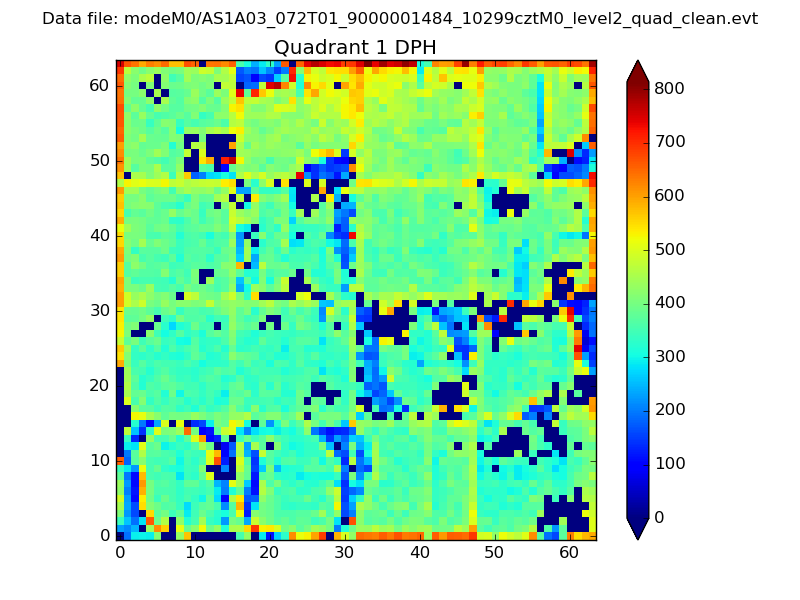 |
Quadrant B |
|---|---|---|---|
| Quadrant D | 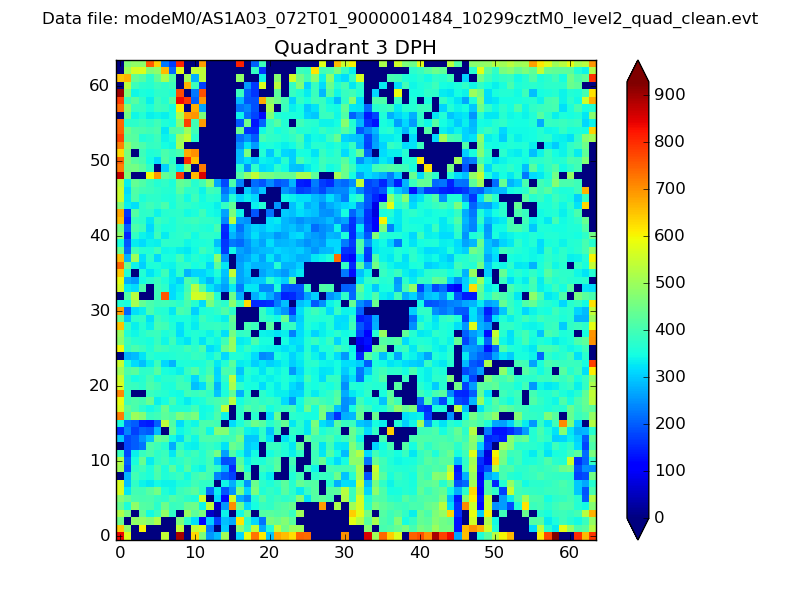 |
 |
Quadrant C |
| Plot type | Count rate plots | Images |
|---|---|---|
| Comparison with Poisson distribution Blue bars denote a histogram of data divided into 1 sec bins. Red curve is a Poisson curve with rate = median count rate of data. |
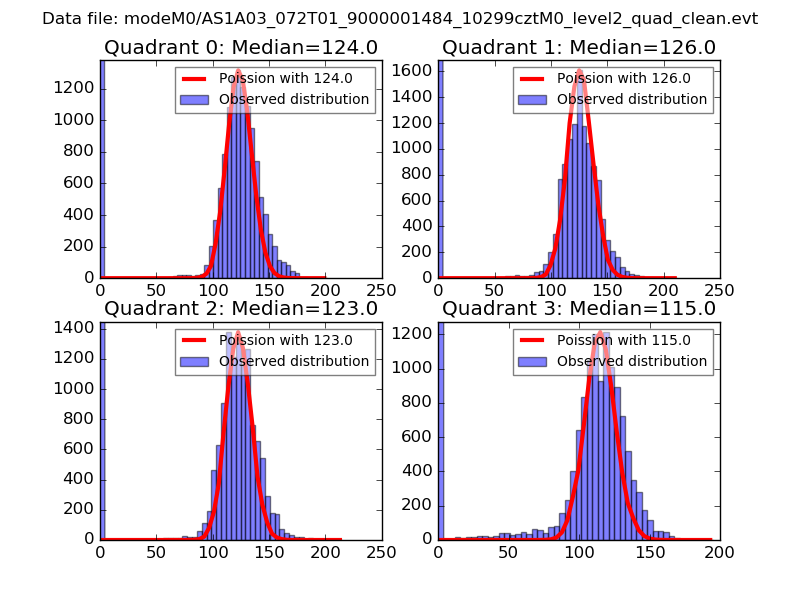 |
 |
| Quadrant-wise count rates Data is divided into 100 sec bins |
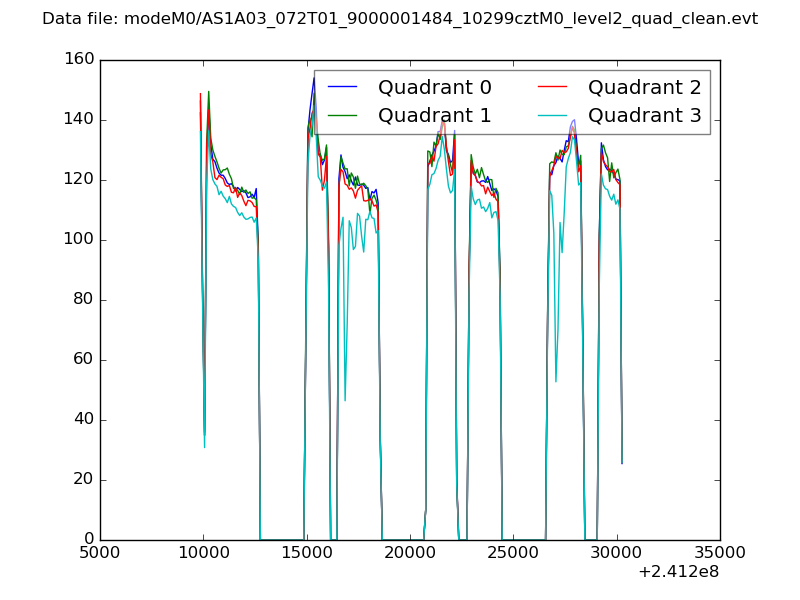 |
|
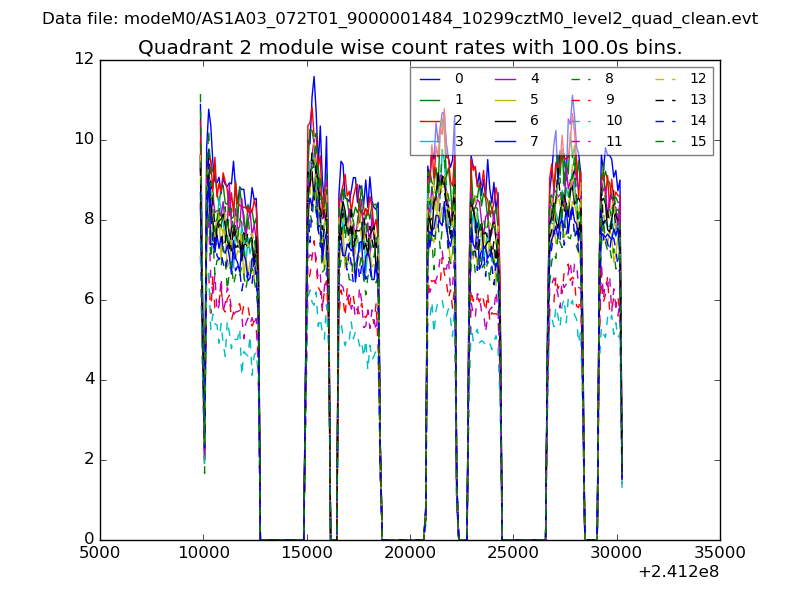
| Module-wise count rates for Quadrant A Data is divided into 100 sec bins |
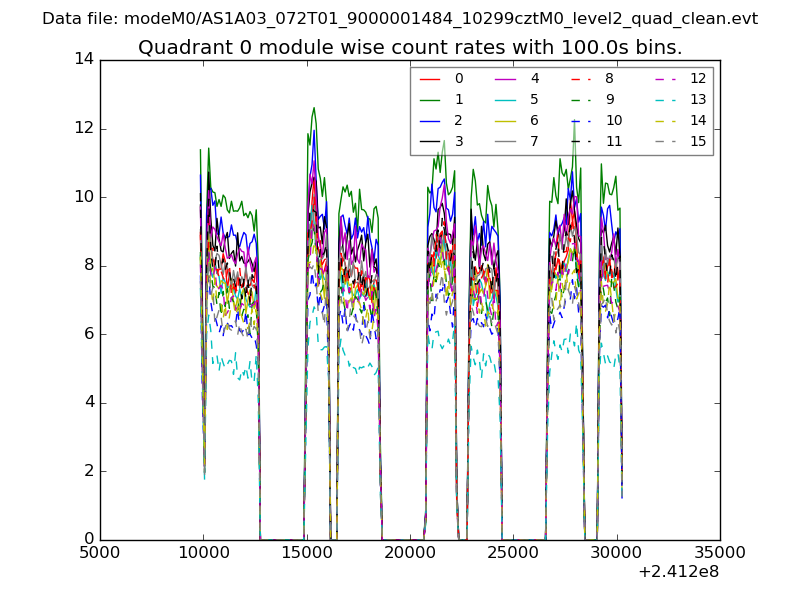 |
 |
| Module-wise count rates for Quadrant B Data is divided into 100 sec bins |
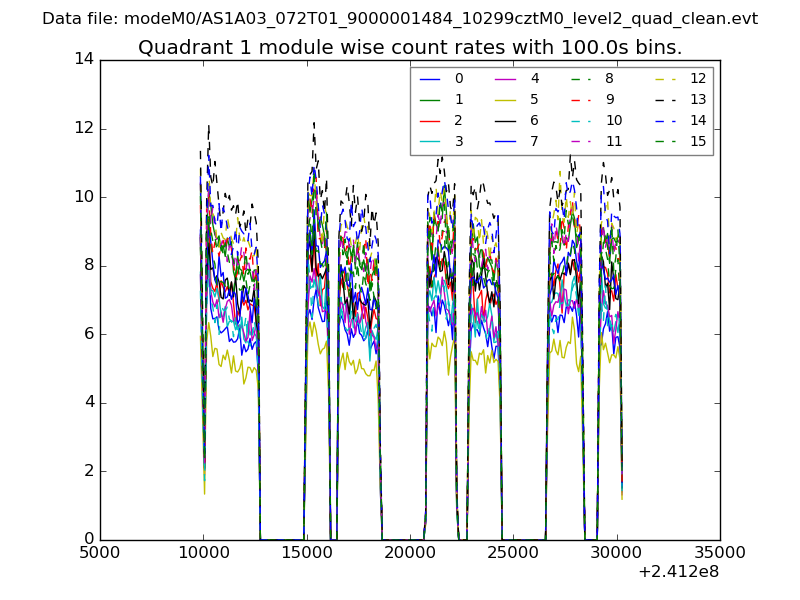 |
 |
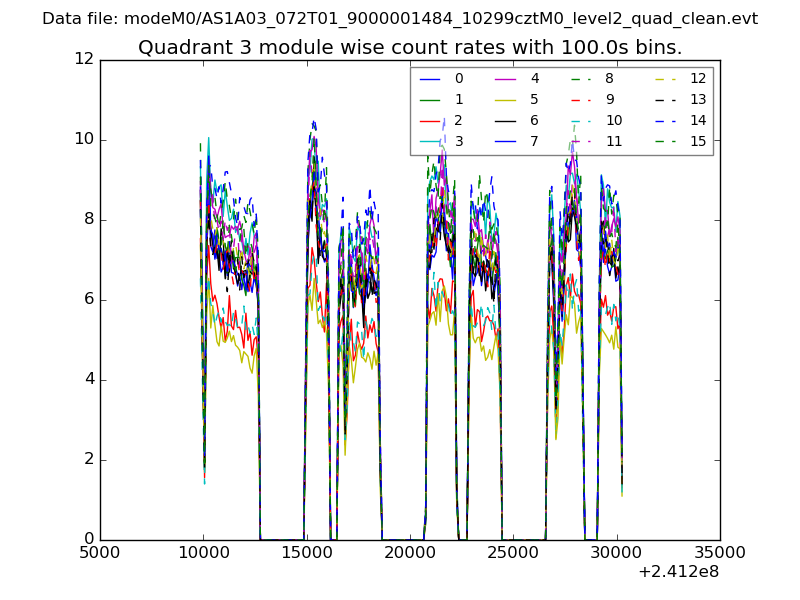
| Module-wise count rates for Quadrant C Data is divided into 100 sec bins |
 |
 |
| Module-wise count rates for Quadrant D Data is divided into 100 sec bins |
 |
 |
| Parameter | Plot |
|---|---|
| CZT HV Monitor | 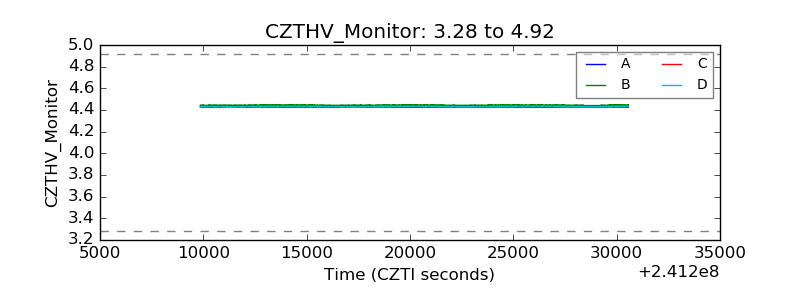 |
| D_VDD | 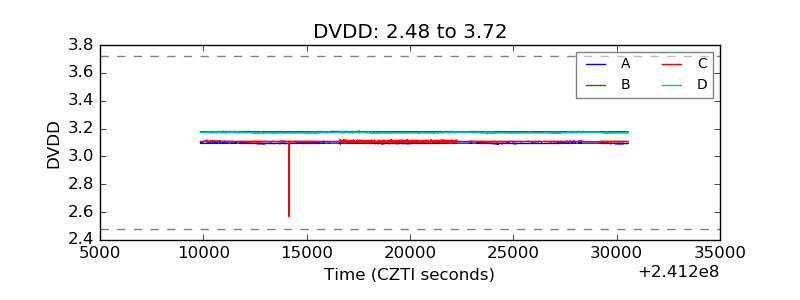 |
| Temperature 1 | 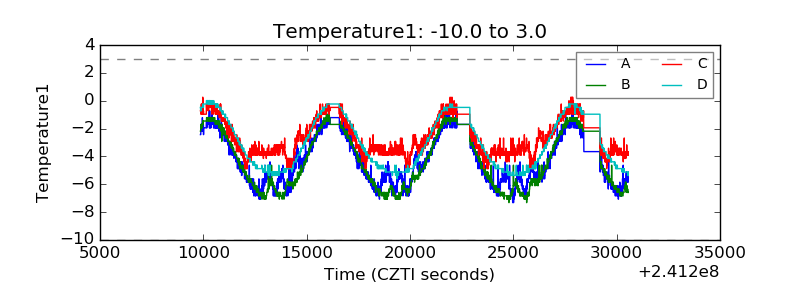 |
| Veto HV Monitor | 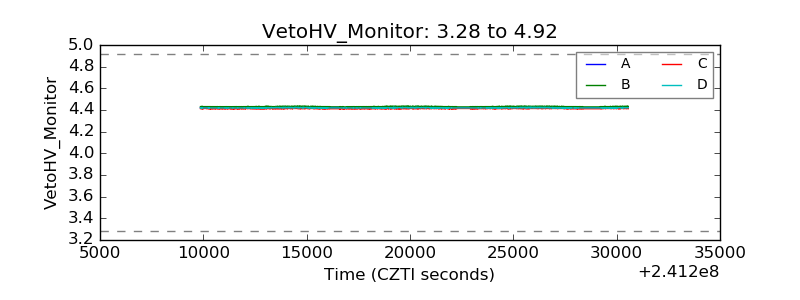 |
| Veto LLD | 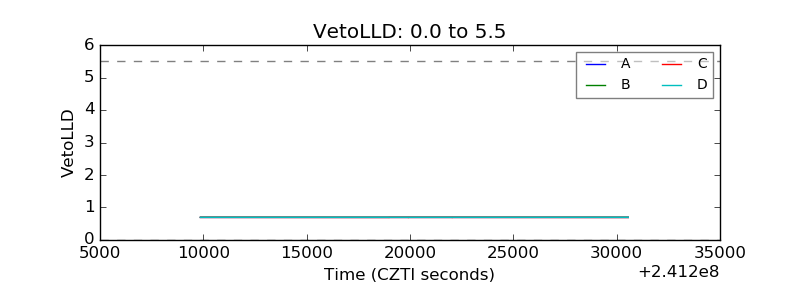 |
| Alpha Counter | 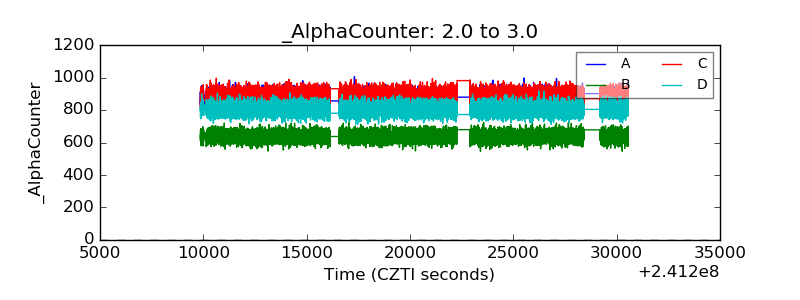 |
| _CPM_Rate | 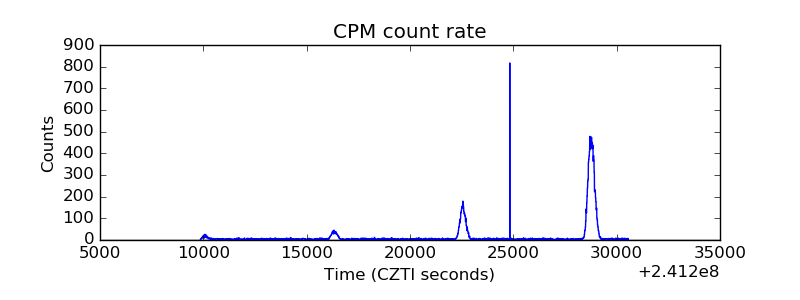 |
| CZT Counter | 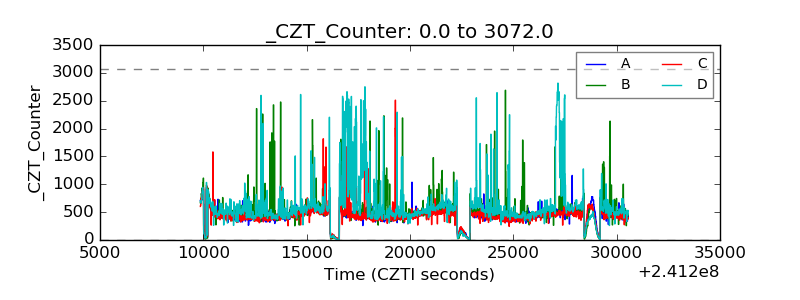 |
| +2.5 Volts monitor |  |
| +5 Volts monitor |  |
| _ROLL_ROT | 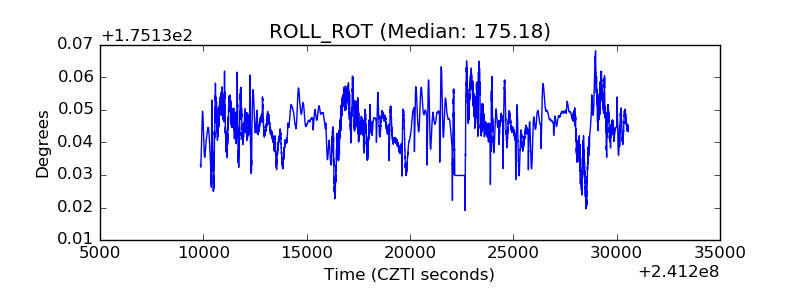 |
| _Roll_DEC | 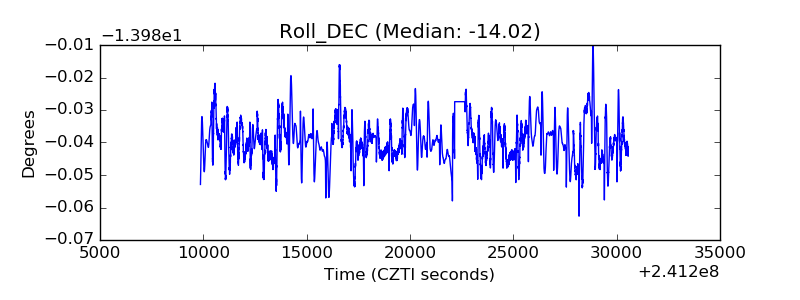 |
| _Roll_RA | 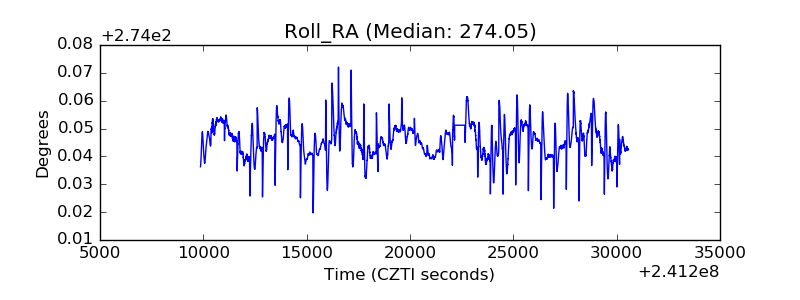 |
| Veto Counter | 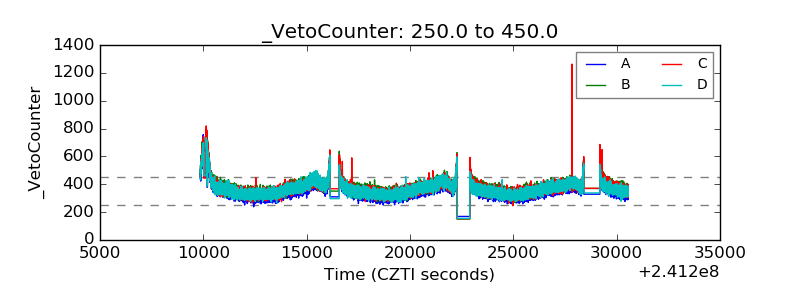 |