| Param | Original file | Final file |
|---|---|---|
| Filename | modeM0/AS1A03_072T01_9000001484_10300cztM0_level2.evt | modeM0/AS1A03_072T01_9000001484_10300cztM0_level2_quad_clean.evt |
| Size (bytes) | 297,887,040 | 47,998,080 |
| Size | 284.1 MB | 45.8 MB |
| Events in quadrant A | 2,045,745 | 286,142 |
| Events in quadrant B | 2,396,461 | 290,961 |
| Events in quadrant C | 1,965,430 | 285,171 |
| Events in quadrant D | 2,301,806 | 269,403 |
| Mode M0 | |||
|---|---|---|---|
| Quadrant | BADHDUFLAG | Total packets | Discarded packets |
| A | 0 | 9282 | 1 |
| B | 0 | 10258 | 1 |
| C | 0 | 9201 | 5 |
| D | 0 | 9871 | 3 |
| Mode SS | |||
|---|---|---|---|
| Quadrant | BADHDUFLAG | Total packets | Discarded packets |
| A | 0 | 96 | 0 |
| B | 0 | 96 | 0 |
| C | 0 | 96 | 0 |
| D | 0 | 96 | 0 |
| Mode M9 | |||
|---|---|---|---|
| Quadrant | BADHDUFLAG | Total packets | Discarded packets |
| A | 0 | 7 | 0 |
| B | 0 | 7 | 0 |
| C | 0 | 7 | 0 |
| D | 0 | 7 | 0 |
| Quadrant | Total seconds | Saturated seconds | Saturation percentage |
|---|---|---|---|
| A | 4564 | 9 | 0.197195% |
| B | 4564 | 52 | 1.139351% |
| C | 4562 | 6 | 0.131521% |
| D | 4563 | 27 | 0.591716% |
Noise dominated data is calculated using 1-second bins in cleaned event files. If a bin has >2000 counts, and if more than 50% of those come from <1% of pixels, then it is considered to be noise-dominated and hence unusable.
| Quadrant | # 1 sec bins | Bins with >0 counts | Bins with >2000 counts | High rate bins dominated by noise | Noise dominated (total time) | Noise dominated (detector-on time) | Marked lightcurve |
|---|---|---|---|---|---|---|---|
| A | 5344 | 4565 | 0 | 0 | 0.00% | 0.00% | 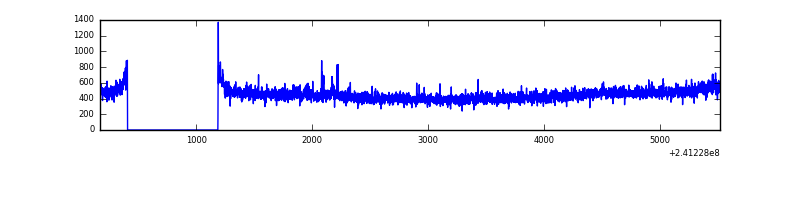 |
| B | 5344 | 4565 | 26 | 26 | 0.49% | 0.57% | 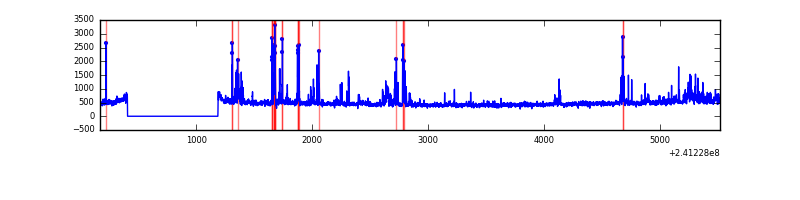 |
| C | 5344 | 4565 | 0 | 0 | 0.00% | 0.00% | 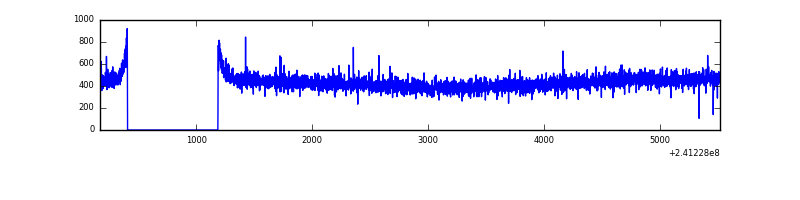 |
| D | 5344 | 4565 | 17 | 17 | 0.32% | 0.37% | 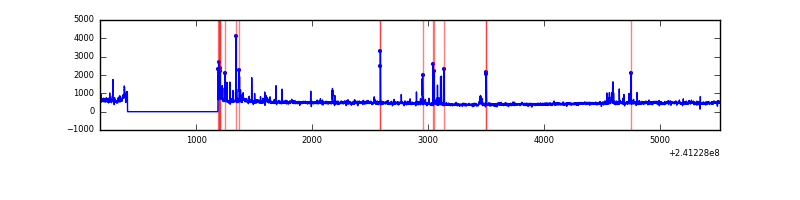 |
Top three noisy pixels from each quadrant. If the there are fewer than three noisy pixels in the level2.evt file, extra rows are filled as -1
| Pixel properties | Quadrant properties | ||||||
|---|---|---|---|---|---|---|---|
| Quadrant | DetID | PixID | Counts | Sigma | Mean | Median | Sigma |
| A | 8 | 15 | 47155 | 434.91 | 516 | 506 | 107.3 |
| A | 8 | 5 | 5624 | 47.71 | 516 | 506 | 107.3 |
| A | 0 | 226 | 4786 | 39.9 | 516 | 506 | 107.3 |
| B | 4 | 239 | 278018 | 2721.69 | 522 | 509 | 102.0 |
| B | 11 | 51 | 36297 | 350.99 | 522 | 509 | 102.0 |
| B | 0 | 214 | 34558 | 333.94 | 522 | 509 | 102.0 |
| C | 13 | 61 | 3795 | 27.86 | 503 | 506 | 118.1 |
| C | 14 | 234 | 2496 | 16.86 | 503 | 506 | 118.1 |
| C | 14 | 67 | 1974 | 12.43 | 503 | 506 | 118.1 |
| D | 8 | 195 | 211055 | 1736.75 | 496 | 481 | 121.2 |
| D | 12 | 233 | 47807 | 390.33 | 496 | 481 | 121.2 |
| D | 2 | 33 | 47413 | 387.08 | 496 | 481 | 121.2 |
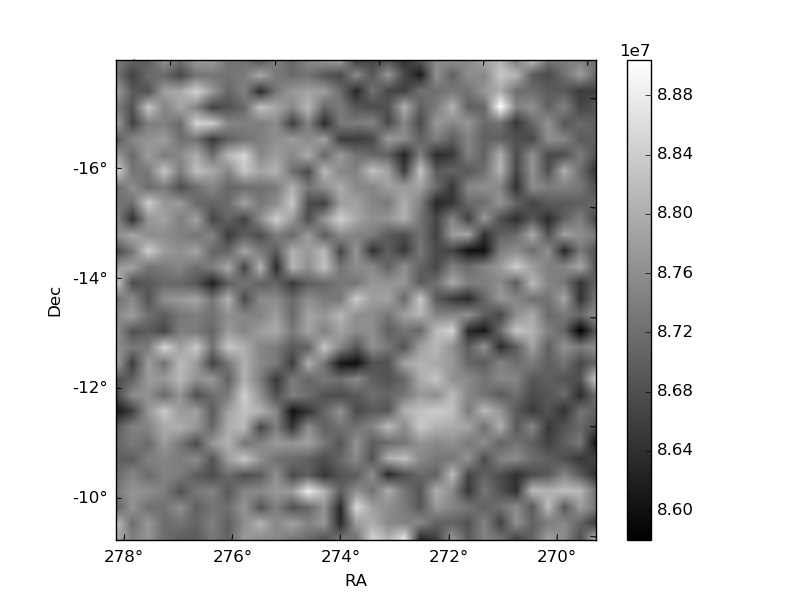
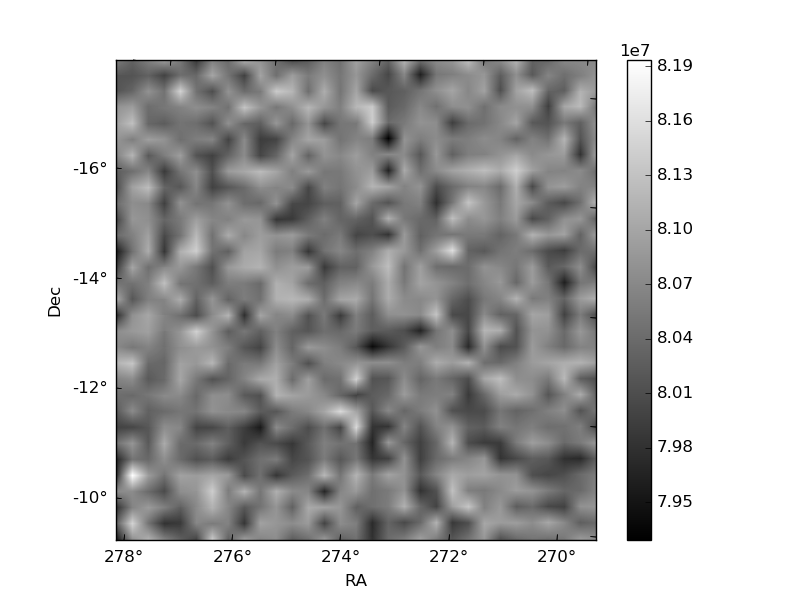
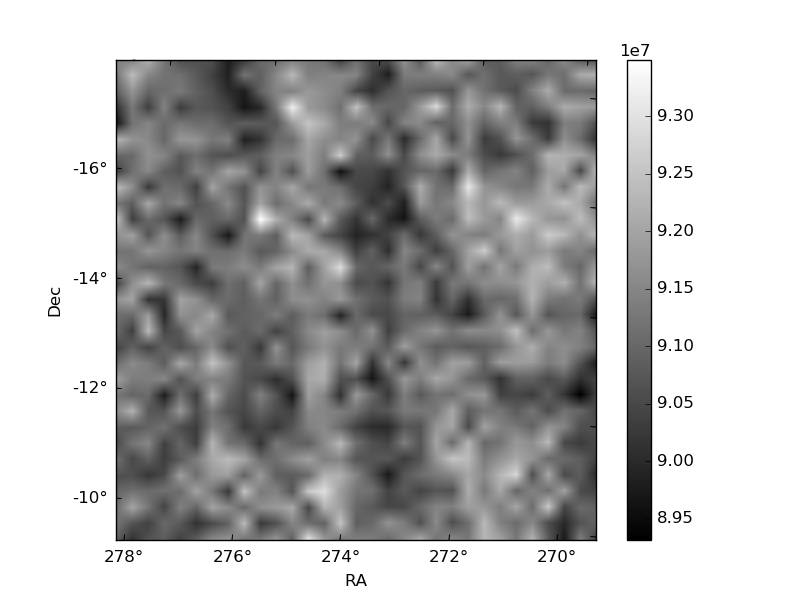
Histogram calculated using DETX and DETY for each event in the final _common_clean file
| Quadrant A | 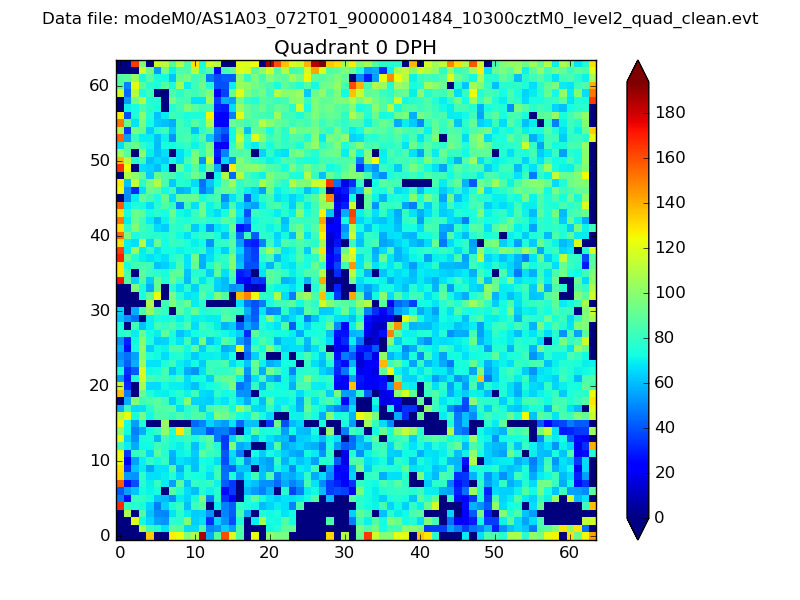 |
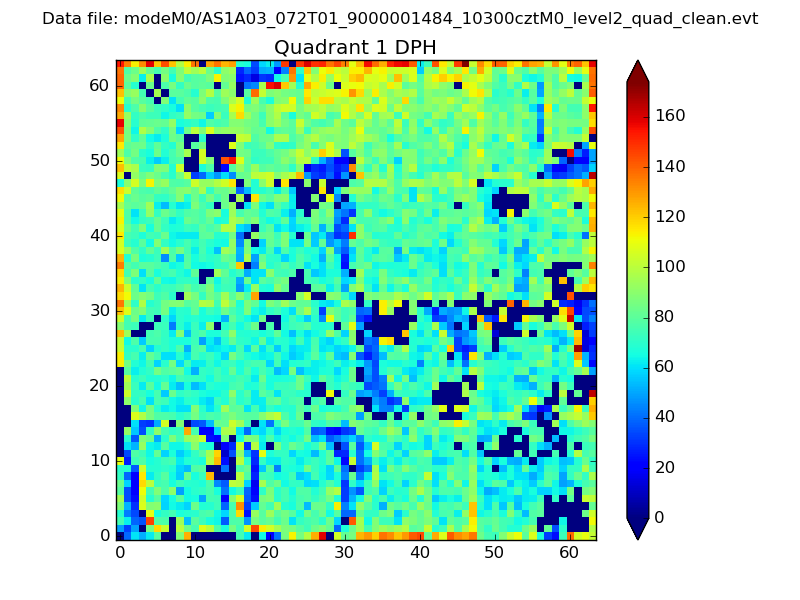 |
Quadrant B |
|---|---|---|---|
| Quadrant D | 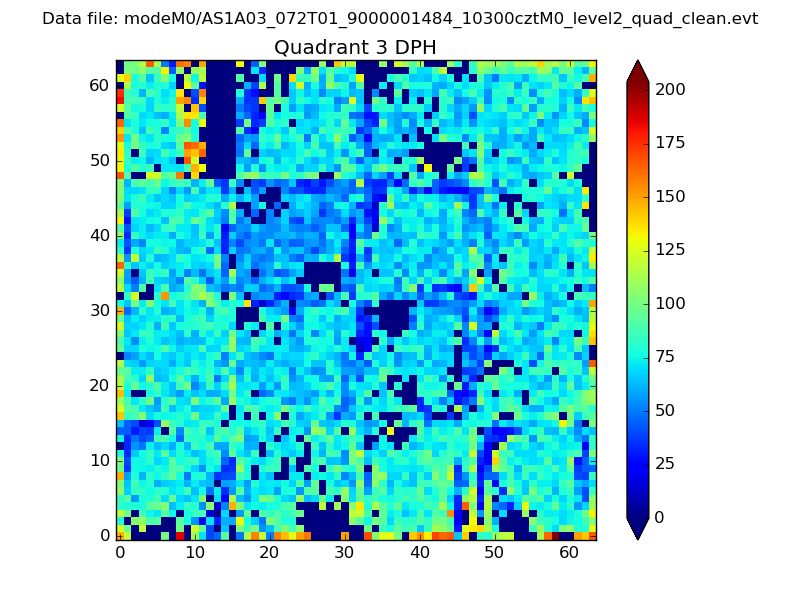 |
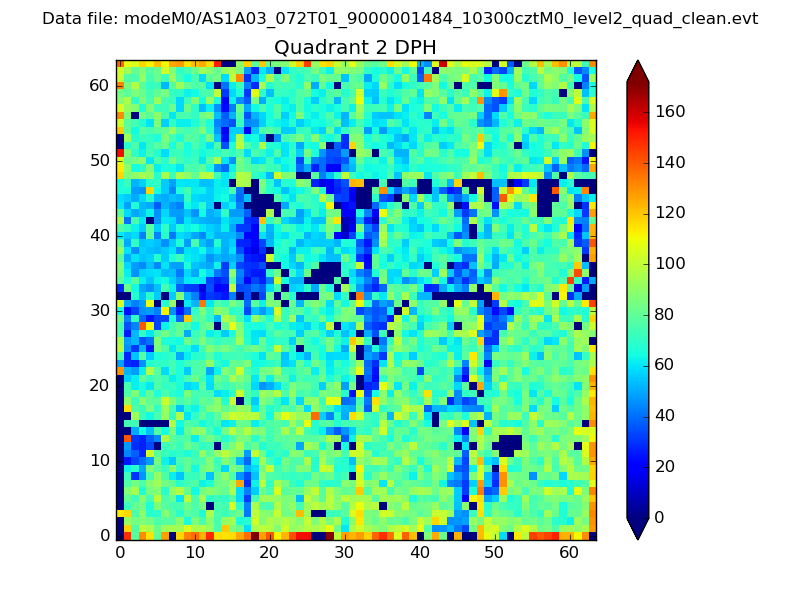 |
Quadrant C |
| Plot type | Count rate plots | Images |
|---|---|---|
| Comparison with Poisson distribution Blue bars denote a histogram of data divided into 1 sec bins. Red curve is a Poisson curve with rate = median count rate of data. |
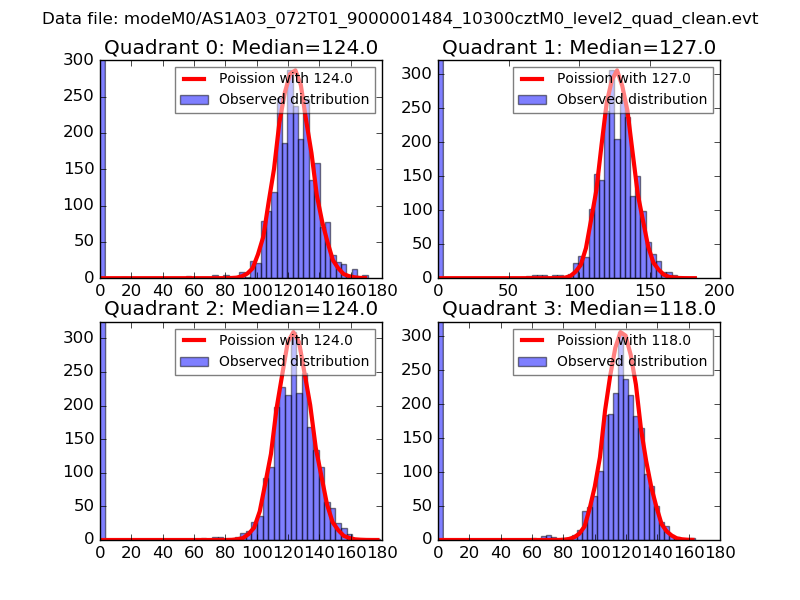 |
 |
| Quadrant-wise count rates Data is divided into 100 sec bins |
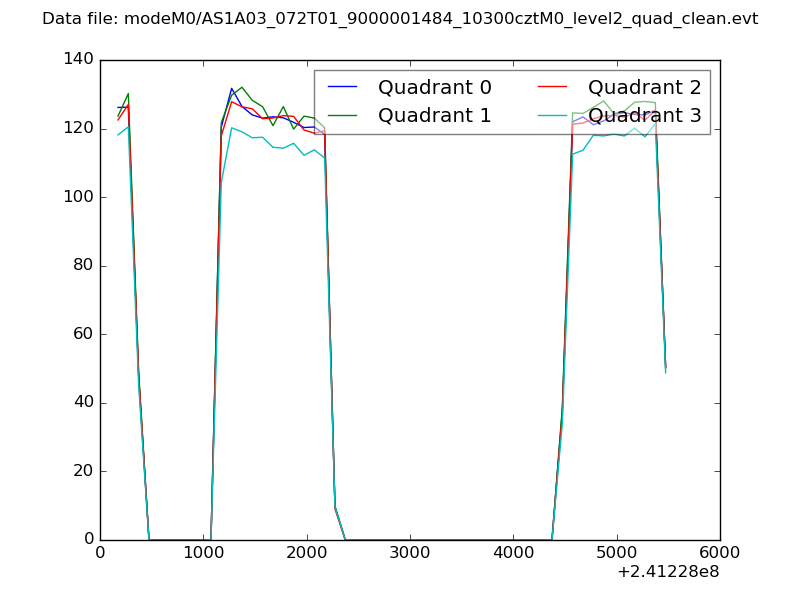 |
|
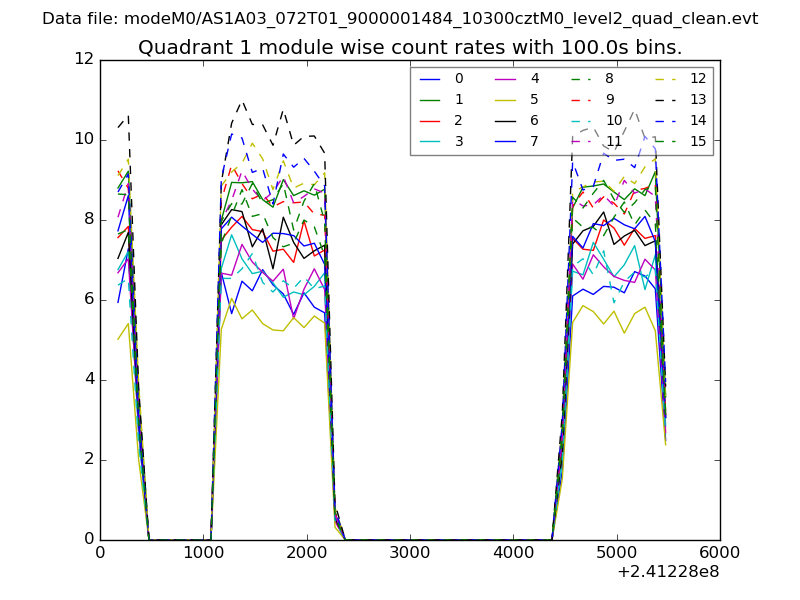
| Module-wise count rates for Quadrant A Data is divided into 100 sec bins |
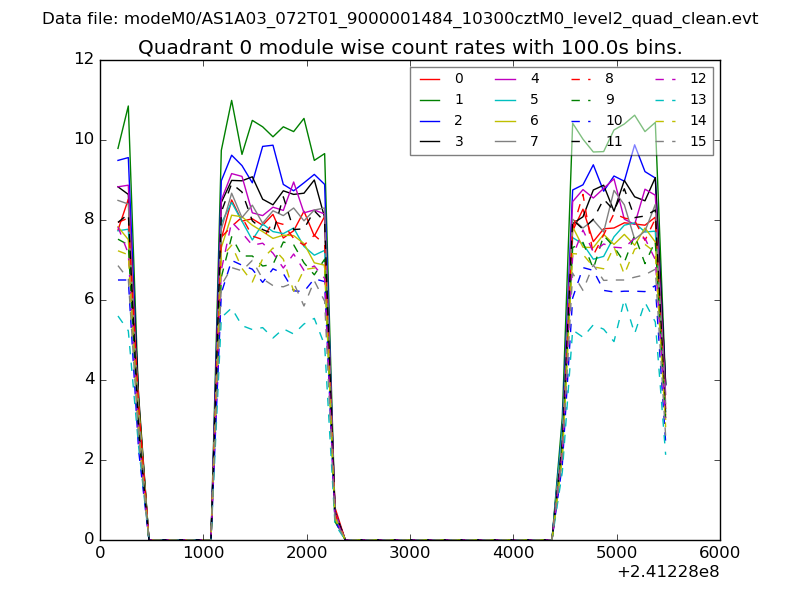 |
 |
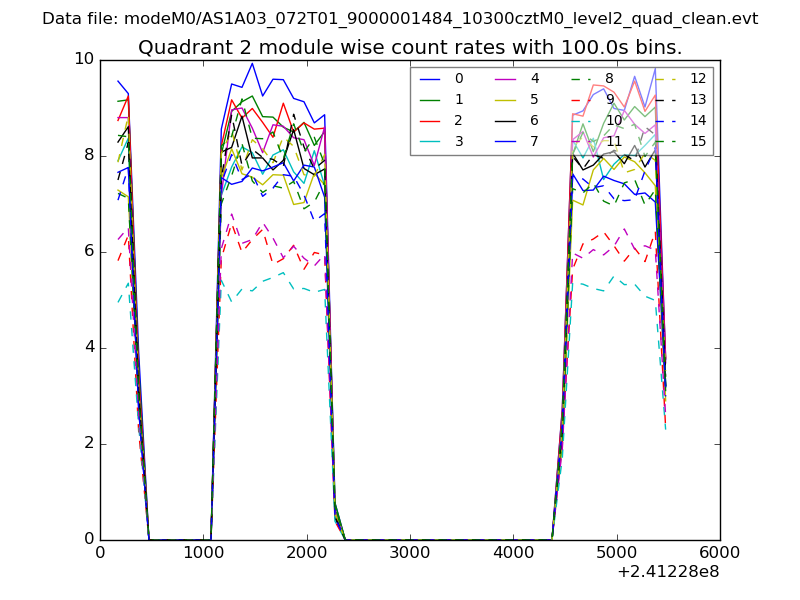
| Module-wise count rates for Quadrant B Data is divided into 100 sec bins |
 |
 |
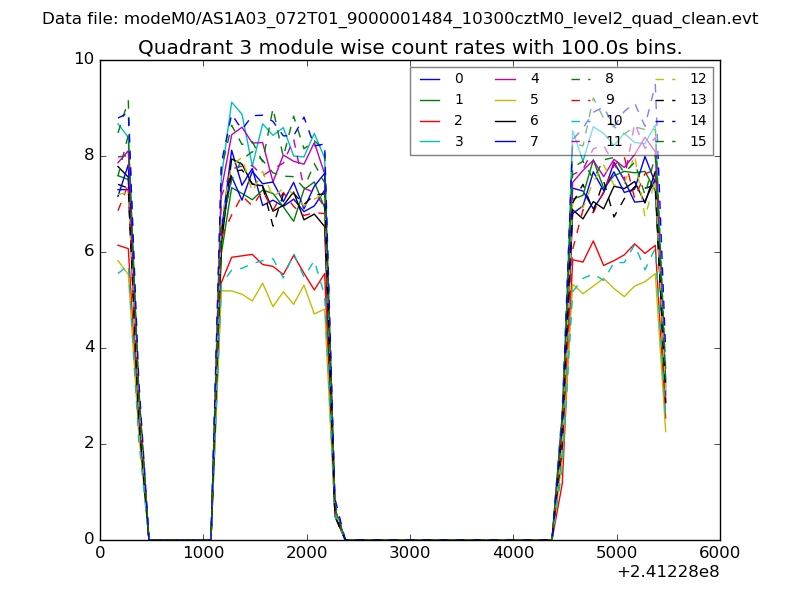
| Module-wise count rates for Quadrant C Data is divided into 100 sec bins |
 |
 |
| Module-wise count rates for Quadrant D Data is divided into 100 sec bins |
 |
 |
| Parameter | Plot |
|---|---|
| CZT HV Monitor | 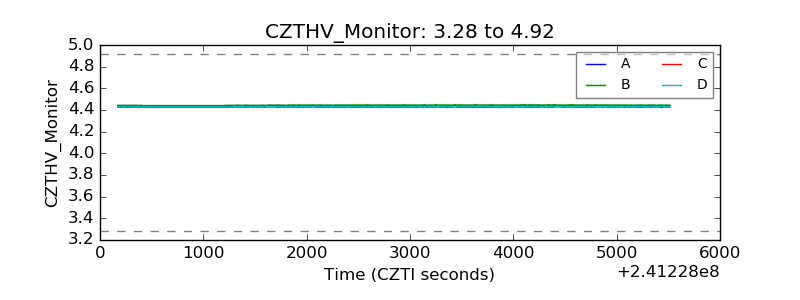 |
| D_VDD |  |
| Temperature 1 | 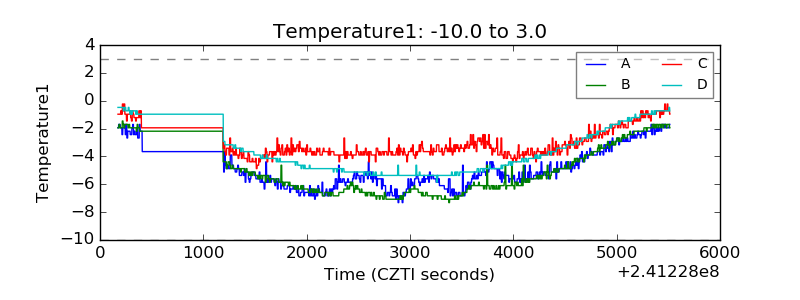 |
| Veto HV Monitor |  |
| Veto LLD | 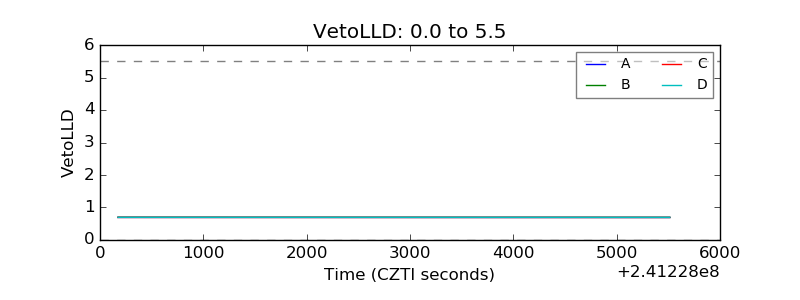 |
| Alpha Counter | 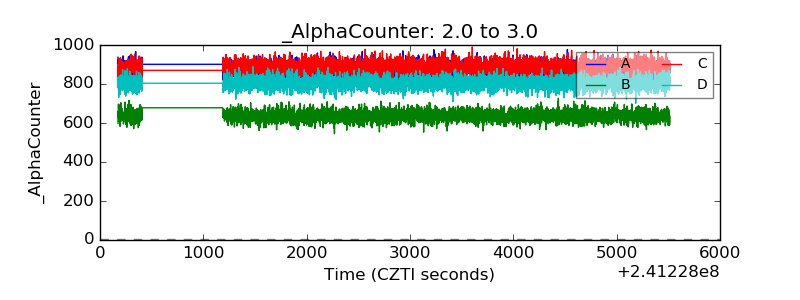 |
| _CPM_Rate | 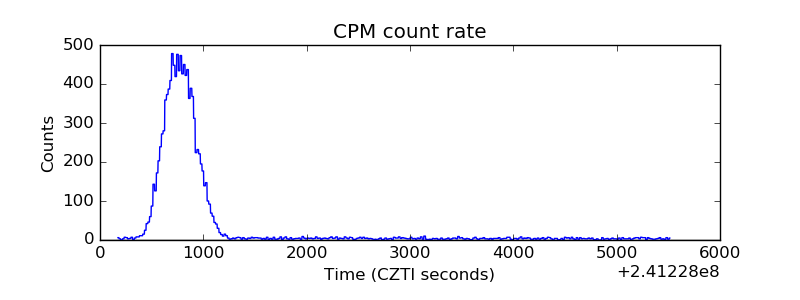 |
| CZT Counter | 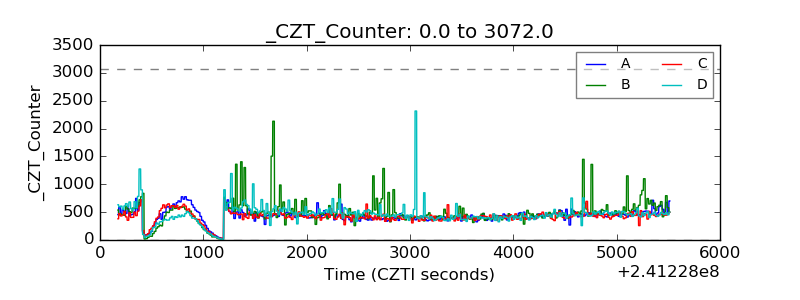 |
| +2.5 Volts monitor |  |
| +5 Volts monitor |  |
| _ROLL_ROT | 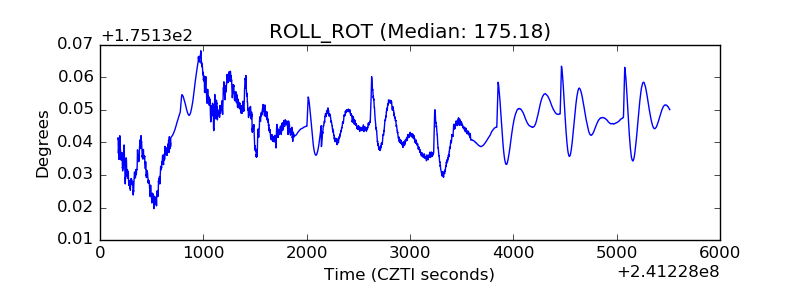 |
| _Roll_DEC | 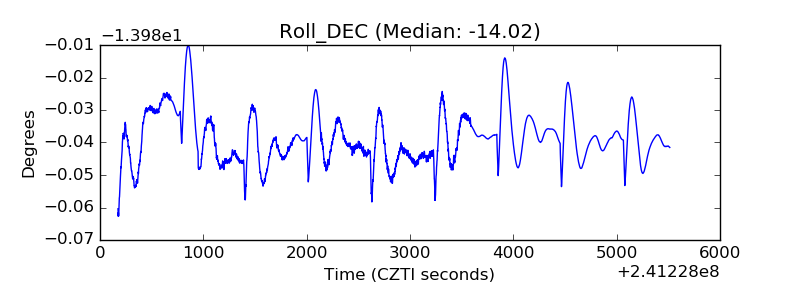 |
| _Roll_RA |  |
| Veto Counter | 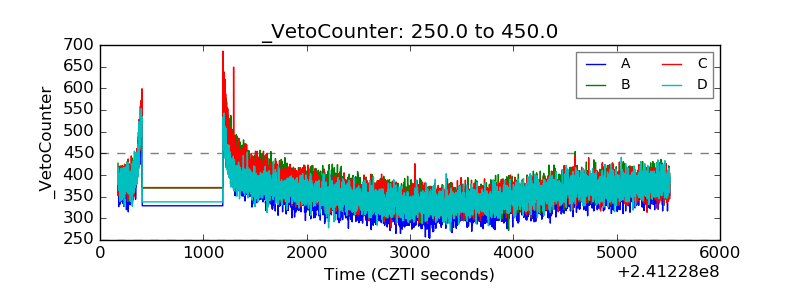 |