| Param | Original file | Final file |
|---|---|---|
| Filename | modeM0/AS1A03_124T01_9000001486cztM0_level2.fits | modeM0/AS1A03_124T01_9000001486cztM0_level2_quad_clean.evt |
| Size (bytes) | 1,043,686,080 | 1,065,159,360 |
| Size | 995.3 MB | 1015.8 MB |
| Events in quadrant A | 6,371,676 | 6,517,418 |
| Events in quadrant B | 6,014,506 | 6,347,420 |
| Events in quadrant C | 6,209,544 | 6,116,426 |
| Events in quadrant D | 5,572,425 | 5,842,260 |
| Mode M0 | |||
|---|---|---|---|
| Quadrant | BADHDUFLAG | Total packets | Discarded packets |
| A | 0 | 228691 | 0 |
| B | 0 | 243218 | 0 |
| C | 0 | 222628 | 0 |
| D | 0 | 252440 | 0 |
| Mode M9 | |||
|---|---|---|---|
| Quadrant | BADHDUFLAG | Total packets | Discarded packets |
| A | 0 | 206 | 0 |
| B | 0 | 207 | 0 |
| C | 0 | 207 | 0 |
| D | 0 | 207 | 0 |
| Mode SS | |||
|---|---|---|---|
| Quadrant | BADHDUFLAG | Total packets | Discarded packets |
| A | 0 | 2245 | 0 |
| B | 0 | 2229 | 0 |
| C | 0 | 2242 | 0 |
| D | 0 | 2235 | 0 |
| Quadrant | Total seconds | Saturated seconds | Saturation percentage |
|---|---|---|---|
| A | 107932 | 1303 | 1.207242% |
| B | 106311 | 2503 | 2.354413% |
| C | 108170 | 857 | 0.792271% |
| D | 111676 | 1471 | 1.317203% |
Noise dominated data is calculated using 1-second bins in cleaned event files. If a bin has >2000 counts, and if more than 50% of those come from <1% of pixels, then it is considered to be noise-dominated and hence unusable.
| Quadrant | # 1 sec bins | Bins with >0 counts | Bins with >2000 counts | High rate bins dominated by noise | Noise dominated (total time) | Noise dominated (detector-on time) | Marked lightcurve |
|---|---|---|---|---|---|---|---|
| A | 135202 | 112674 | 0 | 0 | 0.00% | 0.00% | 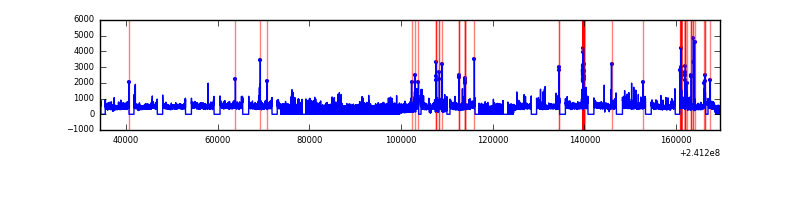 |
| B | 135201 | 111214 | 0 | 0 | 0.00% | 0.00% |  |
| C | 135202 | 112743 | 0 | 0 | 0.00% | 0.00% | 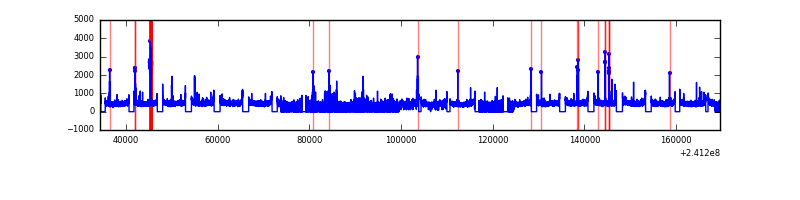 |
| D | 135202 | 113214 | 0 | 0 | 0.00% | 0.00% | 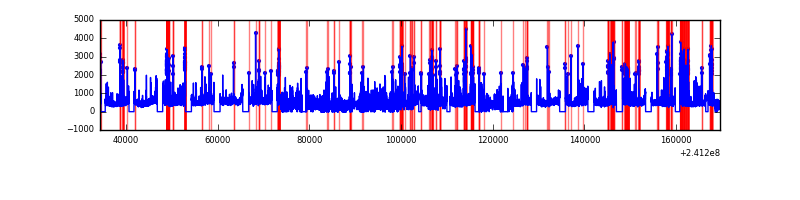 |
Top three noisy pixels from each quadrant. If the there are fewer than three noisy pixels in the level2.evt file, extra rows are filled as -1
| Pixel properties | Quadrant properties | ||||||
|---|---|---|---|---|---|---|---|
| Quadrant | DetID | PixID | Counts | Sigma | Mean | Median | Sigma |
| A | 0 | 29 | 6044 | 10.99 | 1657 | 1554 | 408.7 |
| A | 7 | 110 | 5209 | 8.94 | 1657 | 1554 | 408.7 |
| A | 9 | 19 | 4689 | 7.67 | 1657 | 1554 | 408.7 |
| B | 2 | 9 | 5060 | 11.44 | 1585 | 1514 | 309.9 |
| B | 5 | 128 | 4043 | 8.16 | 1585 | 1514 | 309.9 |
| B | 14 | 254 | 3993 | 8.0 | 1585 | 1514 | 309.9 |
| C | 1 | 80 | 4592 | 7.25 | 1637 | 1523 | 423.5 |
| C | 1 | 81 | 4540 | 7.12 | 1637 | 1523 | 423.5 |
| C | 12 | 241 | 4230 | 6.39 | 1637 | 1523 | 423.5 |
| D | 6 | 231 | 4115 | 6.24 | 1592 | 1447 | 427.6 |
| D | 3 | 14 | 4080 | 6.16 | 1592 | 1447 | 427.6 |
| D | 3 | 31 | 3890 | 5.71 | 1592 | 1447 | 427.6 |
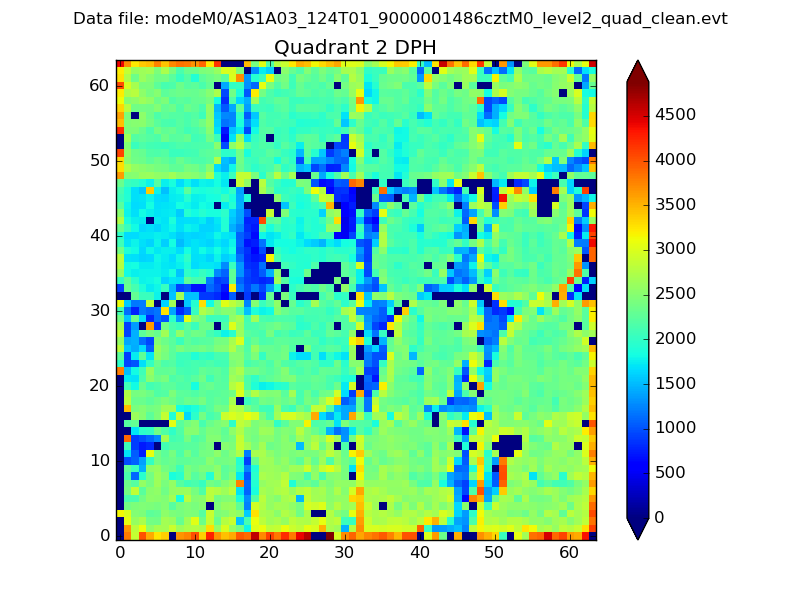
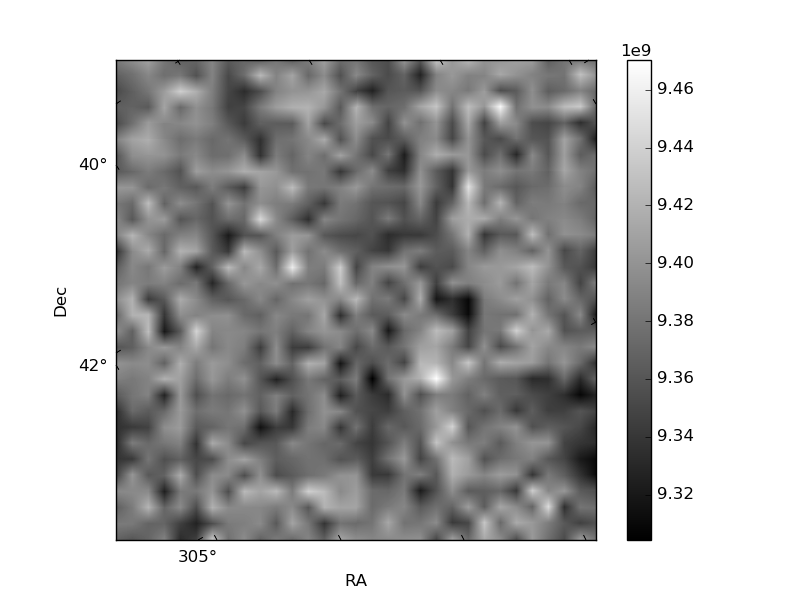
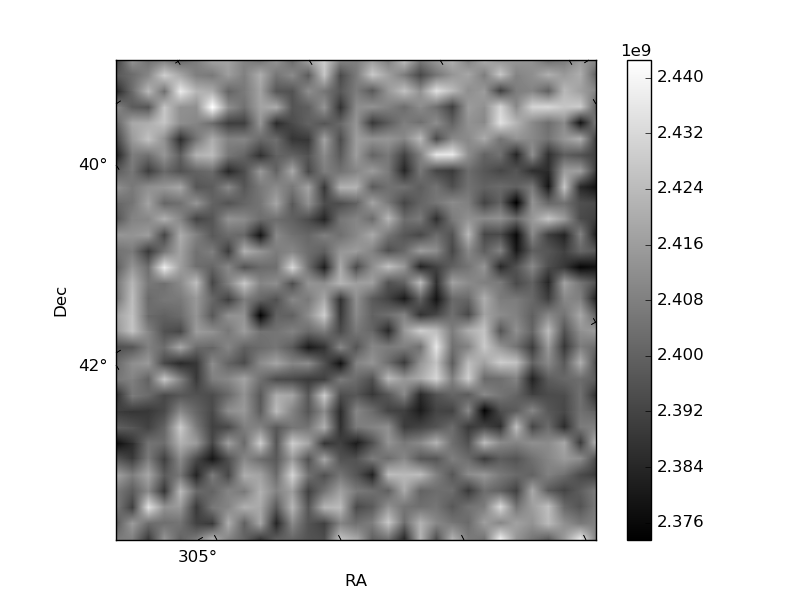
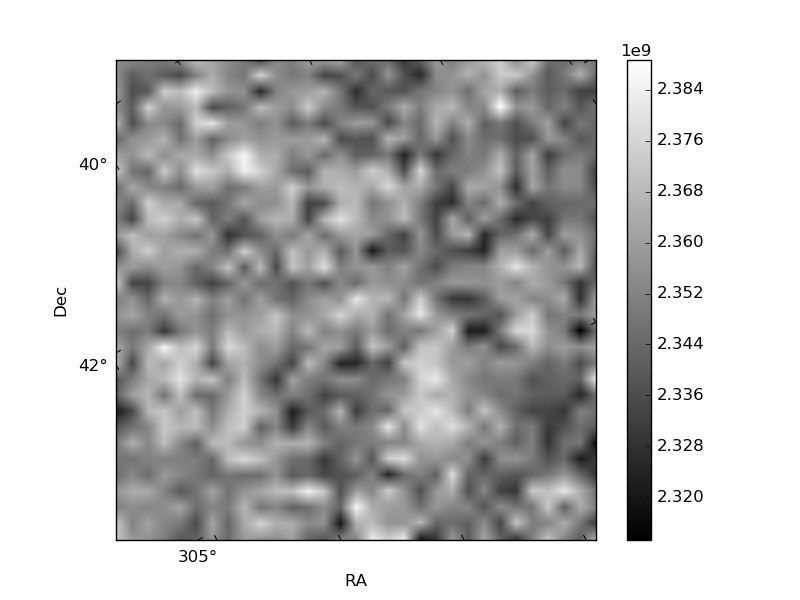
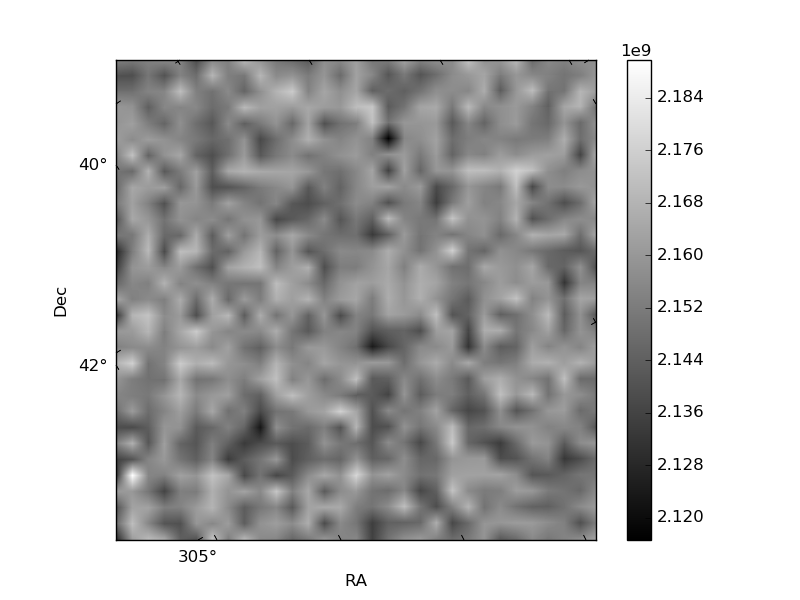
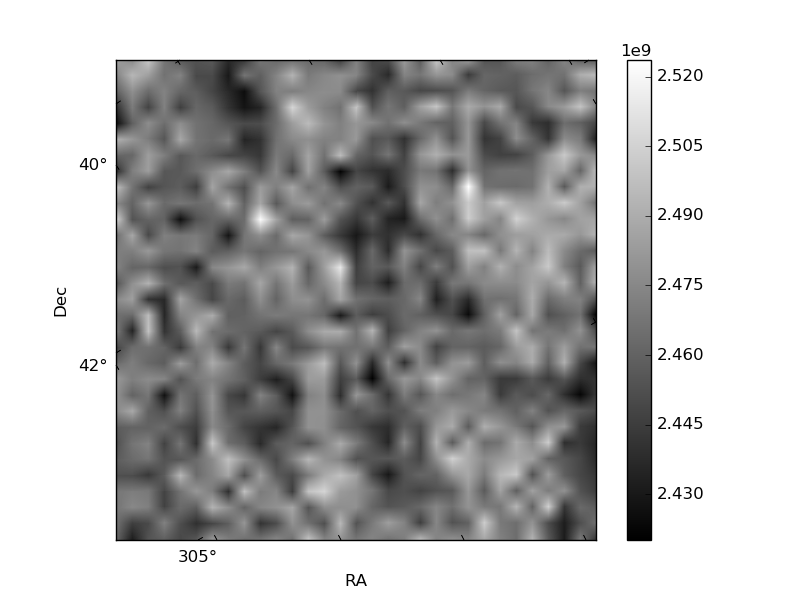
Histogram calculated using DETX and DETY for each event in the final _common_clean file
| Quadrant A | 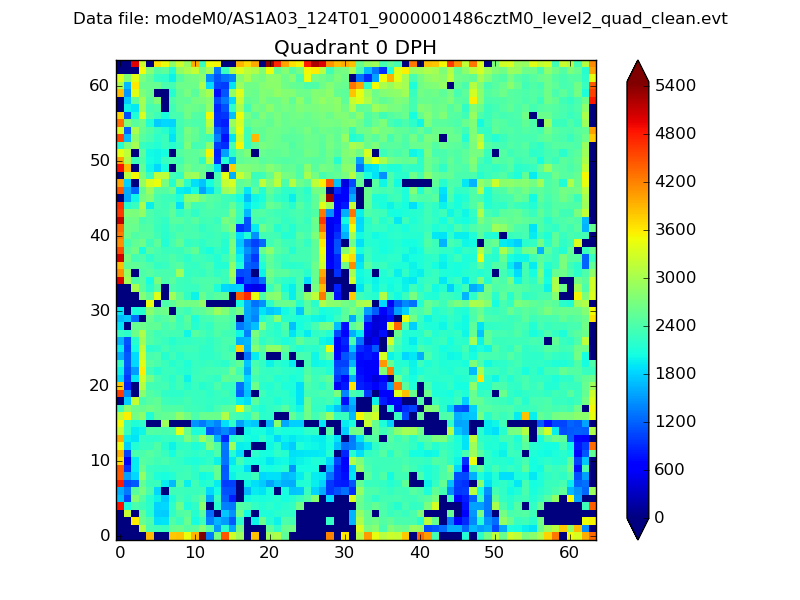 |
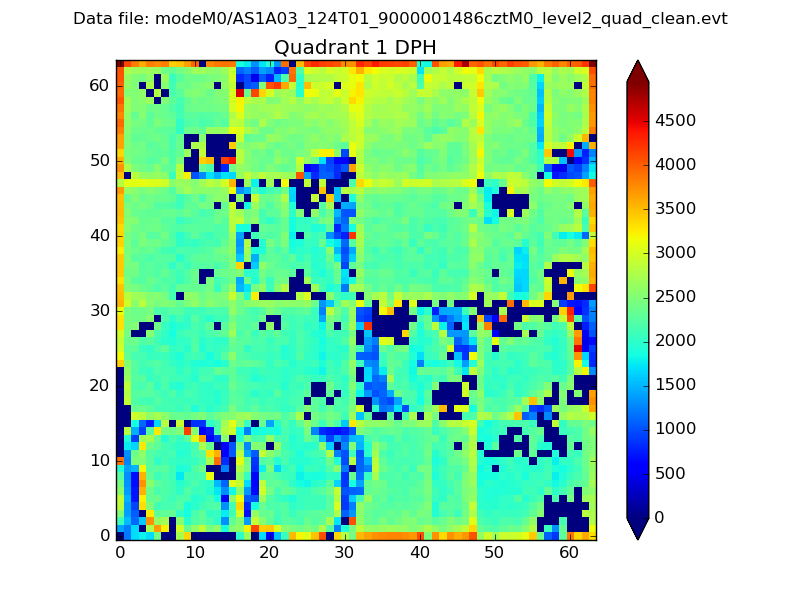 |
Quadrant B |
|---|---|---|---|
| Quadrant D | 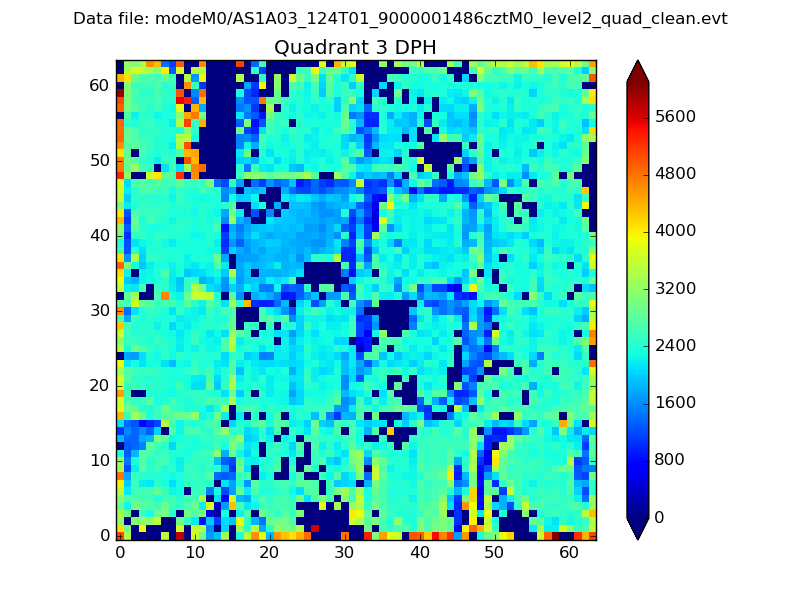 |
 |
Quadrant C |
| Plot type | Count rate plots | Images |
|---|---|---|
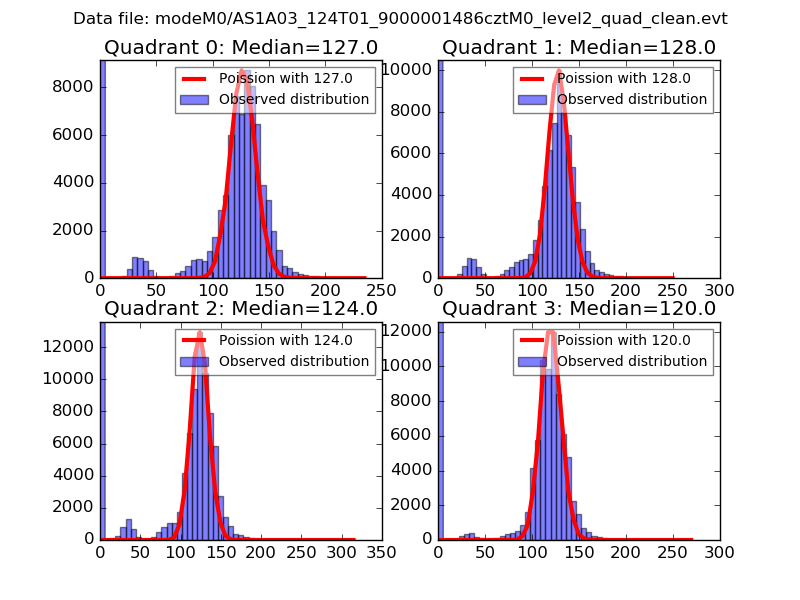
| Comparison with Poisson distribution Blue bars denote a histogram of data divided into 1 sec bins. Red curve is a Poisson curve with rate = median count rate of data. |
 |
 |
| Quadrant-wise count rates Data is divided into 100 sec bins |
 |
|
| Module-wise count rates for Quadrant A Data is divided into 100 sec bins |
 |
 |
| Module-wise count rates for Quadrant B Data is divided into 100 sec bins |
 |
 |
| Module-wise count rates for Quadrant C Data is divided into 100 sec bins |
 |
 |
| Module-wise count rates for Quadrant D Data is divided into 100 sec bins |
 |
 |
| Parameter | Plot |
|---|---|
| CZT HV Monitor | 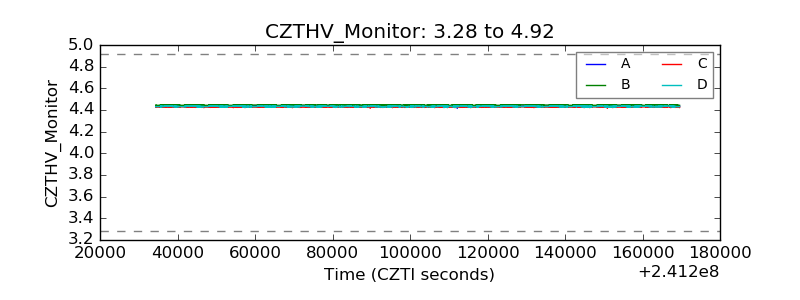 |
| D_VDD | 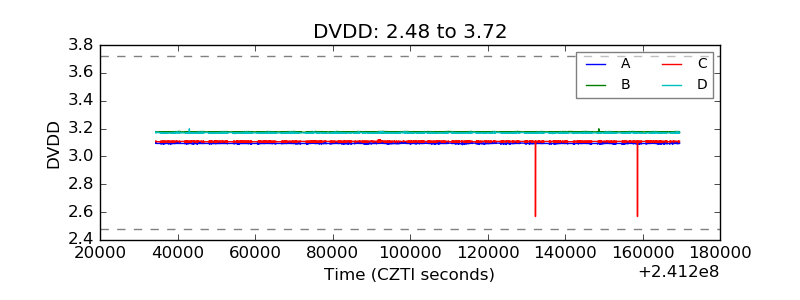 |
| Temperature 1 | 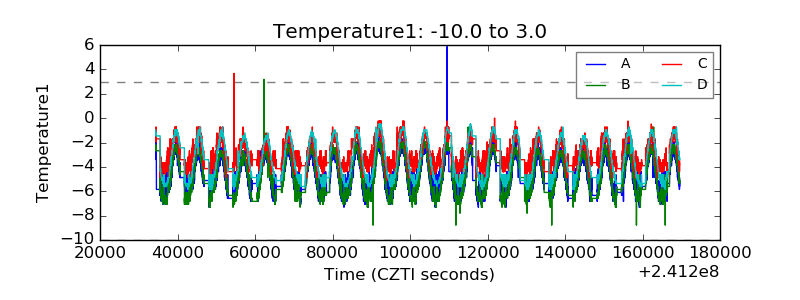 |
| Veto HV Monitor |  |
| Veto LLD | 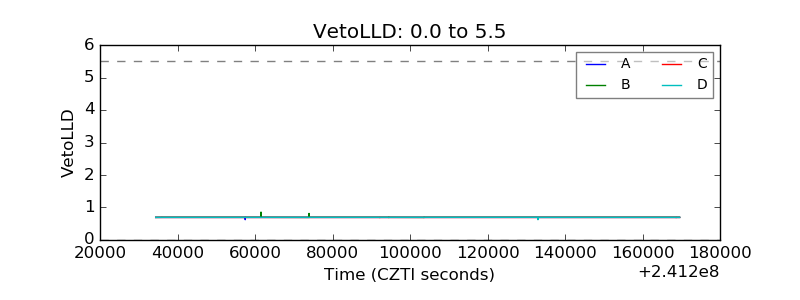 |
| Alpha Counter |  |
| _CPM_Rate | 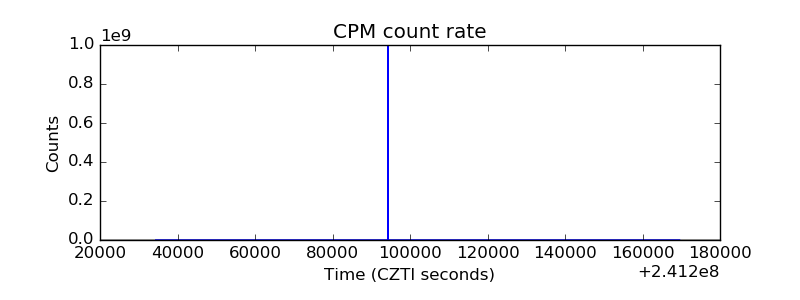 |
| CZT Counter |  |
| +2.5 Volts monitor |  |
| +5 Volts monitor |  |
| _ROLL_ROT | 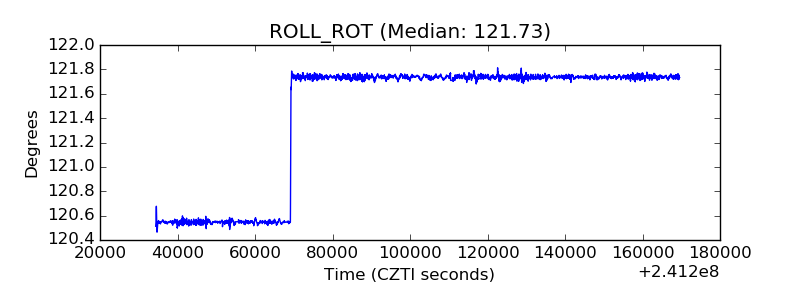 |
| _Roll_DEC | 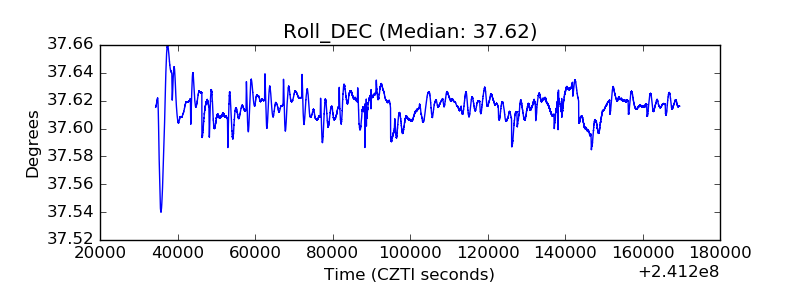 |
| _Roll_RA | 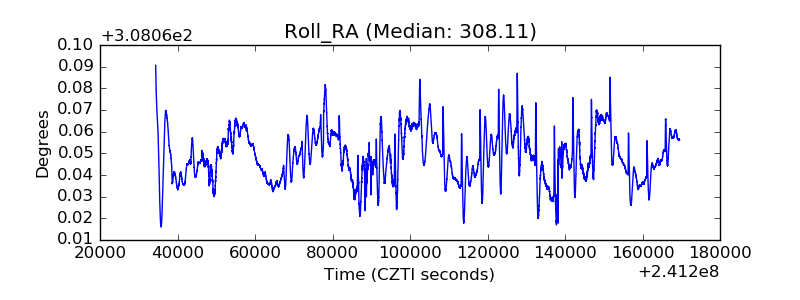 |
| Veto Counter | 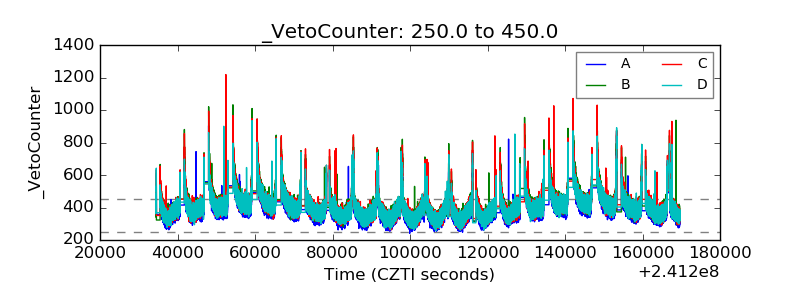 |