| Param | Original file | Final file |
|---|---|---|
| Filename | modeM0/AS1A03_124T01_9000001486_10302cztM0_level2.evt | modeM0/AS1A03_124T01_9000001486_10302cztM0_level2_quad_clean.evt |
| Size (bytes) | 444,686,400 | 84,438,720 |
| Size | 424.1 MB | 80.5 MB |
| Events in quadrant A | 3,077,693 | 536,081 |
| Events in quadrant B | 3,657,825 | 535,542 |
| Events in quadrant C | 2,996,174 | 523,597 |
| Events in quadrant D | 3,287,112 | 501,734 |
| Mode M0 | |||
|---|---|---|---|
| Quadrant | BADHDUFLAG | Total packets | Discarded packets |
| A | 0 | 13561 | 3 |
| B | 0 | 15239 | 2 |
| C | 0 | 13527 | 2 |
| D | 0 | 14242 | 2 |
| Mode M9 | |||
|---|---|---|---|
| Quadrant | BADHDUFLAG | Total packets | Discarded packets |
| A | 0 | 21 | 0 |
| B | 0 | 21 | 0 |
| C | 0 | 21 | 0 |
| D | 0 | 21 | 0 |
| Mode SS | |||
|---|---|---|---|
| Quadrant | BADHDUFLAG | Total packets | Discarded packets |
| A | 0 | 136 | 0 |
| B | 0 | 136 | 0 |
| C | 0 | 136 | 0 |
| D | 0 | 136 | 0 |
| Quadrant | Total seconds | Saturated seconds | Saturation percentage |
|---|---|---|---|
| A | 6596 | 16 | 0.242571% |
| B | 6596 | 123 | 1.864767% |
| C | 6596 | 13 | 0.197089% |
| D | 6596 | 40 | 0.606428% |
Noise dominated data is calculated using 1-second bins in cleaned event files. If a bin has >2000 counts, and if more than 50% of those come from <1% of pixels, then it is considered to be noise-dominated and hence unusable.
| Quadrant | # 1 sec bins | Bins with >0 counts | Bins with >2000 counts | High rate bins dominated by noise | Noise dominated (total time) | Noise dominated (detector-on time) | Marked lightcurve |
|---|---|---|---|---|---|---|---|
| A | 8667 | 6598 | 1 | 1 | 0.01% | 0.02% | 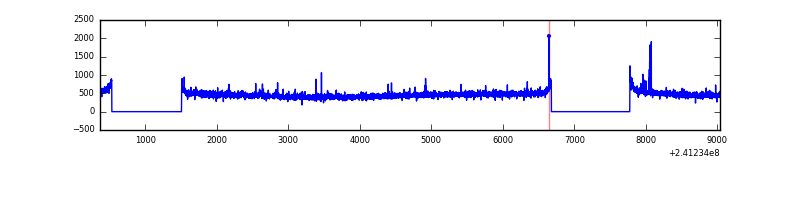 |
| B | 8667 | 6598 | 71 | 71 | 0.82% | 1.08% | 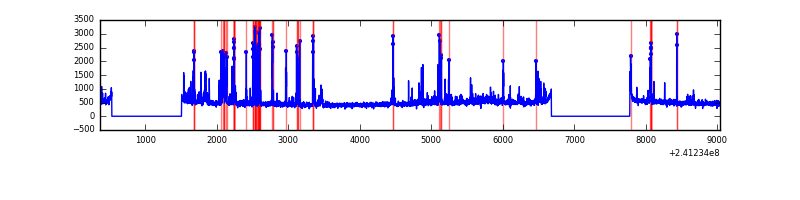 |
| C | 8667 | 6598 | 4 | 4 | 0.05% | 0.06% | 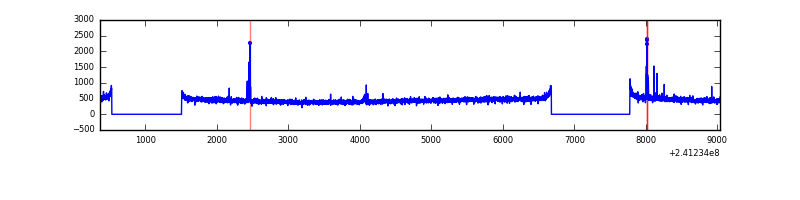 |
| D | 8667 | 6598 | 25 | 25 | 0.29% | 0.38% | 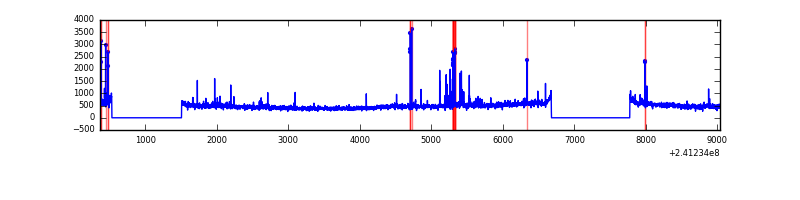 |
Top three noisy pixels from each quadrant. If the there are fewer than three noisy pixels in the level2.evt file, extra rows are filled as -1
| Pixel properties | Quadrant properties | ||||||
|---|---|---|---|---|---|---|---|
| Quadrant | DetID | PixID | Counts | Sigma | Mean | Median | Sigma |
| A | 8 | 15 | 35443 | 218.93 | 779 | 762 | 158.4 |
| A | 13 | 248 | 15859 | 95.3 | 779 | 762 | 158.4 |
| A | 3 | 1 | 12560 | 74.48 | 779 | 762 | 158.4 |
| B | 4 | 239 | 509444 | 3415.06 | 779 | 761 | 149.0 |
| B | 11 | 51 | 46263 | 305.48 | 779 | 761 | 149.0 |
| B | 0 | 214 | 31884 | 208.95 | 779 | 761 | 149.0 |
| C | 4 | 254 | 27574 | 153.0 | 754 | 760 | 175.3 |
| C | 12 | 4 | 19617 | 107.6 | 754 | 760 | 175.3 |
| C | 14 | 234 | 7836 | 40.38 | 754 | 760 | 175.3 |
| D | 8 | 195 | 263836 | 1472.48 | 746 | 724 | 178.7 |
| D | 13 | 104 | 83541 | 463.48 | 746 | 724 | 178.7 |
| D | 2 | 14 | 26542 | 144.49 | 746 | 724 | 178.7 |
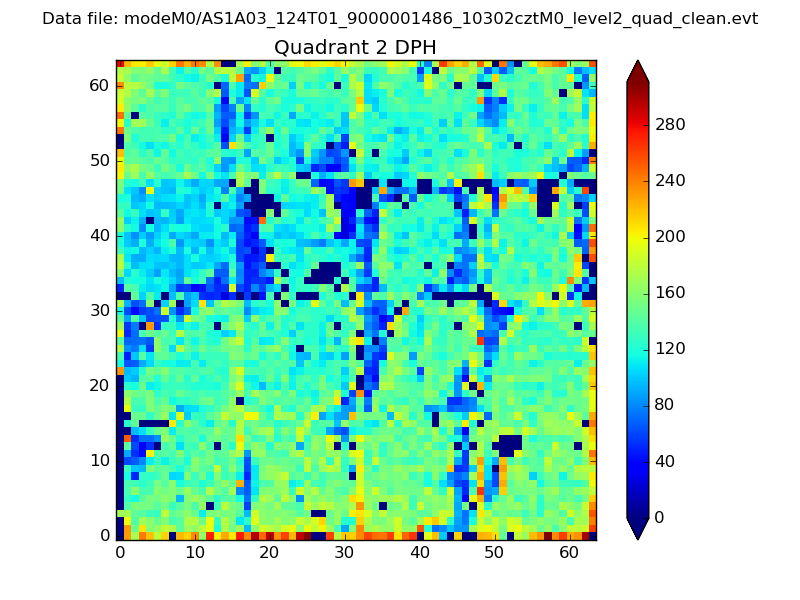
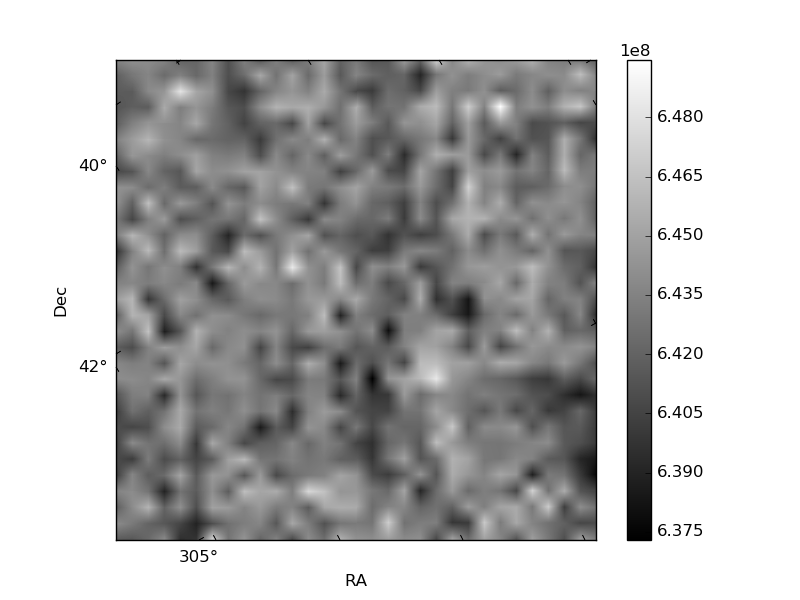
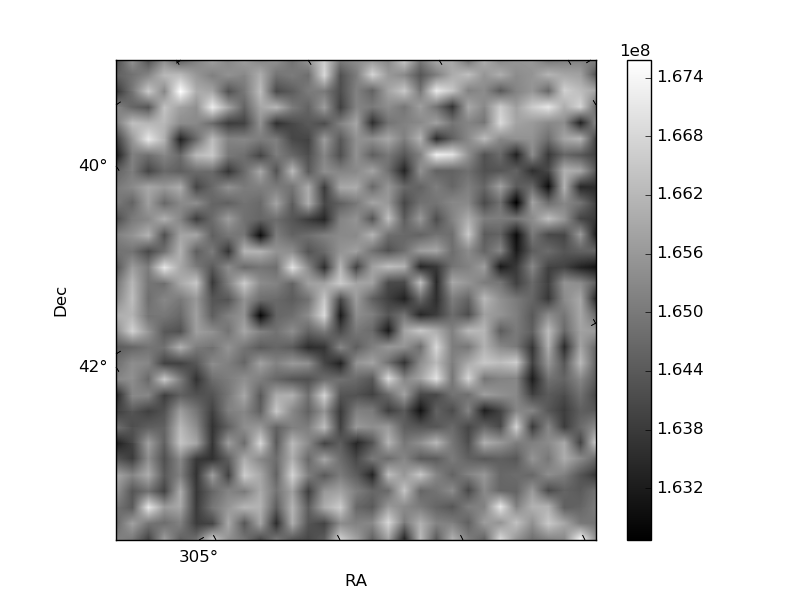
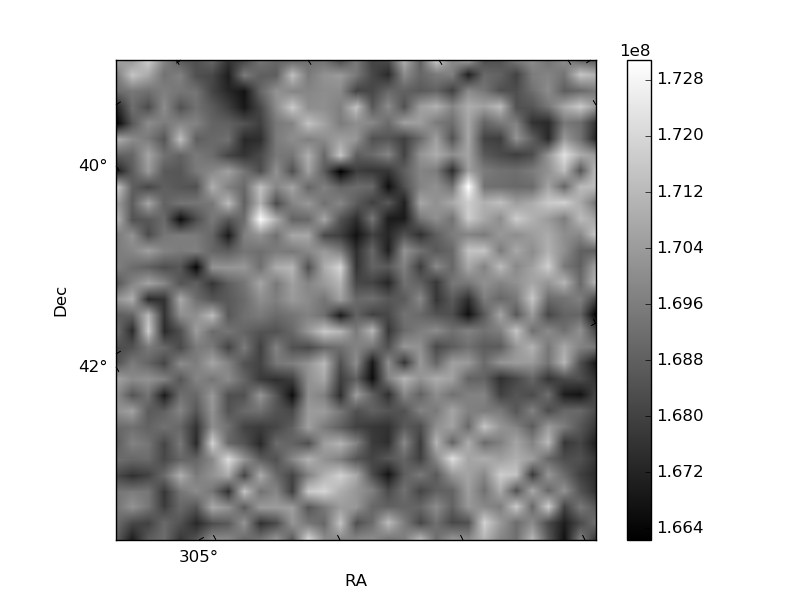
Histogram calculated using DETX and DETY for each event in the final _common_clean file
| Quadrant A | 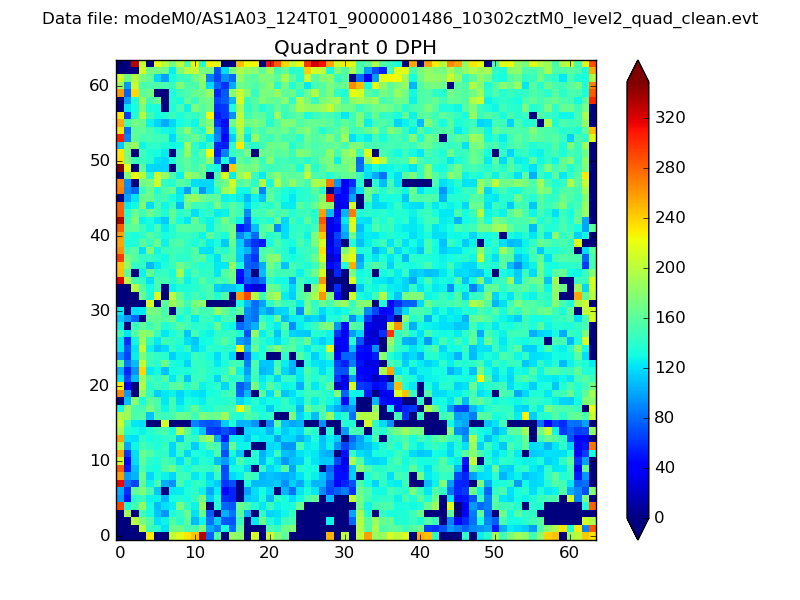 |
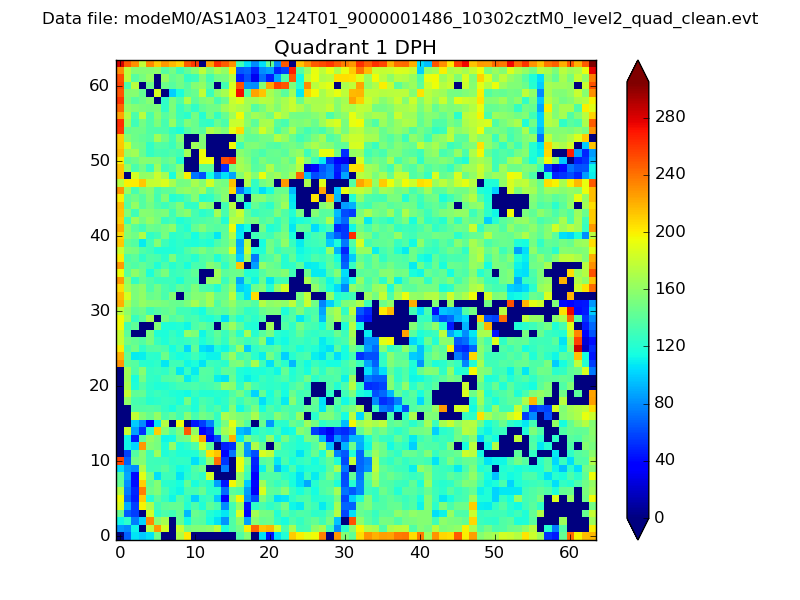 |
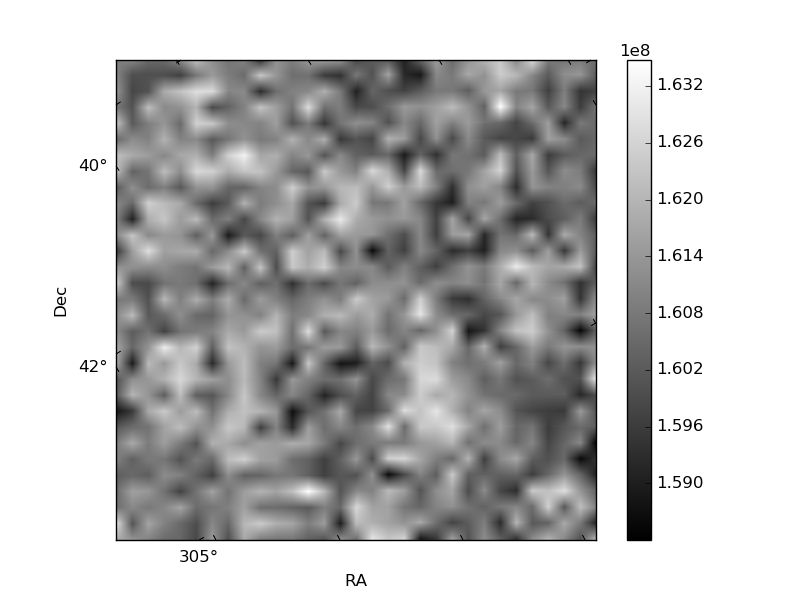
Quadrant B |
|---|---|---|---|
| Quadrant D | 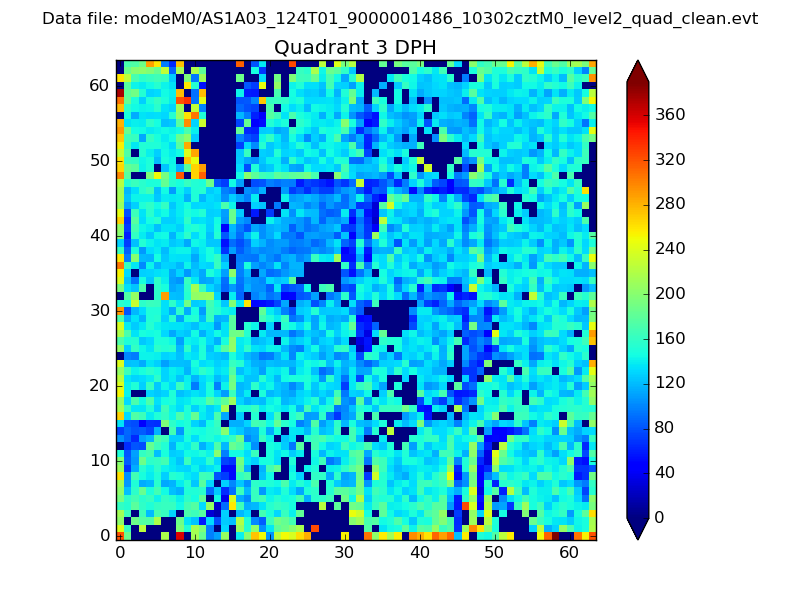 |
 |
Quadrant C |
| Plot type | Count rate plots | Images |
|---|---|---|
| Comparison with Poisson distribution Blue bars denote a histogram of data divided into 1 sec bins. Red curve is a Poisson curve with rate = median count rate of data. |
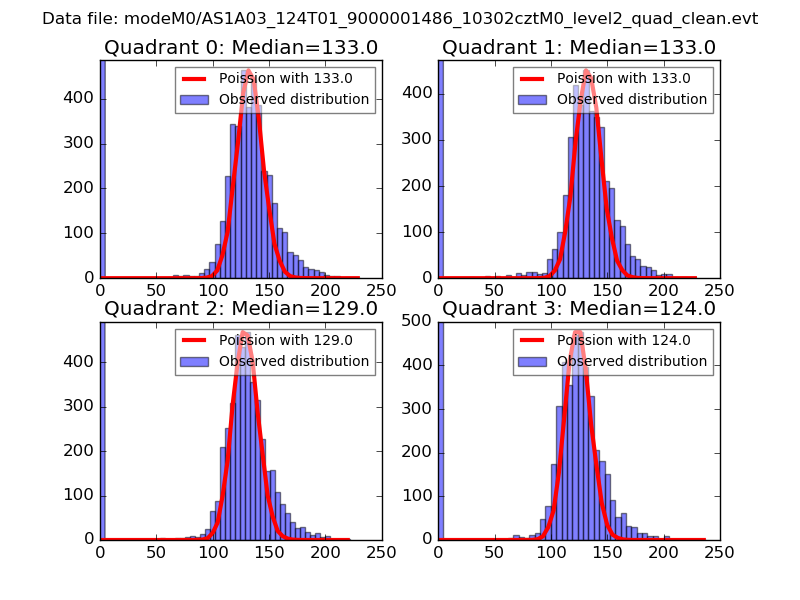 |
 |
| Quadrant-wise count rates Data is divided into 100 sec bins |
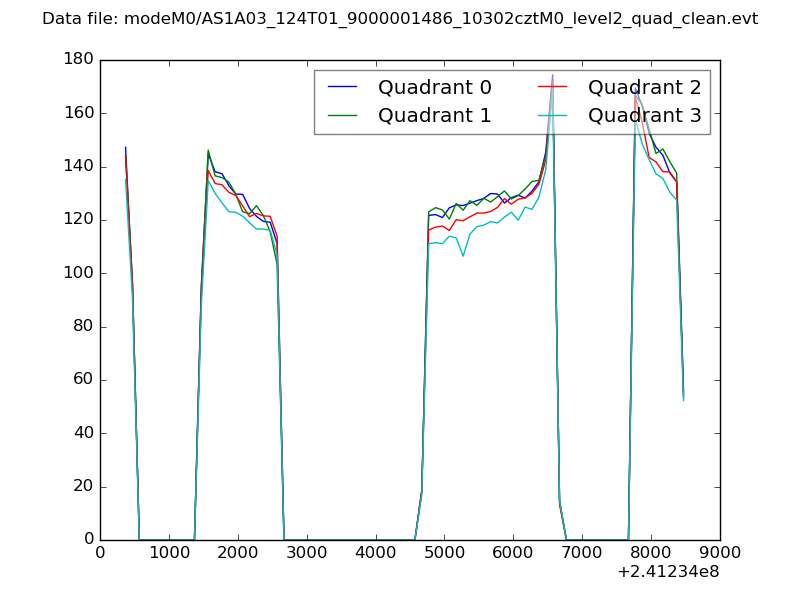 |
|
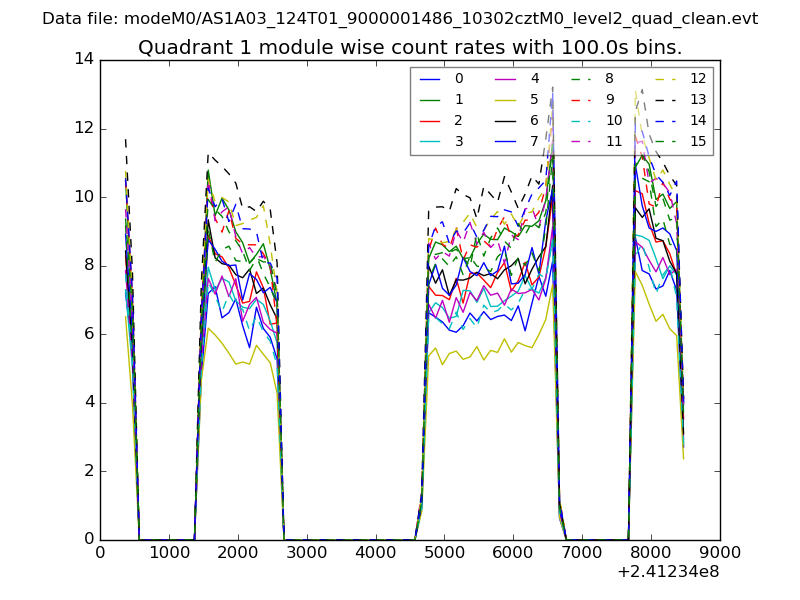
| Module-wise count rates for Quadrant A Data is divided into 100 sec bins |
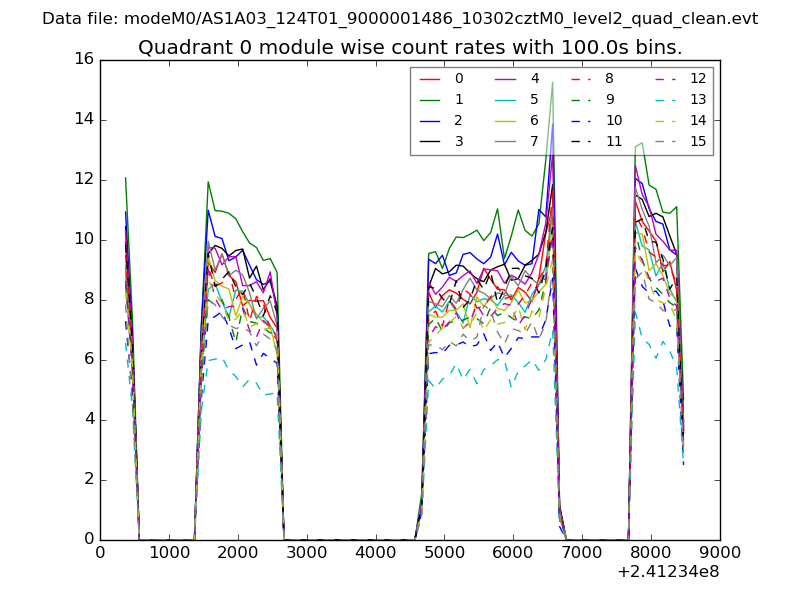 |
 |
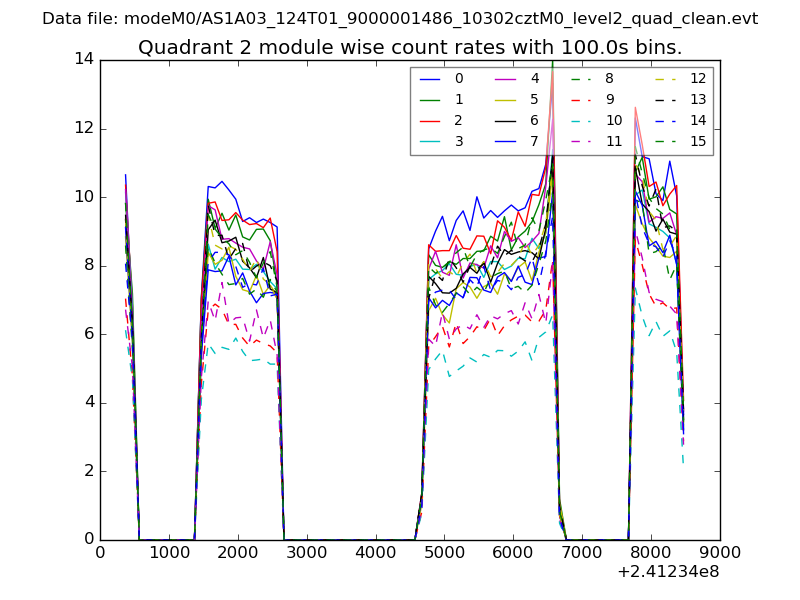
| Module-wise count rates for Quadrant B Data is divided into 100 sec bins |
 |
 |
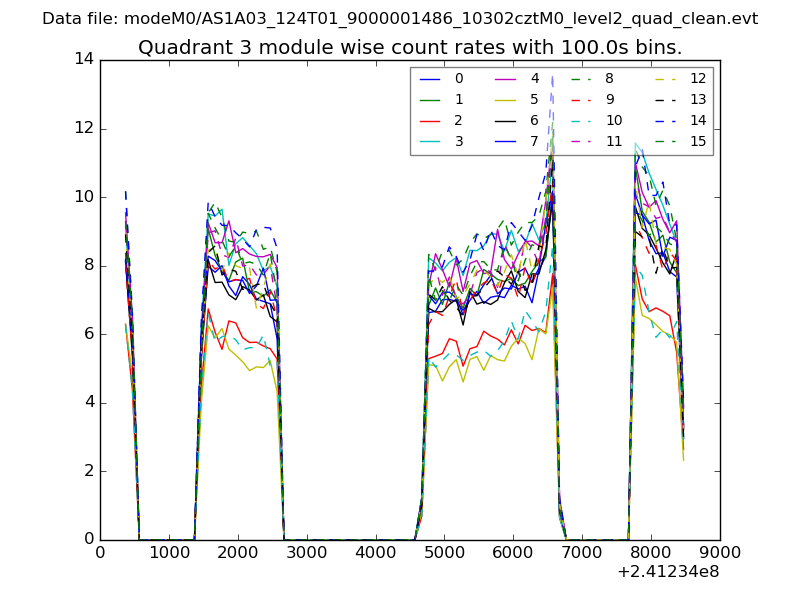
| Module-wise count rates for Quadrant C Data is divided into 100 sec bins |
 |
 |
| Module-wise count rates for Quadrant D Data is divided into 100 sec bins |
 |
 |
| Parameter | Plot |
|---|---|
| CZT HV Monitor | 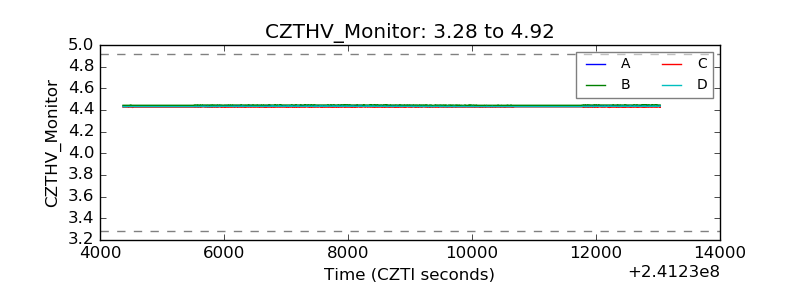 |
| D_VDD |  |
| Temperature 1 | 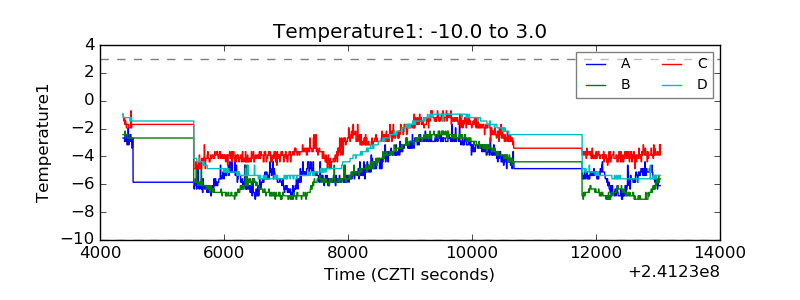 |
| Veto HV Monitor | 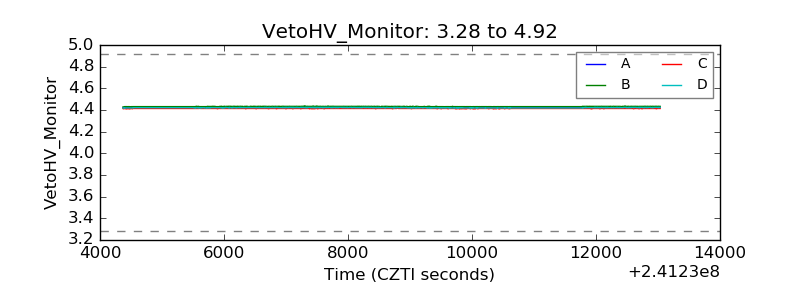 |
| Veto LLD | 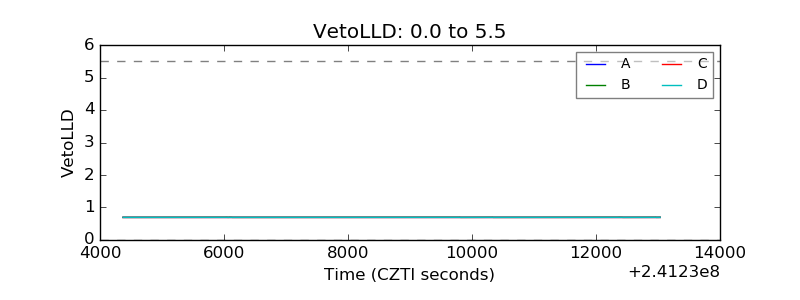 |
| Alpha Counter | 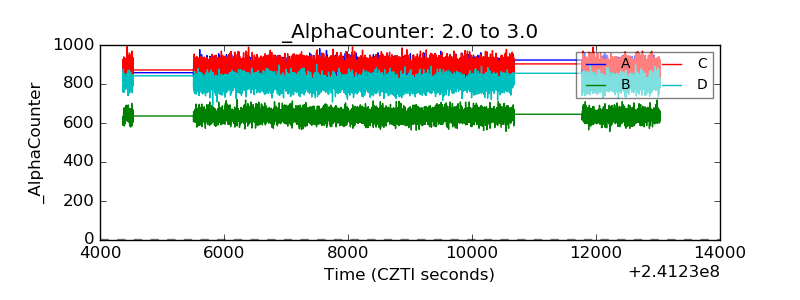 |
| _CPM_Rate | 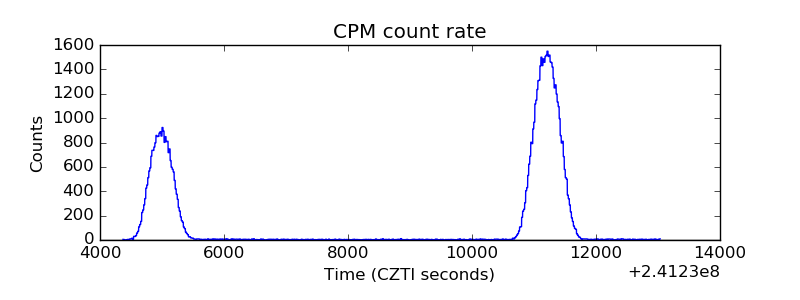 |
| CZT Counter | 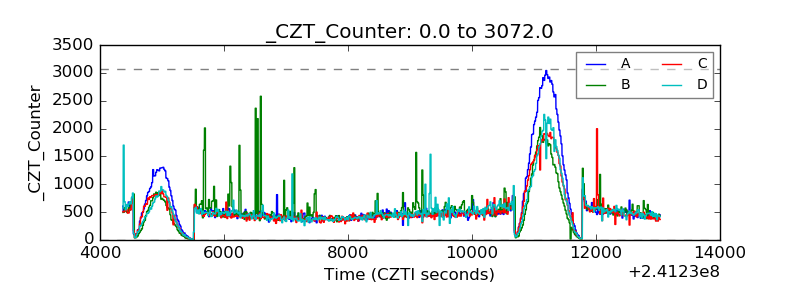 |
| +2.5 Volts monitor | 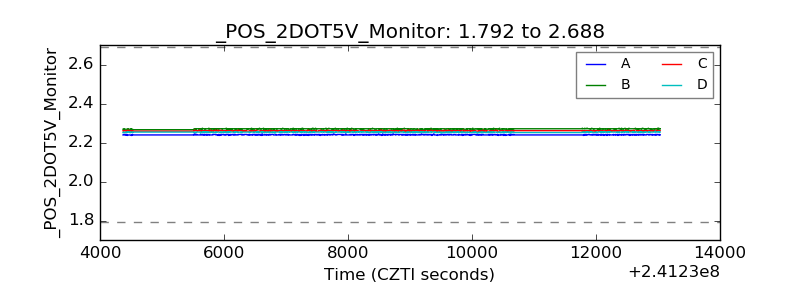 |
| +5 Volts monitor |  |
| _ROLL_ROT | 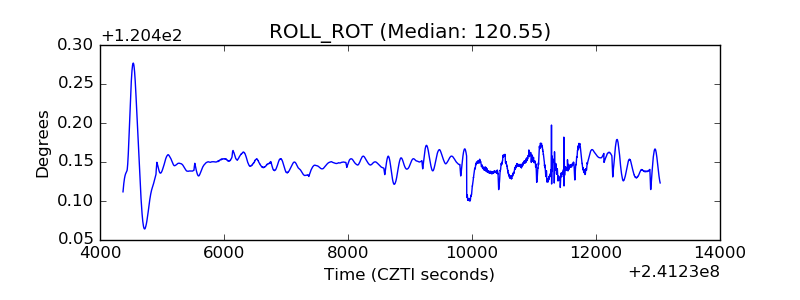 |
| _Roll_DEC | 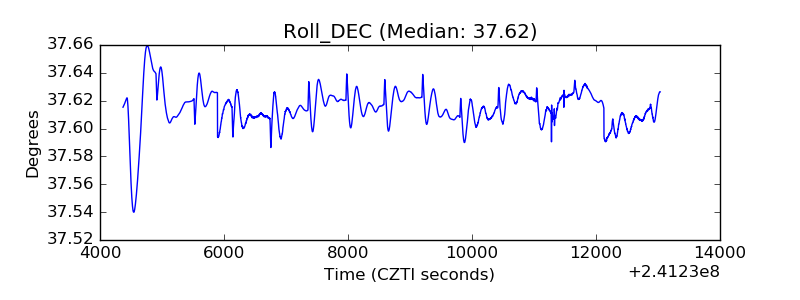 |
| _Roll_RA | 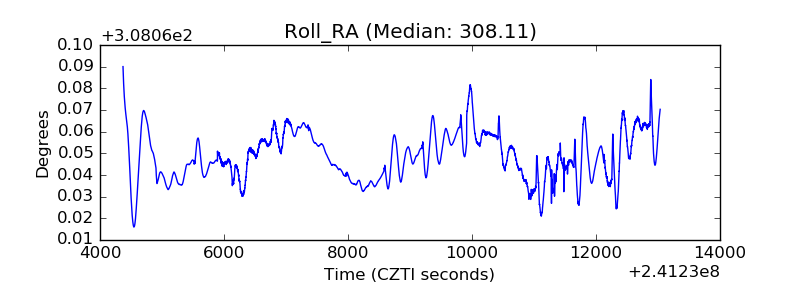 |
| Veto Counter | 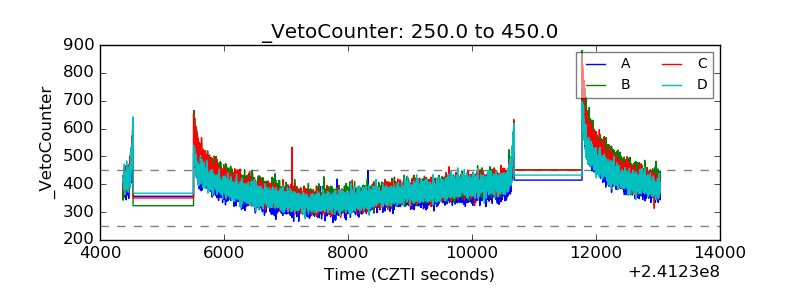 |