| Param | Original file | Final file |
|---|---|---|
| Filename | modeM0/AS1A03_124T01_9000001486_10306cztM0_level2.evt | modeM0/AS1A03_124T01_9000001486_10306cztM0_level2_quad_clean.evt |
| Size (bytes) | 405,233,280 | 62,323,200 |
| Size | 386.5 MB | 59.4 MB |
| Events in quadrant A | 2,923,629 | 386,256 |
| Events in quadrant B | 3,076,350 | 388,571 |
| Events in quadrant C | 2,670,619 | 372,192 |
| Events in quadrant D | 3,225,766 | 352,813 |
| Mode M0 | |||
|---|---|---|---|
| Quadrant | BADHDUFLAG | Total packets | Discarded packets |
| A | 0 | 13183 | 1406 |
| B | 0 | 13740 | 1379 |
| C | 0 | 12610 | 1334 |
| D | 0 | 14698 | 1532 |
| Mode M9 | |||
|---|---|---|---|
| Quadrant | BADHDUFLAG | Total packets | Discarded packets |
| A | 0 | 17 | 2 |
| B | 0 | 17 | 2 |
| C | 0 | 17 | 2 |
| D | 0 | 18 | 3 |
| Mode SS | |||
|---|---|---|---|
| Quadrant | BADHDUFLAG | Total packets | Discarded packets |
| A | 0 | 126 | 12 |
| B | 0 | 126 | 12 |
| C | 0 | 125 | 13 |
| D | 0 | 126 | 10 |
| Quadrant | Total seconds | Saturated seconds | Saturation percentage |
|---|---|---|---|
| A | 5522 | 13 | 0.235422% |
| B | 5514 | 56 | 1.015597% |
| C | 5532 | 8 | 0.144613% |
| D | 5516 | 11 | 0.199420% |
Noise dominated data is calculated using 1-second bins in cleaned event files. If a bin has >2000 counts, and if more than 50% of those come from <1% of pixels, then it is considered to be noise-dominated and hence unusable.
| Quadrant | # 1 sec bins | Bins with >0 counts | Bins with >2000 counts | High rate bins dominated by noise | Noise dominated (total time) | Noise dominated (detector-on time) | Marked lightcurve |
|---|---|---|---|---|---|---|---|
| A | 7846 | 5615 | 0 | 0 | 0.00% | 0.00% |  |
| B | 7846 | 5618 | 24 | 24 | 0.31% | 0.43% | 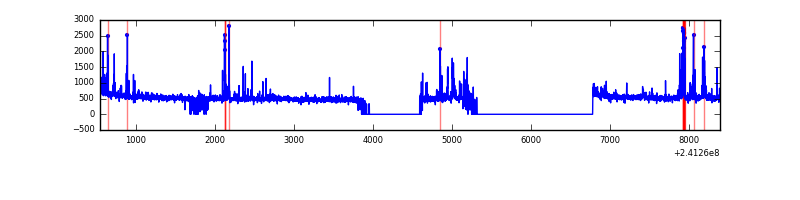 |
| C | 7846 | 5633 | 0 | 0 | 0.00% | 0.00% | 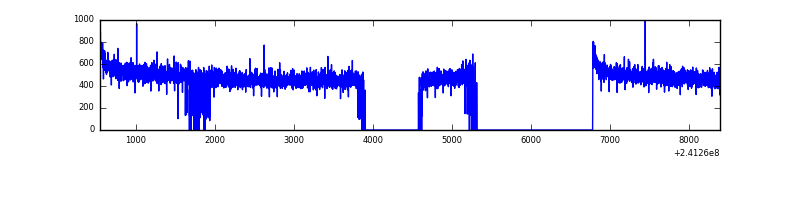 |
| D | 7846 | 5604 | 4 | 4 | 0.05% | 0.07% |  |
Top three noisy pixels from each quadrant. If the there are fewer than three noisy pixels in the level2.evt file, extra rows are filled as -1
| Pixel properties | Quadrant properties | ||||||
|---|---|---|---|---|---|---|---|
| Quadrant | DetID | PixID | Counts | Sigma | Mean | Median | Sigma |
| A | 8 | 15 | 120893 | 838.51 | 721 | 709 | 143.3 |
| A | 3 | 1 | 15235 | 101.35 | 721 | 709 | 143.3 |
| A | 13 | 251 | 11363 | 74.33 | 721 | 709 | 143.3 |
| B | 4 | 239 | 259869 | 1949.13 | 711 | 697 | 133.0 |
| B | 0 | 214 | 17826 | 128.82 | 711 | 697 | 133.0 |
| B | 11 | 51 | 14551 | 104.19 | 711 | 697 | 133.0 |
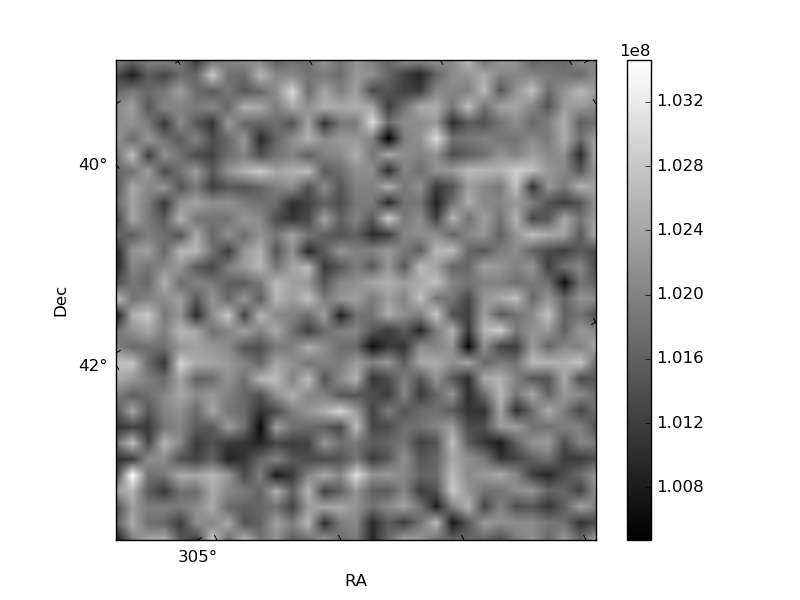
| C | 13 | 61 | 5198 | 28.79 | 683 | 690 | 156.6 |
| C | 14 | 238 | 4149 | 22.09 | 683 | 690 | 156.6 |
| C | 14 | 234 | 2304 | 10.31 | 683 | 690 | 156.6 |
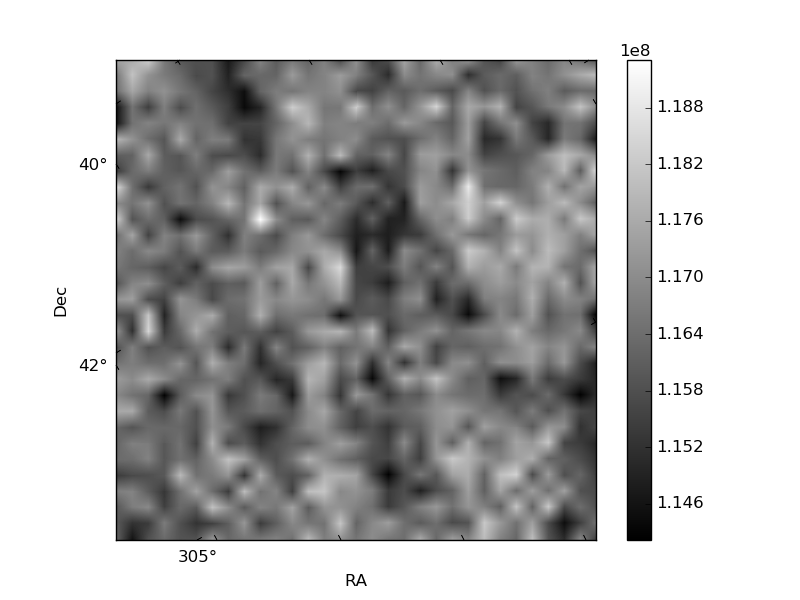
| D | 8 | 195 | 383963 | 2360.12 | 681 | 663 | 162.4 |
| D | 1 | 20 | 168601 | 1034.06 | 681 | 663 | 162.4 |
| D | 2 | 234 | 21727 | 129.7 | 681 | 663 | 162.4 |
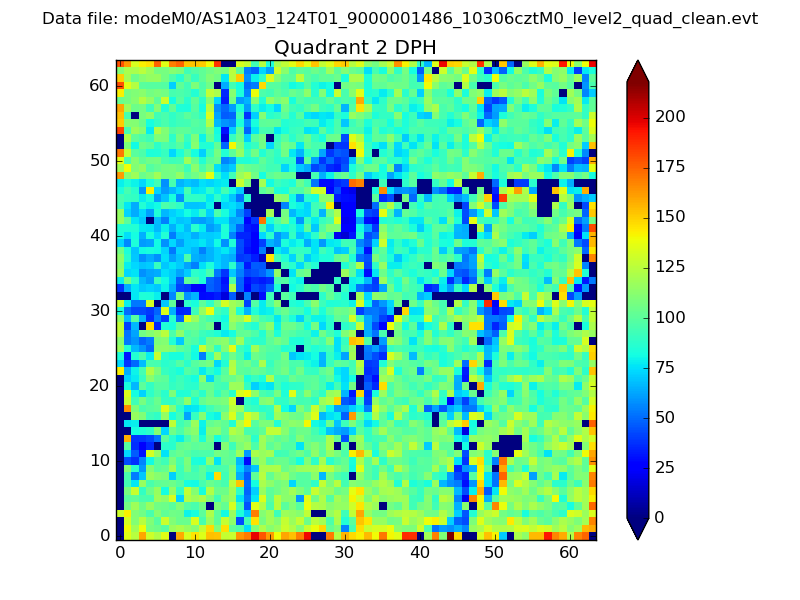
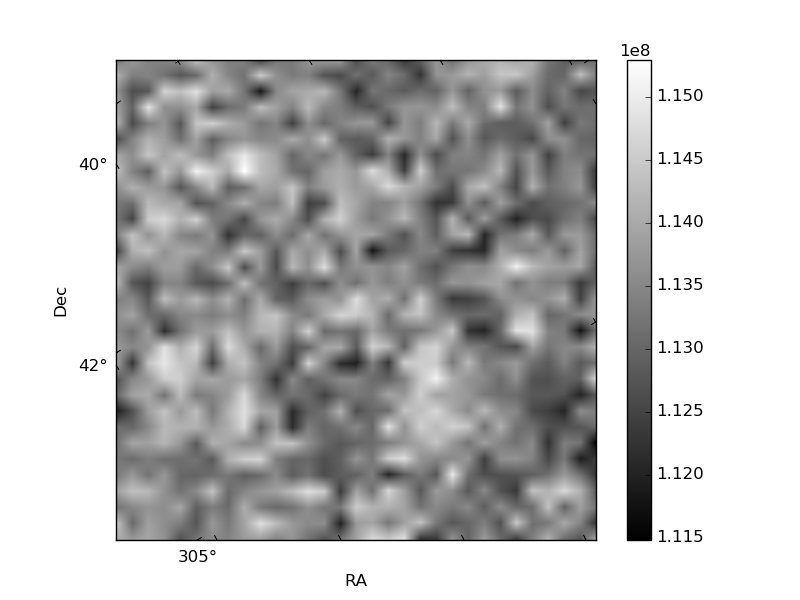
Histogram calculated using DETX and DETY for each event in the final _common_clean file
| Quadrant A | 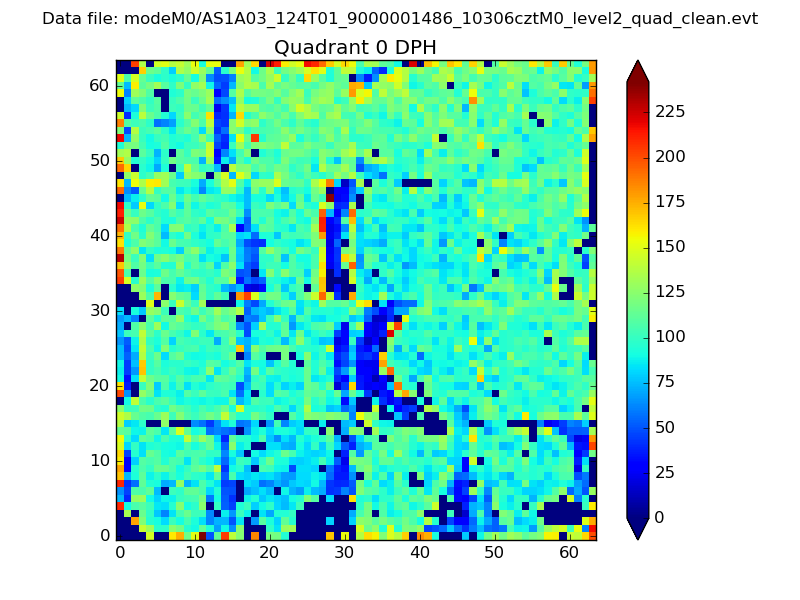 |
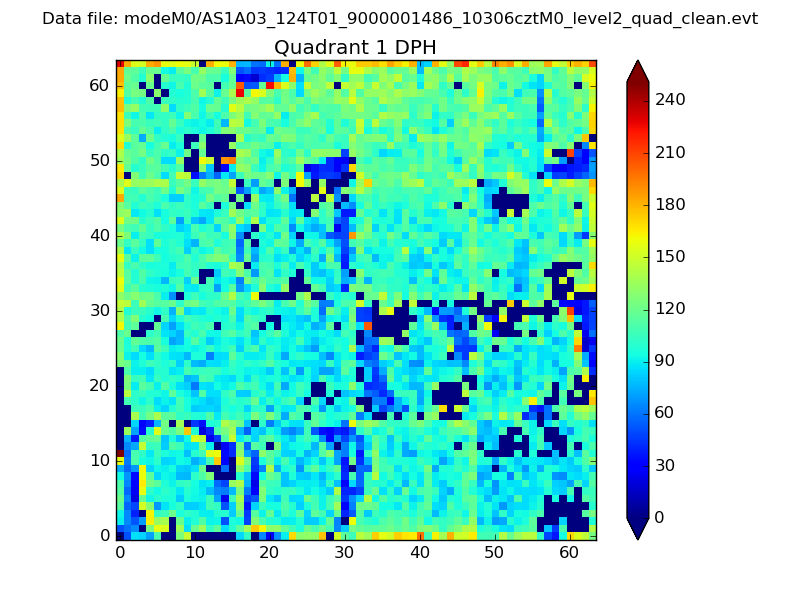 |
Quadrant B |
|---|---|---|---|
| Quadrant D | 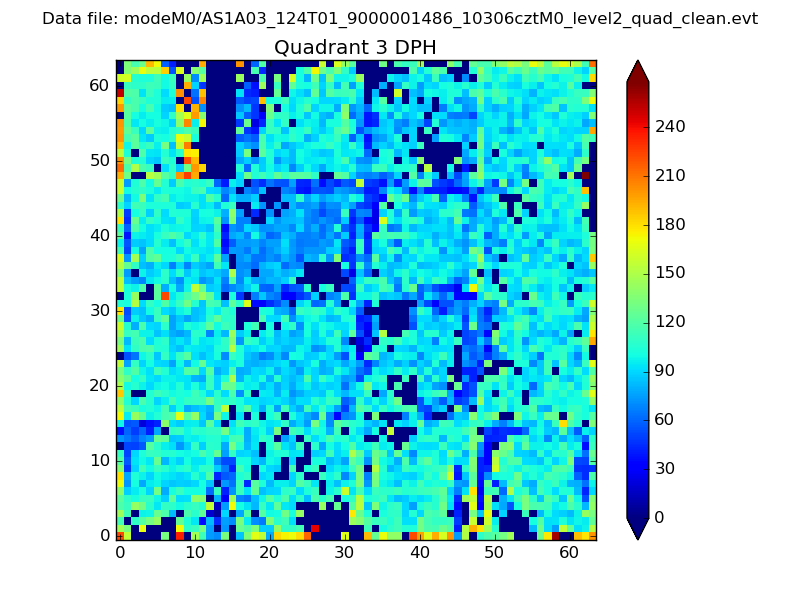 |
 |
Quadrant C |
| Plot type | Count rate plots | Images |
|---|---|---|
| Comparison with Poisson distribution Blue bars denote a histogram of data divided into 1 sec bins. Red curve is a Poisson curve with rate = median count rate of data. |
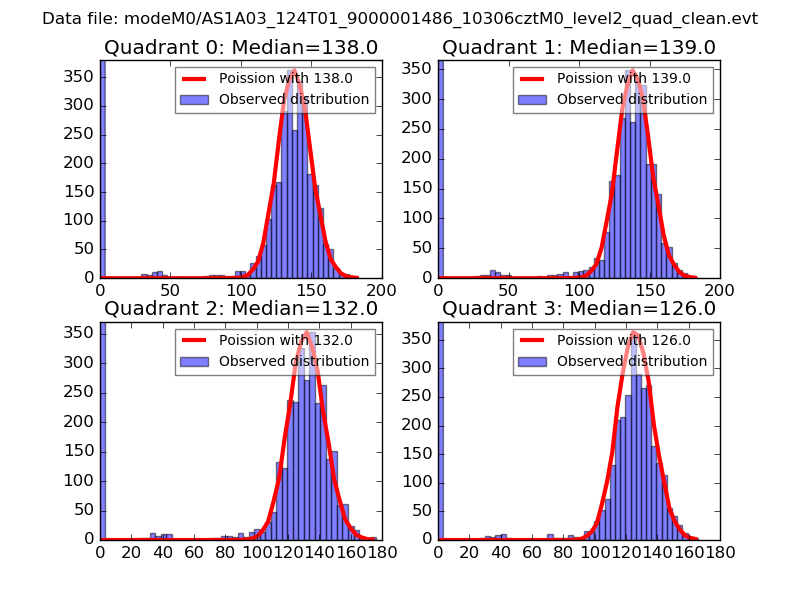 |
 |
| Quadrant-wise count rates Data is divided into 100 sec bins |
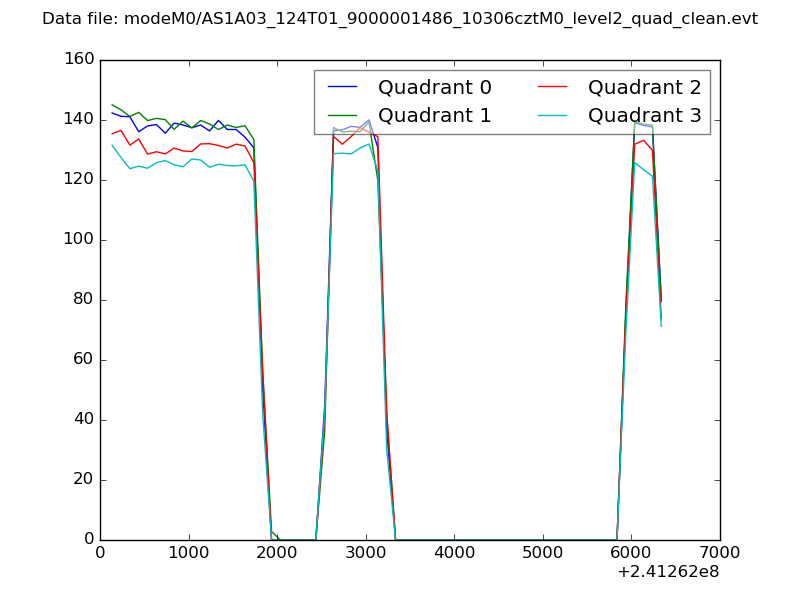 |
|
| Module-wise count rates for Quadrant A Data is divided into 100 sec bins |
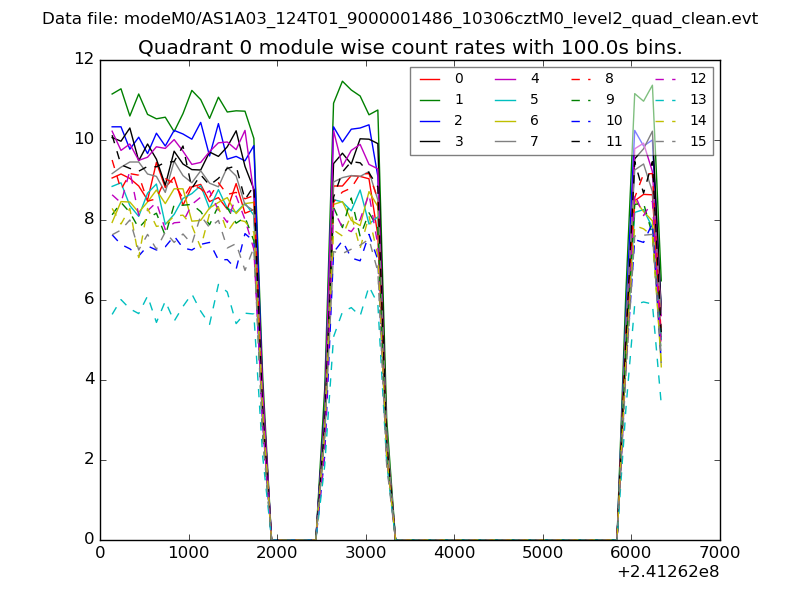 |
 |
| Module-wise count rates for Quadrant B Data is divided into 100 sec bins |
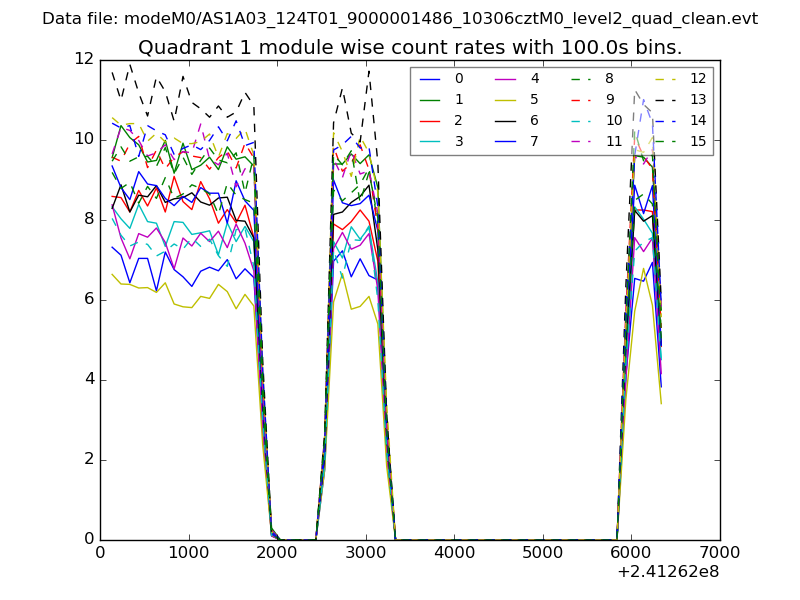 |
 |
| Module-wise count rates for Quadrant C Data is divided into 100 sec bins |
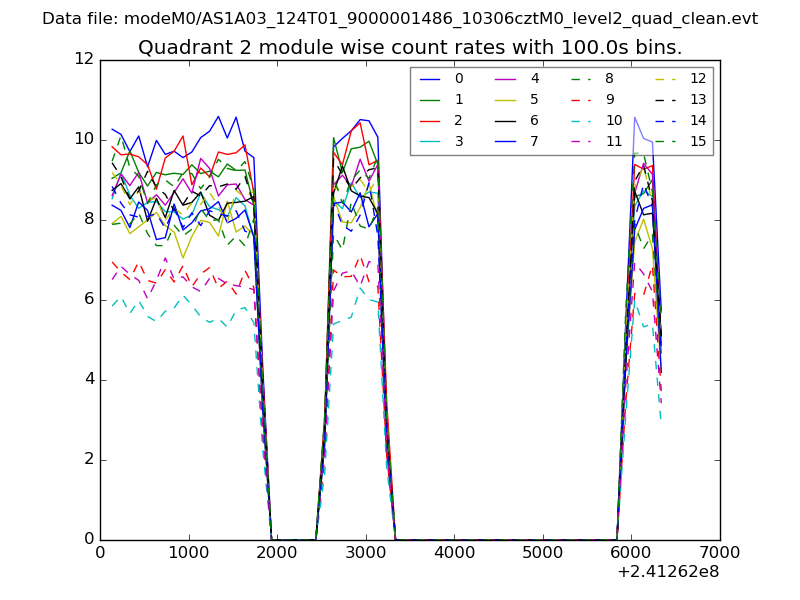 |
 |
| Module-wise count rates for Quadrant D Data is divided into 100 sec bins |
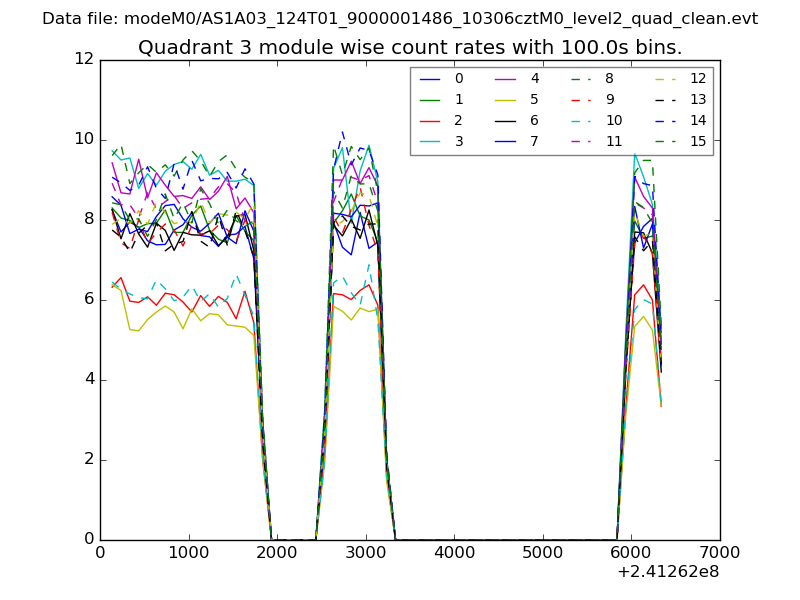 |
 |
| Parameter | Plot |
|---|---|
| CZT HV Monitor | 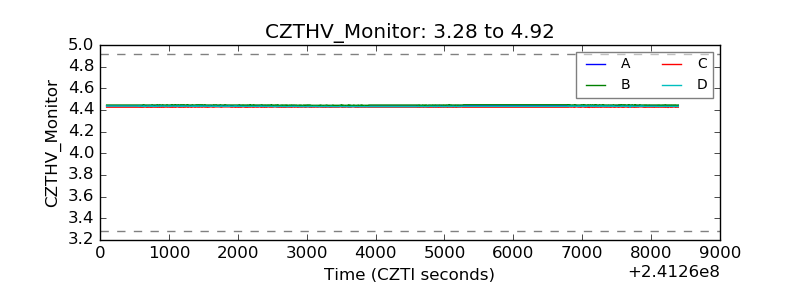 |
| D_VDD |  |
| Temperature 1 | 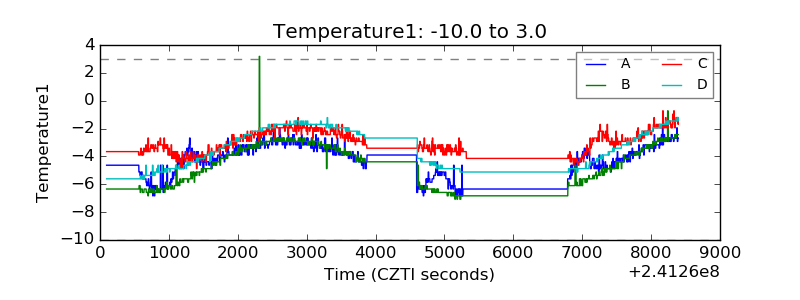 |
| Veto HV Monitor |  |
| Veto LLD | 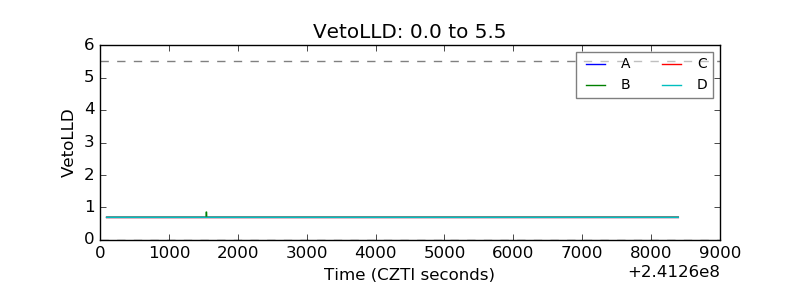 |
| Alpha Counter | 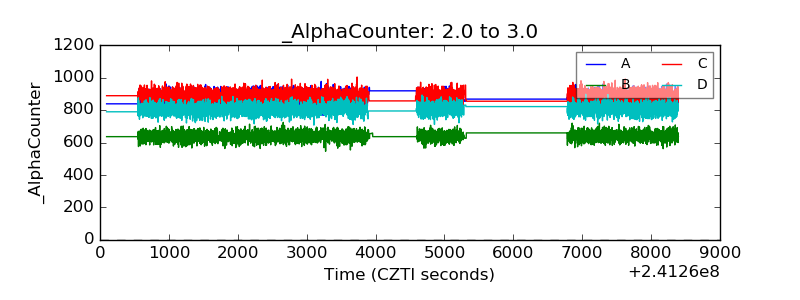 |
| _CPM_Rate | 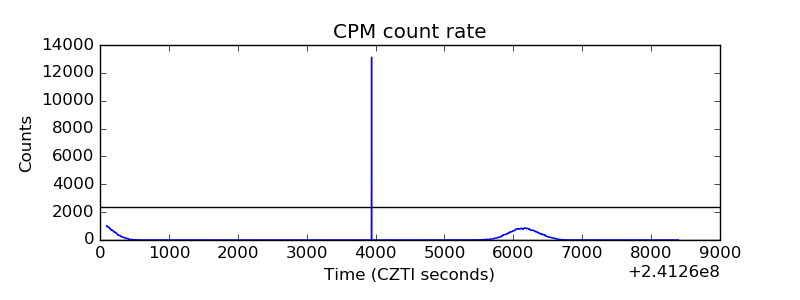 |
| CZT Counter | 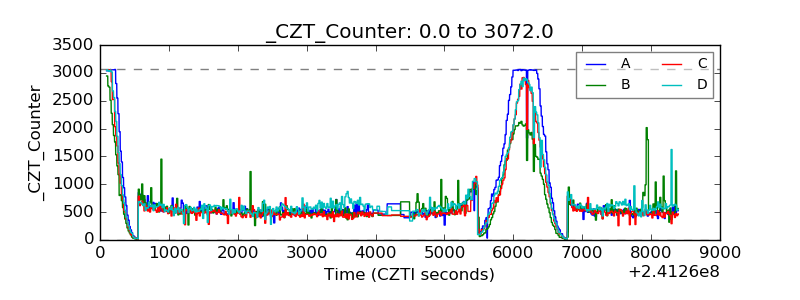 |
| +2.5 Volts monitor |  |
| +5 Volts monitor |  |
| _ROLL_ROT | 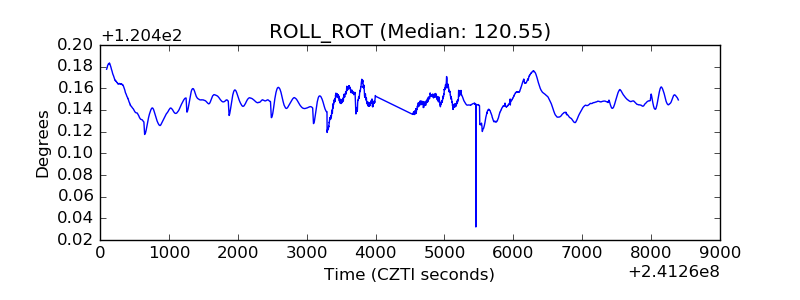 |
| _Roll_DEC | 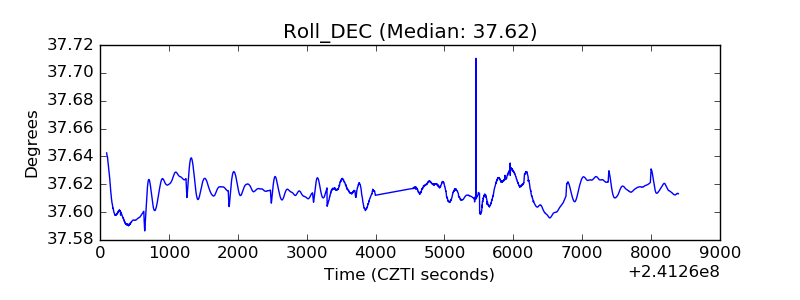 |
| _Roll_RA |  |
| Veto Counter | 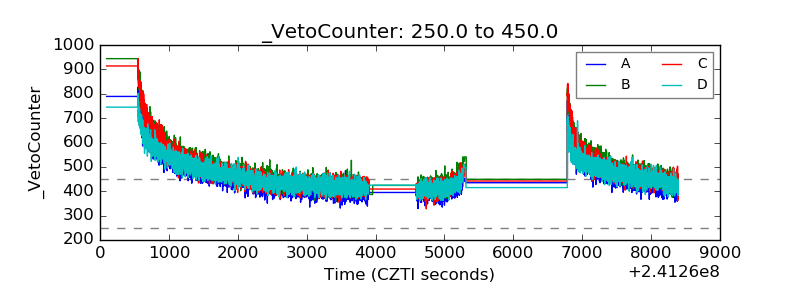 |