| Param | Original file | Final file |
|---|---|---|
| Filename | modeM0/AS1A03_124T01_9000001486_10307cztM0_level2.evt | modeM0/AS1A03_124T01_9000001486_10307cztM0_level2_quad_clean.evt |
| Size (bytes) | 419,878,080 | 89,323,200 |
| Size | 400.4 MB | 85.2 MB |
| Events in quadrant A | 2,950,642 | 593,680 |
| Events in quadrant B | 3,288,943 | 591,871 |
| Events in quadrant C | 2,607,440 | 578,047 |
| Events in quadrant D | 3,491,468 | 552,821 |
| Mode M0 | |||
|---|---|---|---|
| Quadrant | BADHDUFLAG | Total packets | Discarded packets |
| A | 0 | 12227 | 219 |
| B | 0 | 13472 | 221 |
| C | 0 | 11644 | 230 |
| D | 0 | 14335 | 247 |
| Mode M9 | |||
|---|---|---|---|
| Quadrant | BADHDUFLAG | Total packets | Discarded packets |
| A | 0 | 12 | 0 |
| B | 0 | 12 | 0 |
| C | 0 | 12 | 0 |
| D | 0 | 12 | 0 |
| Mode SS | |||
|---|---|---|---|
| Quadrant | BADHDUFLAG | Total packets | Discarded packets |
| A | 0 | 114 | 2 |
| B | 0 | 114 | 2 |
| C | 0 | 114 | 2 |
| D | 0 | 114 | 2 |
| Quadrant | Total seconds | Saturated seconds | Saturation percentage |
|---|---|---|---|
| A | 5561 | 80 | 1.438590% |
| B | 5563 | 216 | 3.882797% |
| C | 5557 | 44 | 0.791794% |
| D | 5556 | 92 | 1.655868% |
Noise dominated data is calculated using 1-second bins in cleaned event files. If a bin has >2000 counts, and if more than 50% of those come from <1% of pixels, then it is considered to be noise-dominated and hence unusable.
| Quadrant | # 1 sec bins | Bins with >0 counts | Bins with >2000 counts | High rate bins dominated by noise | Noise dominated (total time) | Noise dominated (detector-on time) | Marked lightcurve |
|---|---|---|---|---|---|---|---|
| A | 6739 | 5577 | 2 | 2 | 0.03% | 0.04% | 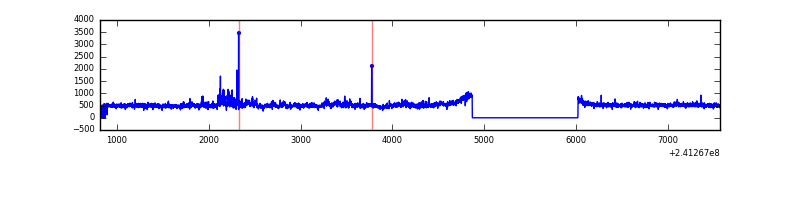 |
| B | 6729 | 5571 | 112 | 112 | 1.66% | 2.01% | 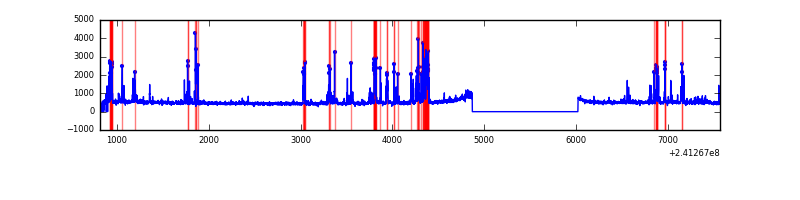 |
| C | 6748 | 5568 | 0 | 0 | 0.00% | 0.00% | 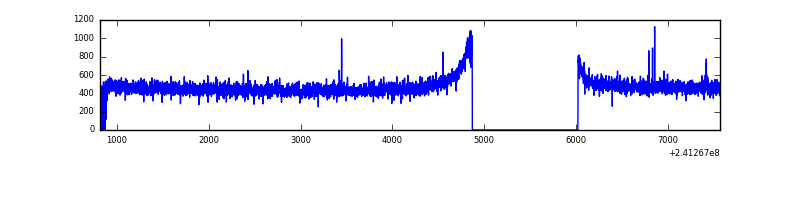 |
| D | 6736 | 5573 | 33 | 33 | 0.49% | 0.59% | 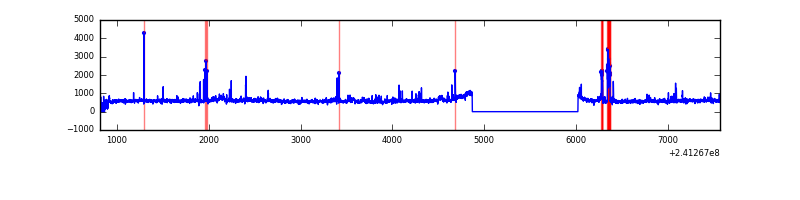 |
Top three noisy pixels from each quadrant. If the there are fewer than three noisy pixels in the level2.evt file, extra rows are filled as -1
| Pixel properties | Quadrant properties | ||||||
|---|---|---|---|---|---|---|---|
| Quadrant | DetID | PixID | Counts | Sigma | Mean | Median | Sigma |
| A | 8 | 15 | 196631 | 1402.85 | 691 | 677 | 139.7 |
| A | 8 | 5 | 81264 | 576.93 | 691 | 677 | 139.7 |
| A | 0 | 226 | 6422 | 41.13 | 691 | 677 | 139.7 |
| B | 4 | 239 | 547002 | 4202.53 | 679 | 661 | 130.0 |
| B | 0 | 214 | 39085 | 295.56 | 679 | 661 | 130.0 |
| B | 11 | 51 | 18460 | 136.91 | 679 | 661 | 130.0 |
| C | 14 | 238 | 6042 | 34.87 | 664 | 667 | 154.1 |
| C | 14 | 234 | 5497 | 31.34 | 664 | 667 | 154.1 |
| C | 13 | 61 | 4871 | 27.28 | 664 | 667 | 154.1 |
| D | 8 | 195 | 556689 | 3537.92 | 663 | 647 | 157.2 |
| D | 1 | 20 | 126862 | 803.07 | 663 | 647 | 157.2 |
| D | 10 | 199 | 94124 | 594.77 | 663 | 647 | 157.2 |
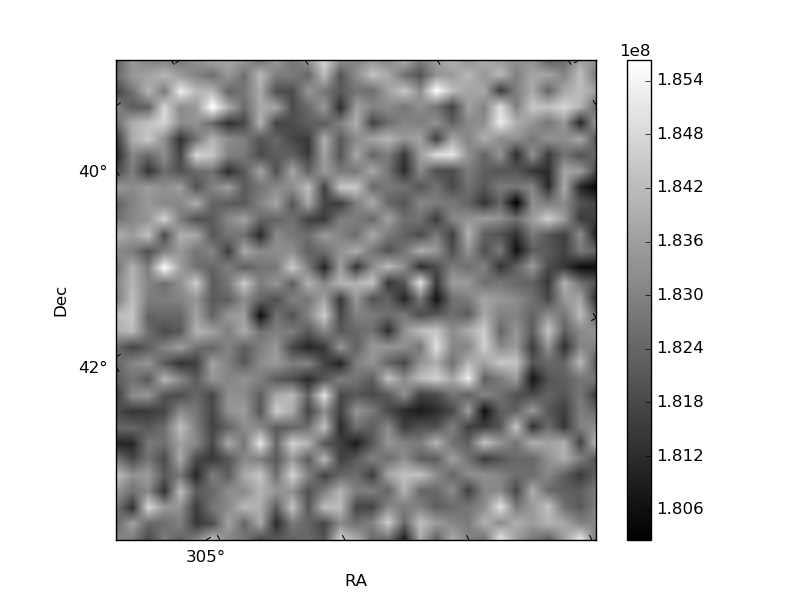
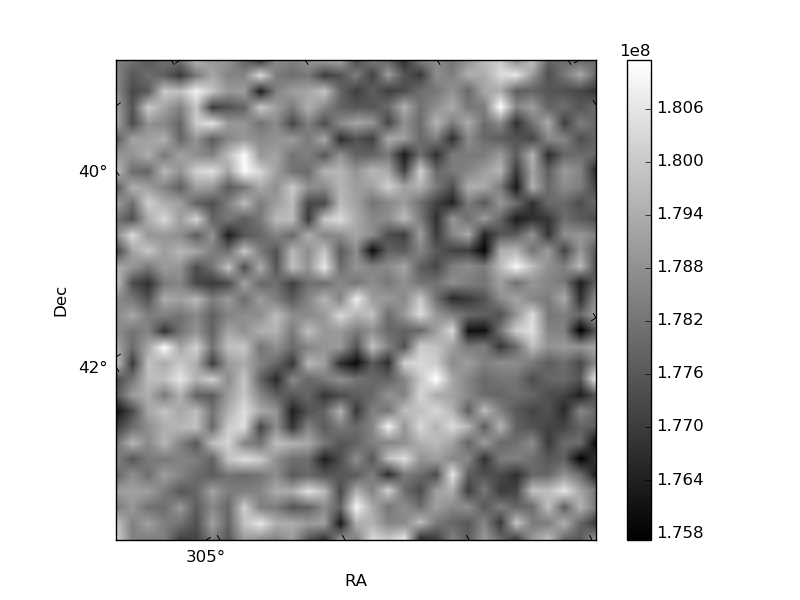
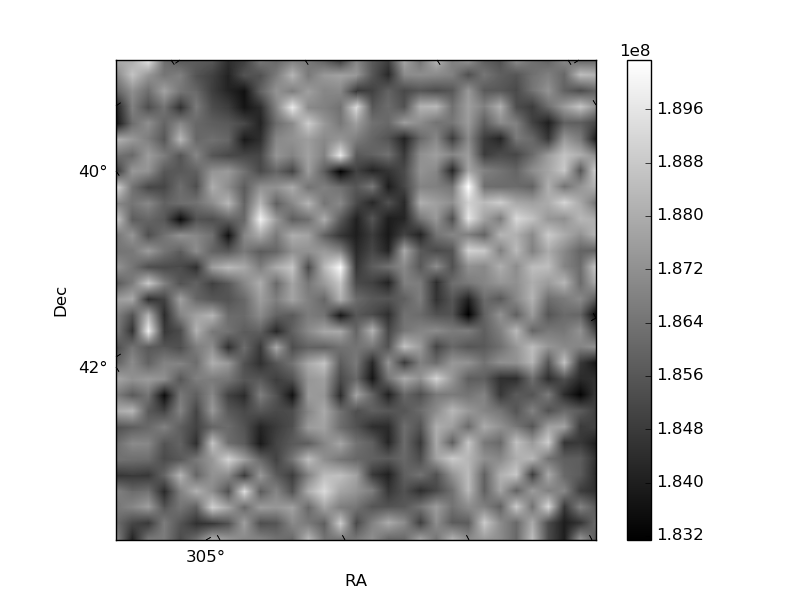
Histogram calculated using DETX and DETY for each event in the final _common_clean file
| Quadrant A | 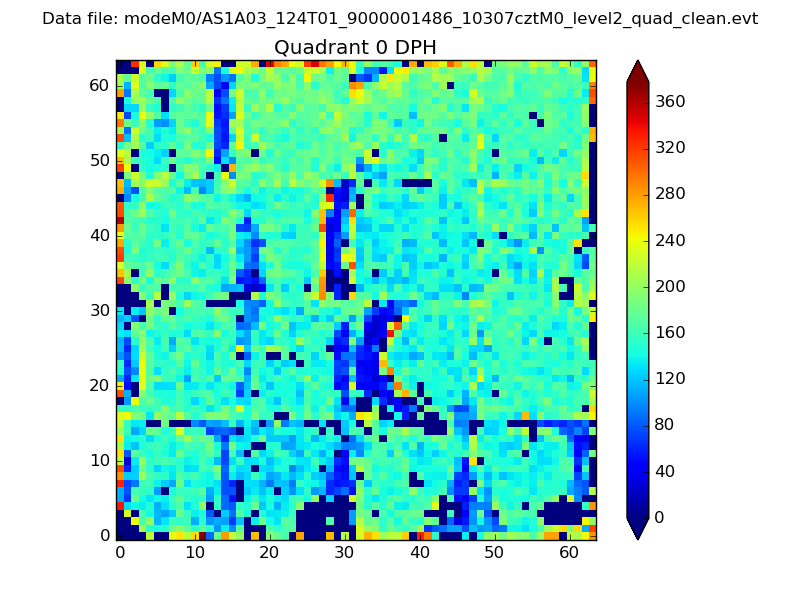 |
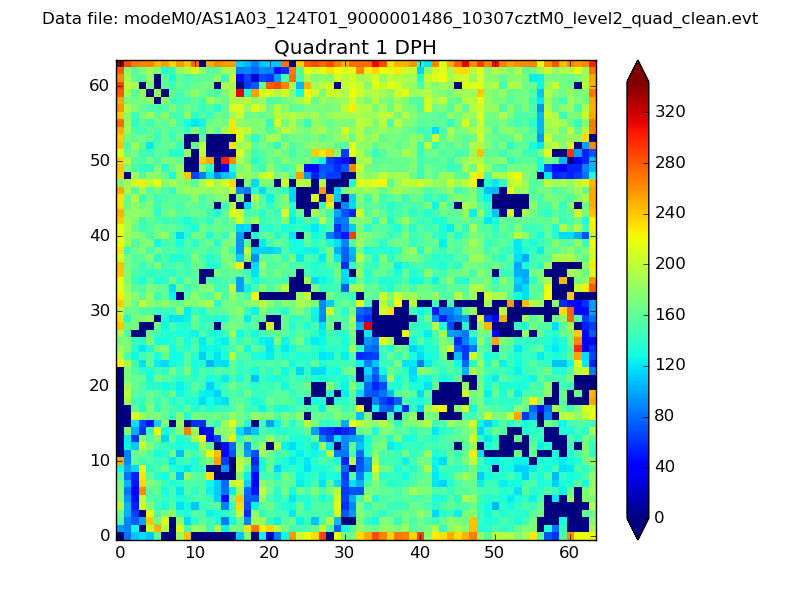 |
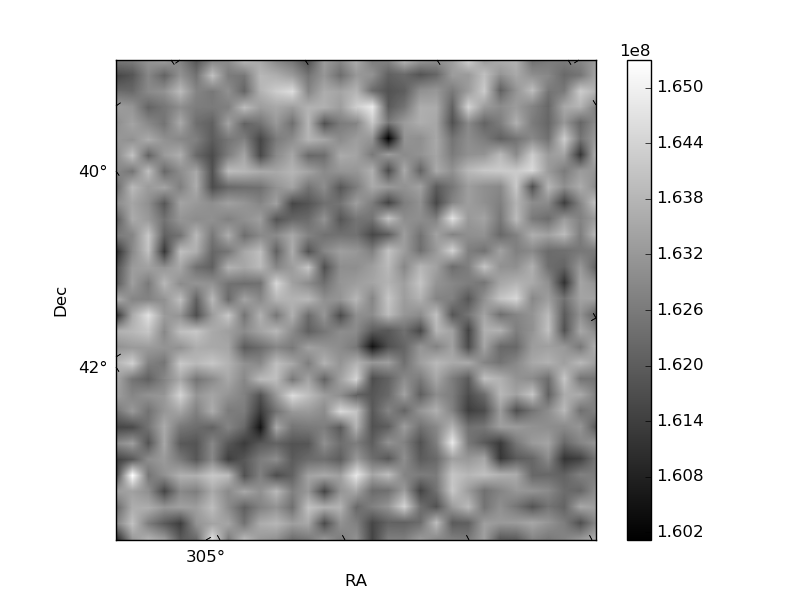
Quadrant B |
|---|---|---|---|
| Quadrant D | 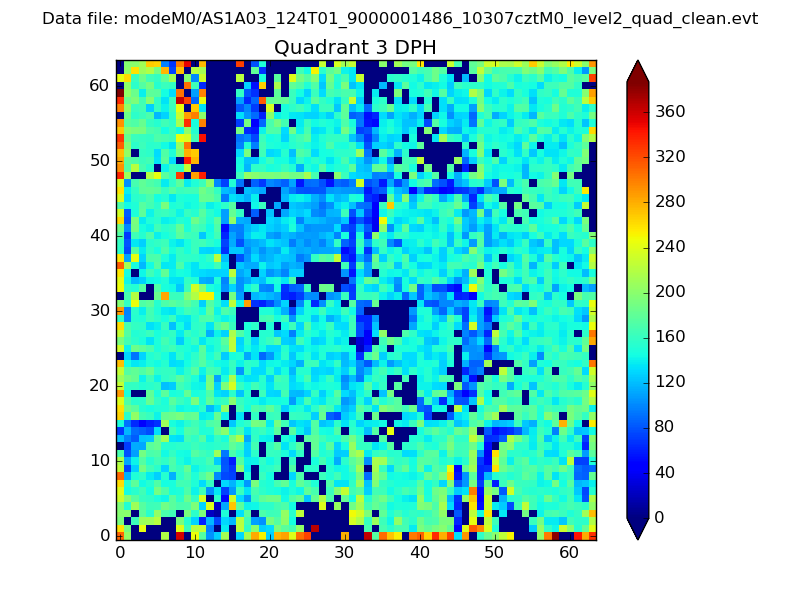 |
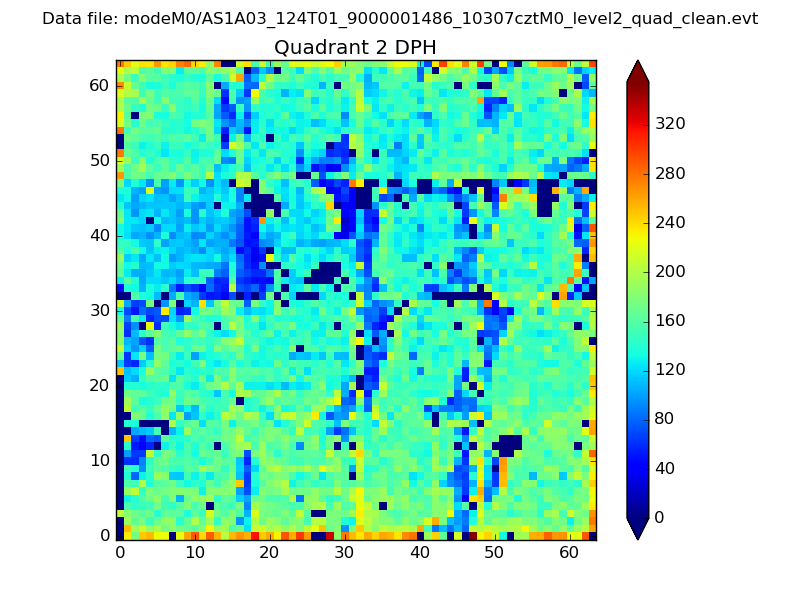 |
Quadrant C |
| Plot type | Count rate plots | Images |
|---|---|---|
| Comparison with Poisson distribution Blue bars denote a histogram of data divided into 1 sec bins. Red curve is a Poisson curve with rate = median count rate of data. |
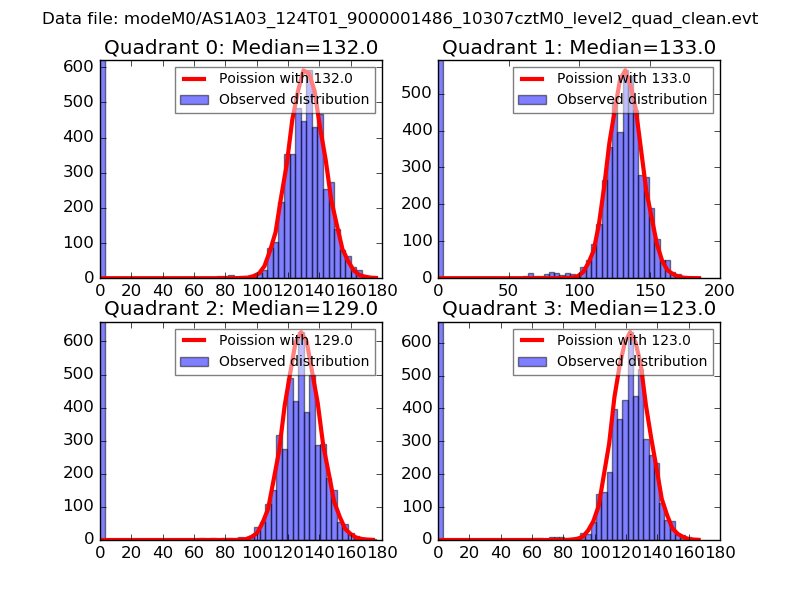 |
 |
| Quadrant-wise count rates Data is divided into 100 sec bins |
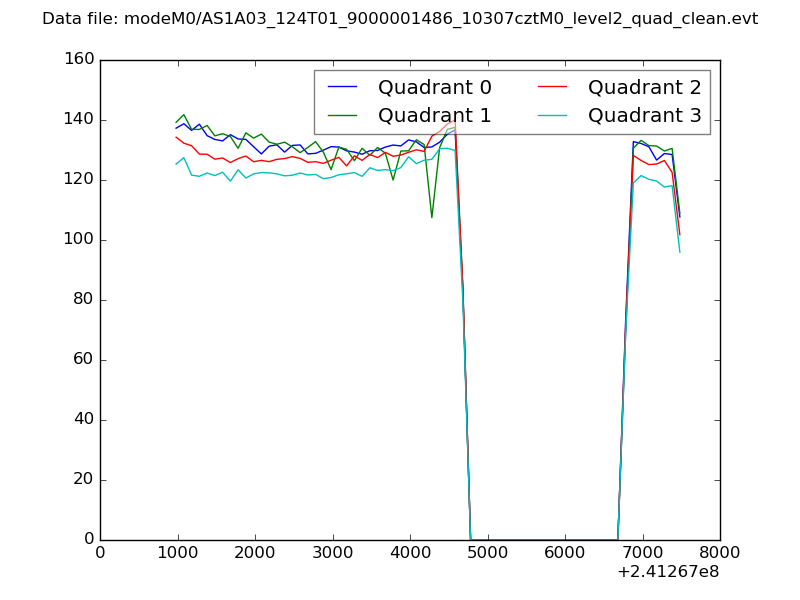 |
|
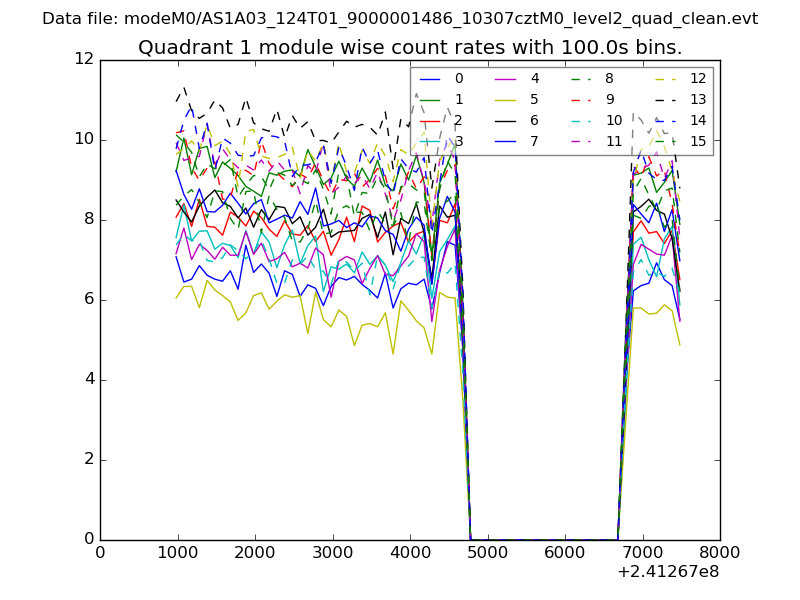
| Module-wise count rates for Quadrant A Data is divided into 100 sec bins |
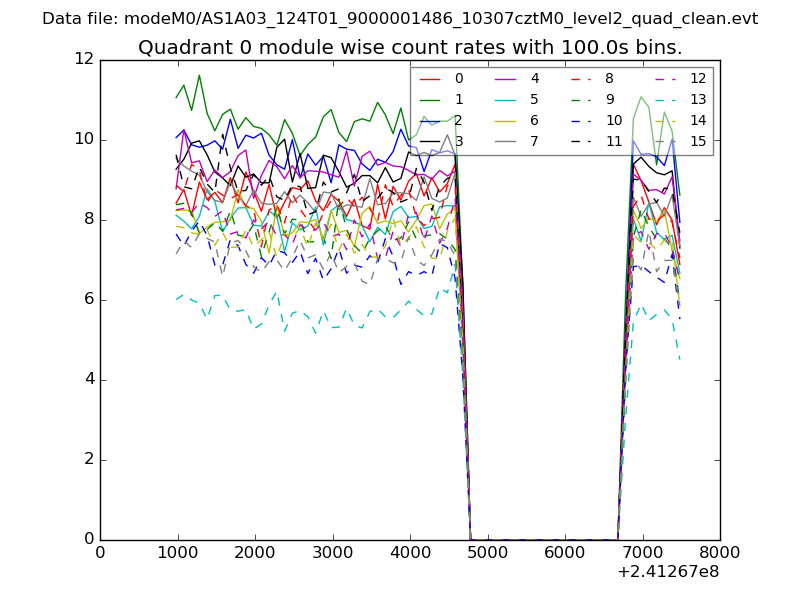 |
 |
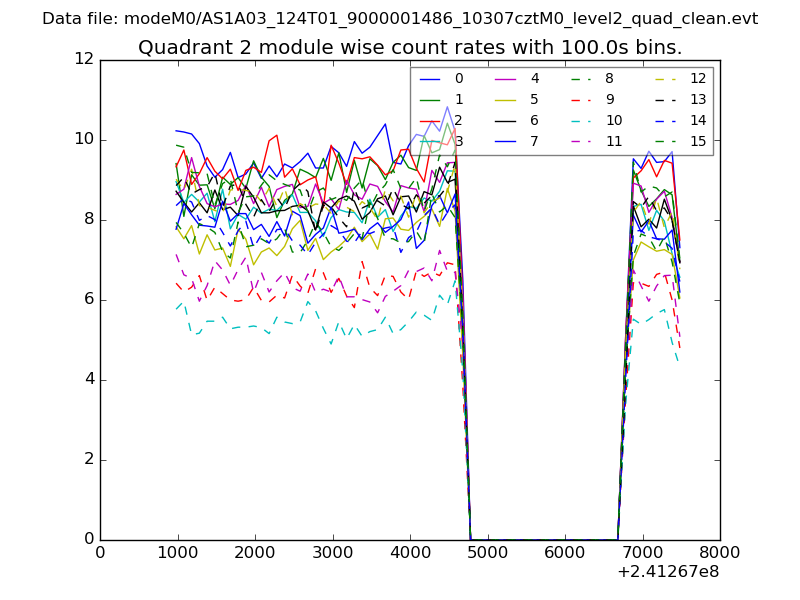
| Module-wise count rates for Quadrant B Data is divided into 100 sec bins |
 |
 |
| Module-wise count rates for Quadrant C Data is divided into 100 sec bins |
 |
 |
| Module-wise count rates for Quadrant D Data is divided into 100 sec bins |
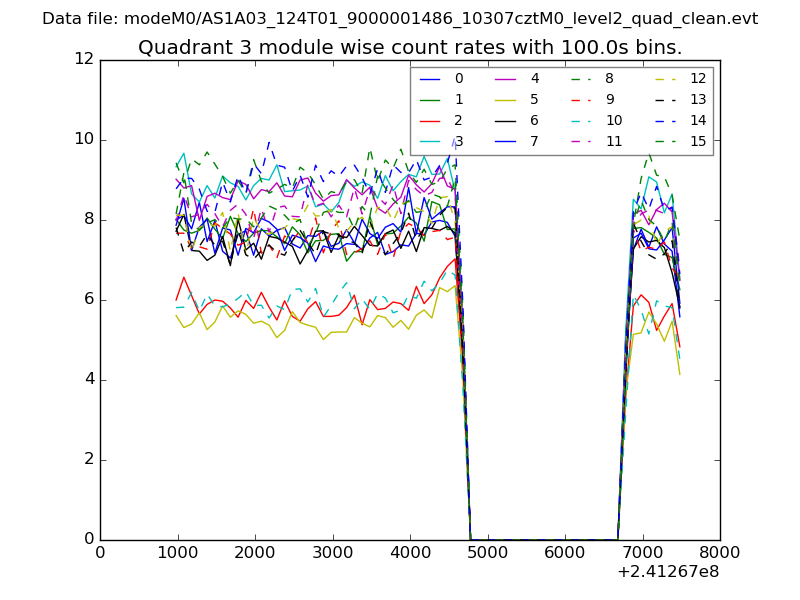 |
 |
| Parameter | Plot |
|---|---|
| CZT HV Monitor | 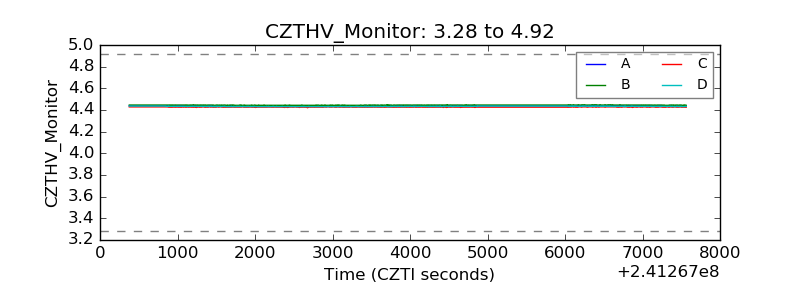 |
| D_VDD | 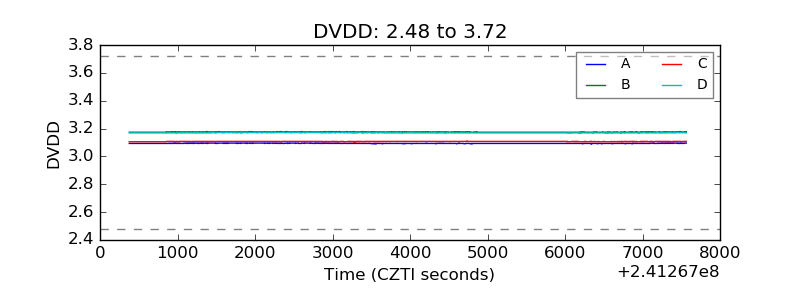 |
| Temperature 1 | 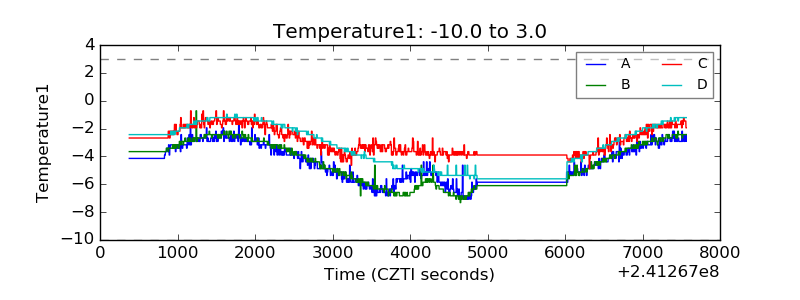 |
| Veto HV Monitor | 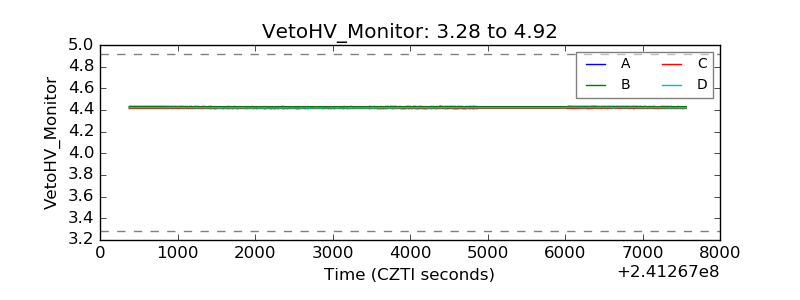 |
| Veto LLD | 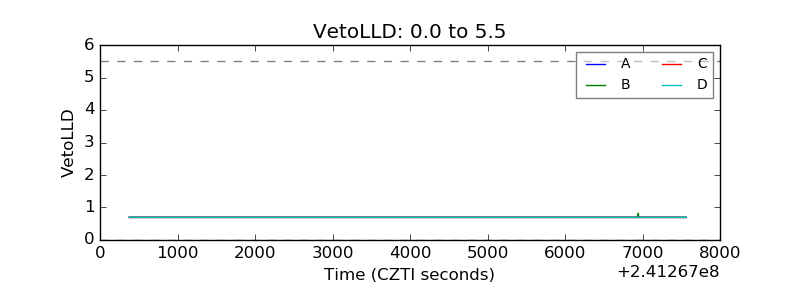 |
| Alpha Counter | 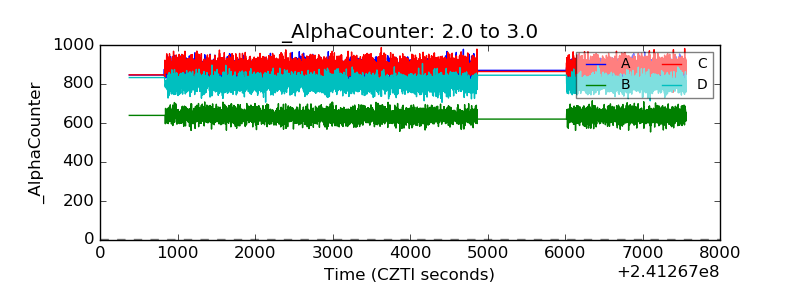 |
| _CPM_Rate | 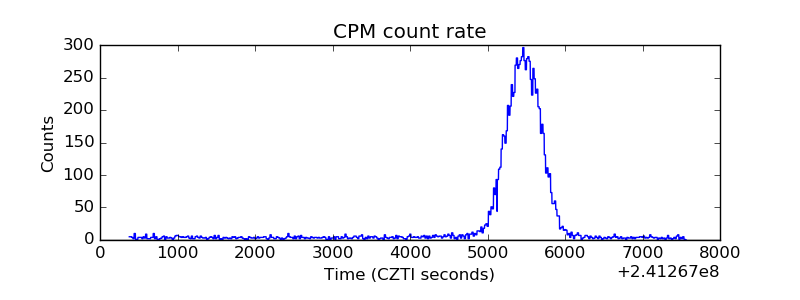 |
| CZT Counter | 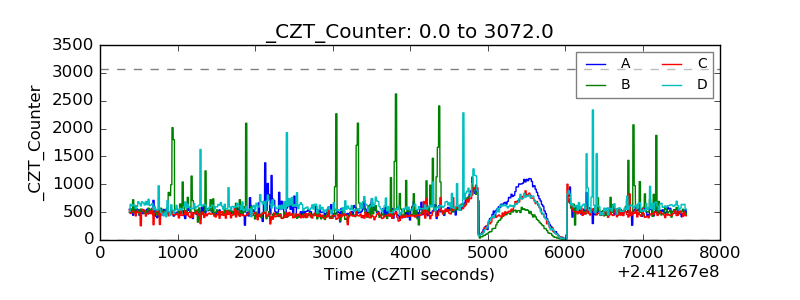 |
| +2.5 Volts monitor | 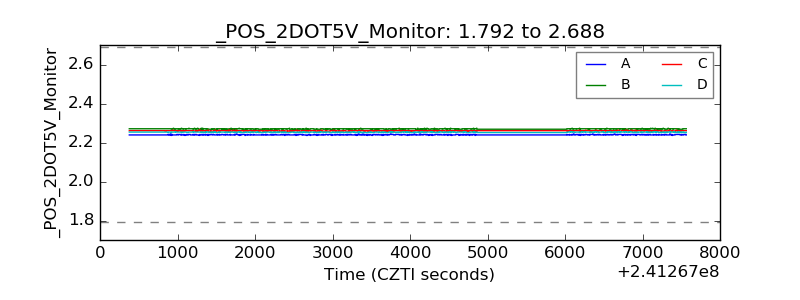 |
| +5 Volts monitor |  |
| _ROLL_ROT | 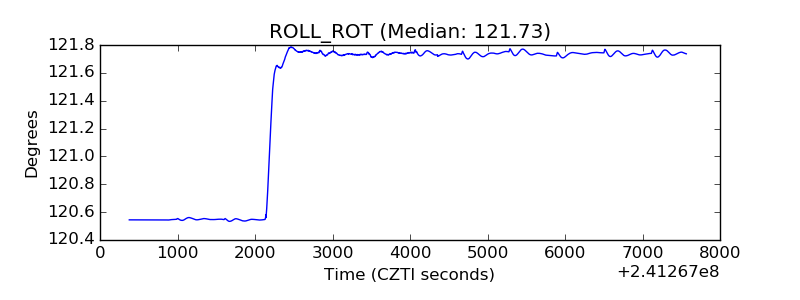 |
| _Roll_DEC | 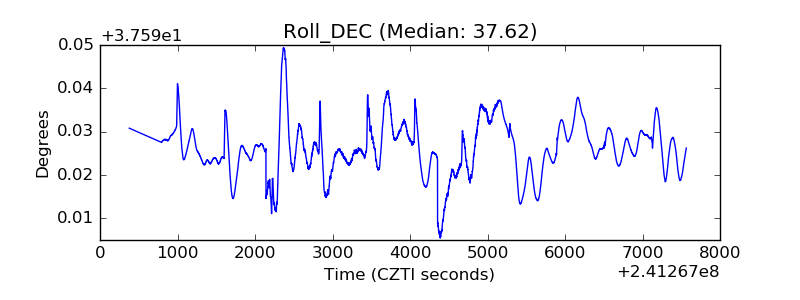 |
| _Roll_RA | 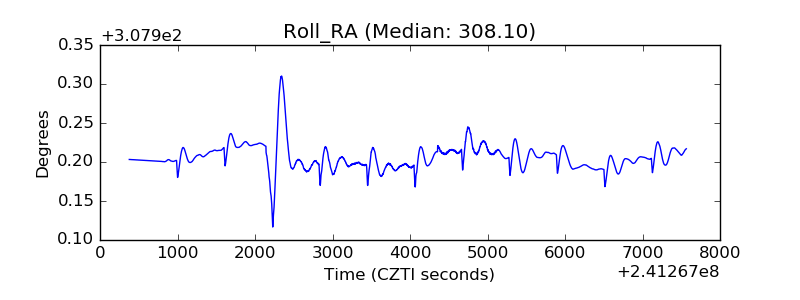 |
| Veto Counter | 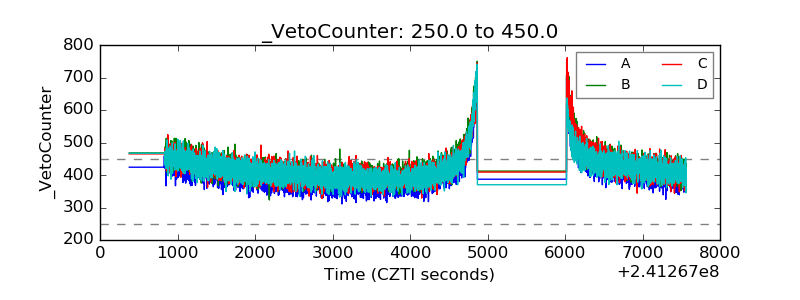 |