| Param | Original file | Final file |
|---|---|---|
| Filename | modeM0/AS1A03_124T01_9000001486_10308cztM0_level2.evt | modeM0/AS1A03_124T01_9000001486_10308cztM0_level2_quad_clean.evt |
| Size (bytes) | 2,172,695,040 | 397,699,200 |
| Size | 2.0 GB | 379.3 MB |
| Events in quadrant A | 15,233,622 | 2,544,024 |
| Events in quadrant B | 16,488,163 | 2,523,168 |
| Events in quadrant C | 14,253,020 | 2,478,502 |
| Events in quadrant D | 17,802,504 | 2,440,432 |
| Mode M0 | |||
|---|---|---|---|
| Quadrant | BADHDUFLAG | Total packets | Discarded packets |
| A | 0 | 78423 | 15076 |
| B | 0 | 87287 | 19883 |
| C | 0 | 76611 | 14638 |
| D | 0 | 87213 | 14546 |
| Mode M9 | |||
|---|---|---|---|
| Quadrant | BADHDUFLAG | Total packets | Discarded packets |
| A | 0 | 78 | 7 |
| B | 0 | 79 | 8 |
| C | 0 | 79 | 8 |
| D | 0 | 78 | 7 |
| Mode SS | |||
|---|---|---|---|
| Quadrant | BADHDUFLAG | Total packets | Discarded packets |
| A | 0 | 752 | 133 |
| B | 0 | 752 | 132 |
| C | 0 | 752 | 133 |
| D | 0 | 742 | 122 |
| Quadrant | Total seconds | Saturated seconds | Saturation percentage |
|---|---|---|---|
| A | 29781 | 381 | 1.279339% |
| B | 29508 | 755 | 2.558628% |
| C | 29922 | 342 | 1.142972% |
| D | 30604 | 449 | 1.467128% |
Noise dominated data is calculated using 1-second bins in cleaned event files. If a bin has >2000 counts, and if more than 50% of those come from <1% of pixels, then it is considered to be noise-dominated and hence unusable.
| Quadrant | # 1 sec bins | Bins with >0 counts | Bins with >2000 counts | High rate bins dominated by noise | Noise dominated (total time) | Noise dominated (detector-on time) | Marked lightcurve |
|---|---|---|---|---|---|---|---|
| A | 38004 | 30668 | 3 | 3 | 0.01% | 0.01% | 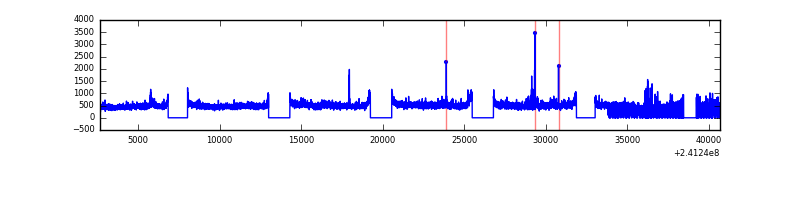 |
| B | 38003 | 30423 | 220 | 220 | 0.58% | 0.72% | 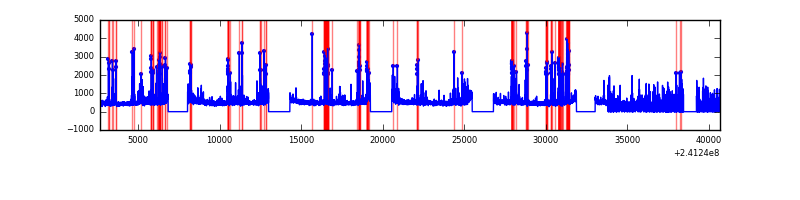 |
| C | 38003 | 30759 | 66 | 66 | 0.17% | 0.21% | 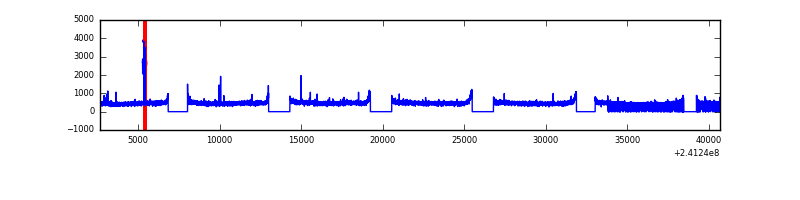 |
| D | 38004 | 30867 | 157 | 157 | 0.41% | 0.51% | 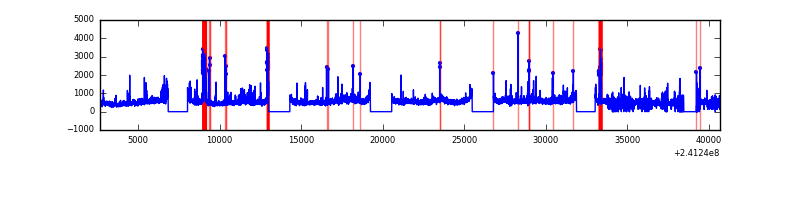 |
Top three noisy pixels from each quadrant. If the there are fewer than three noisy pixels in the level2.evt file, extra rows are filled as -1
| Pixel properties | Quadrant properties | ||||||
|---|---|---|---|---|---|---|---|
| Quadrant | DetID | PixID | Counts | Sigma | Mean | Median | Sigma |
| A | 8 | 15 | 534674 | 715.92 | 3732 | 3665 | 741.7 |
| A | 8 | 5 | 146445 | 192.5 | 3732 | 3665 | 741.7 |
| A | 3 | 1 | 83607 | 107.78 | 3732 | 3665 | 741.7 |
| B | 4 | 239 | 1896296 | 2768.53 | 3666 | 3585 | 683.7 |
| B | 0 | 214 | 124779 | 177.27 | 3666 | 3585 | 683.7 |
| B | 11 | 51 | 123674 | 175.66 | 3666 | 3585 | 683.7 |
| C | 4 | 254 | 186933 | 223.74 | 3593 | 3614 | 819.4 |
| C | 14 | 234 | 30872 | 33.27 | 3593 | 3614 | 819.4 |
| C | 13 | 61 | 26805 | 28.3 | 3593 | 3614 | 819.4 |
| D | 8 | 195 | 1972625 | 2280.5 | 3666 | 3577 | 863.4 |
| D | 1 | 20 | 482221 | 554.35 | 3666 | 3577 | 863.4 |
| D | 14 | 34 | 371745 | 426.4 | 3666 | 3577 | 863.4 |
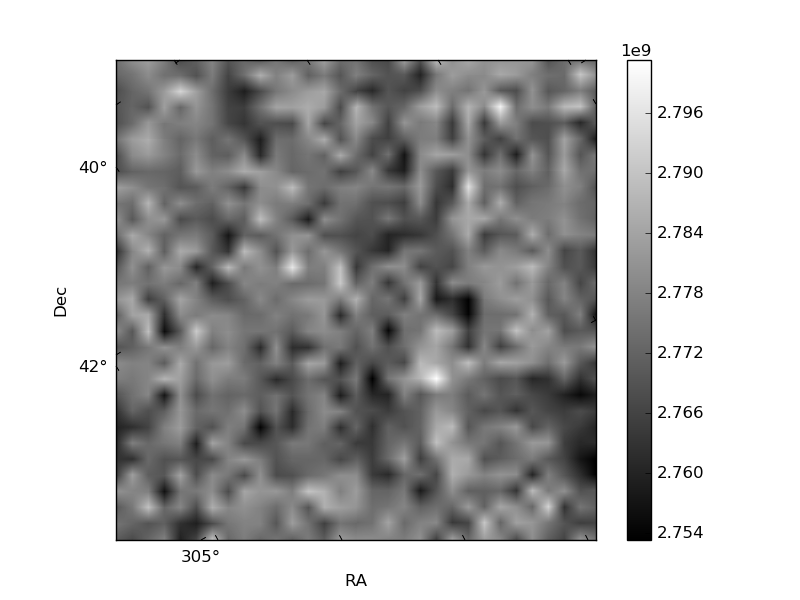
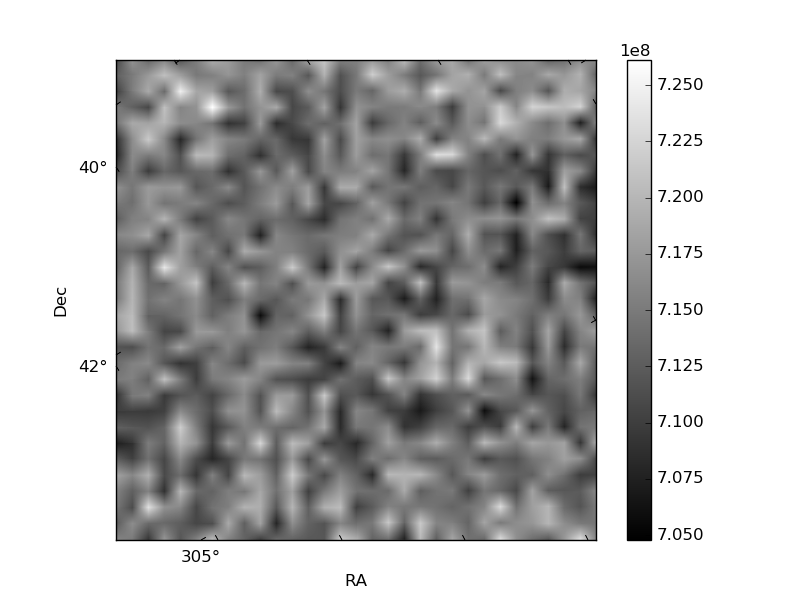
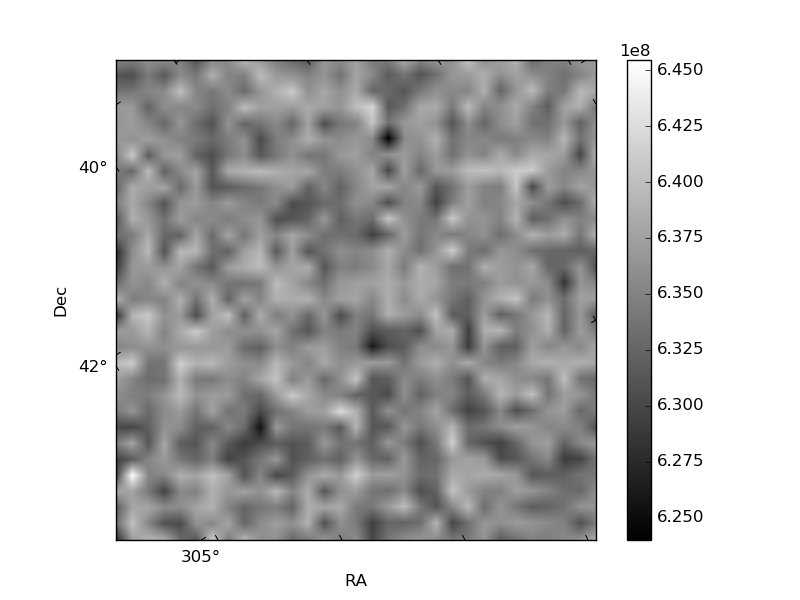
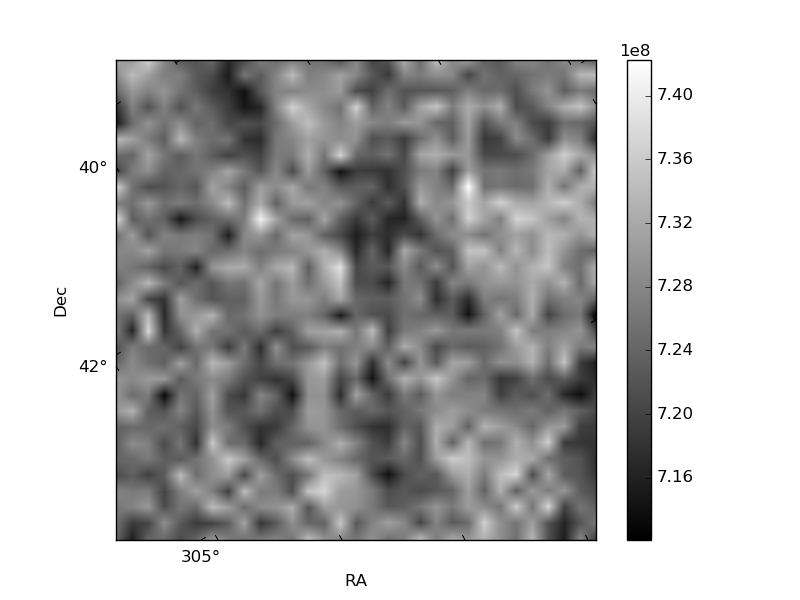
Histogram calculated using DETX and DETY for each event in the final _common_clean file
| Quadrant A | 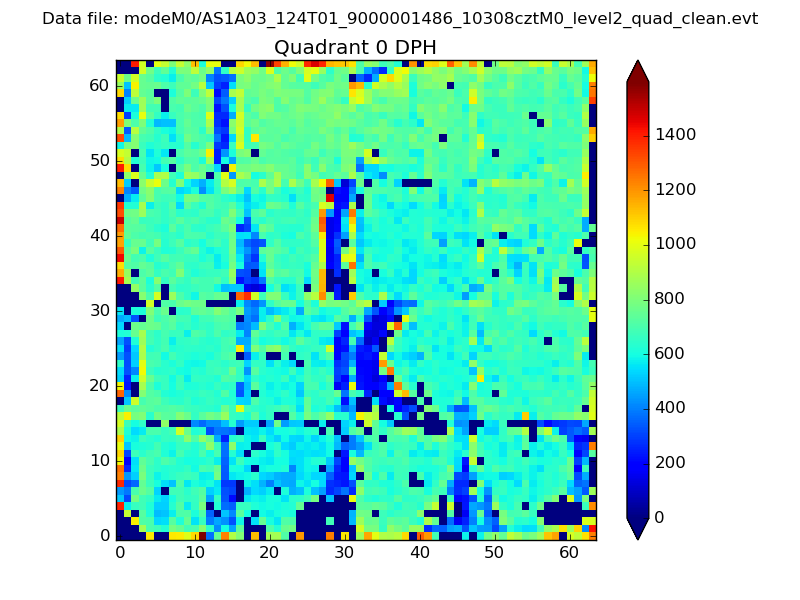 |
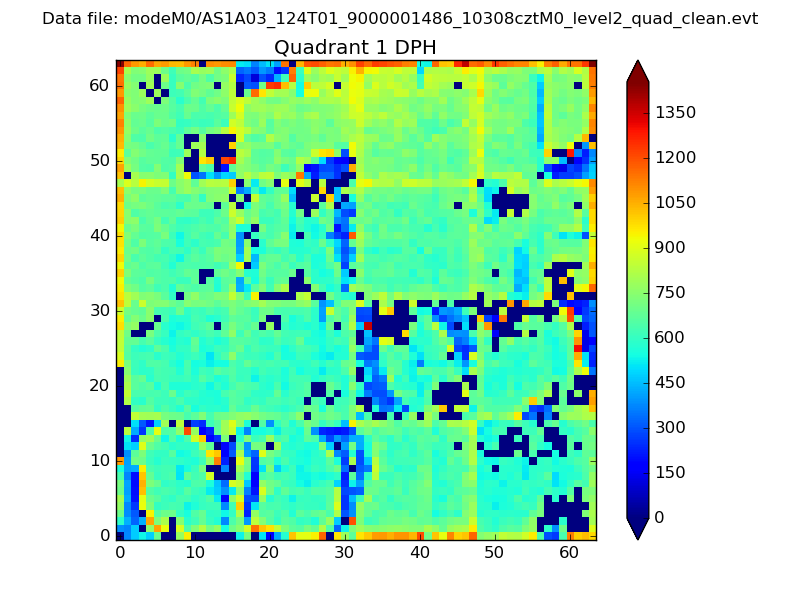 |
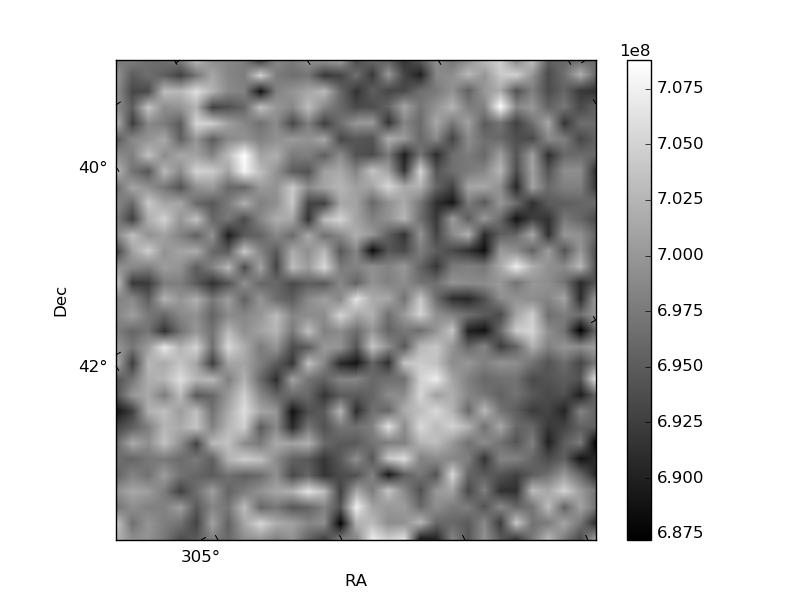
Quadrant B |
|---|---|---|---|
| Quadrant D | 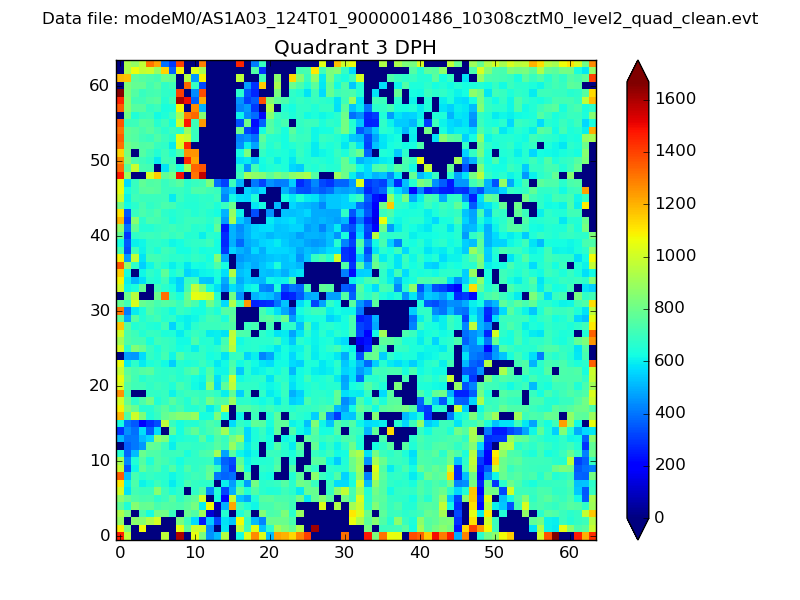 |
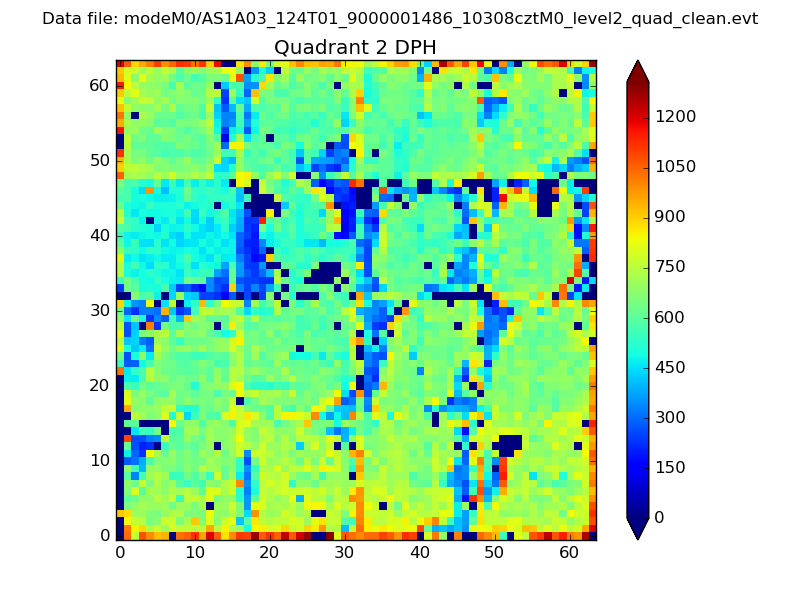 |
Quadrant C |
| Plot type | Count rate plots | Images |
|---|---|---|
| Comparison with Poisson distribution Blue bars denote a histogram of data divided into 1 sec bins. Red curve is a Poisson curve with rate = median count rate of data. |
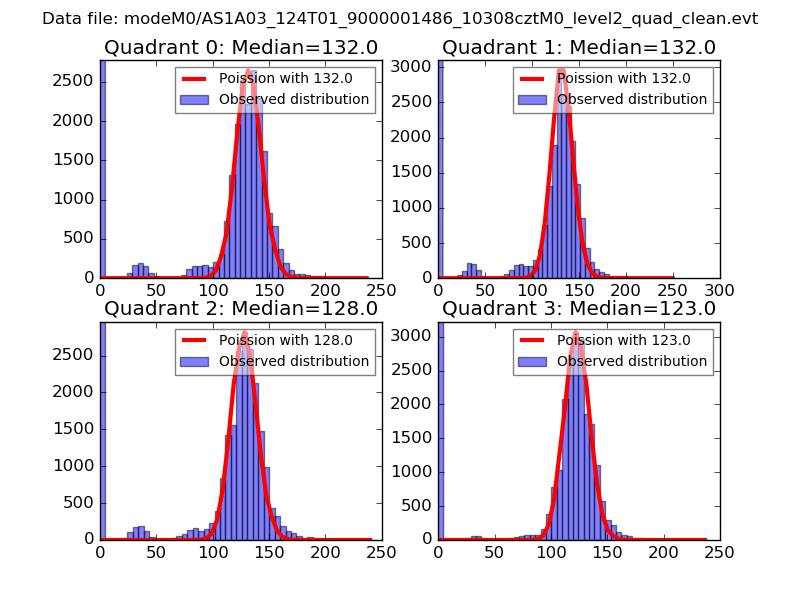 |
 |
| Quadrant-wise count rates Data is divided into 100 sec bins |
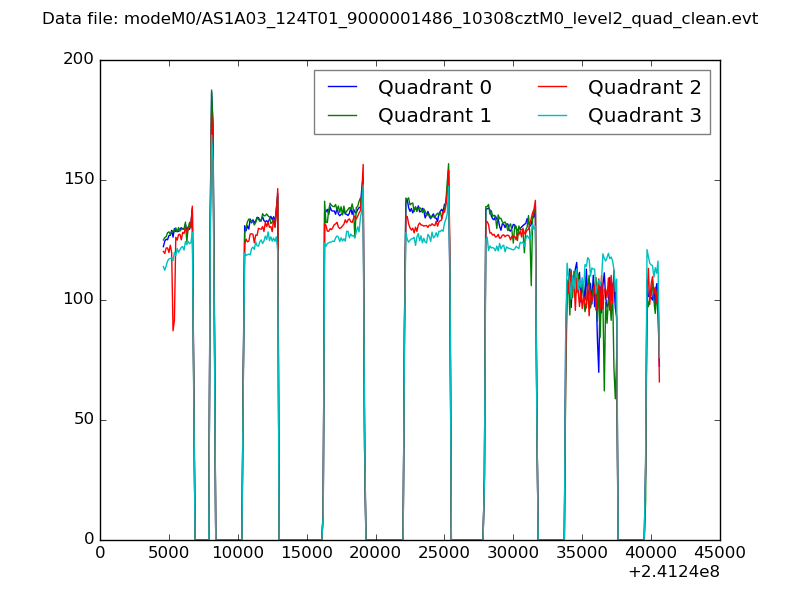 |
|
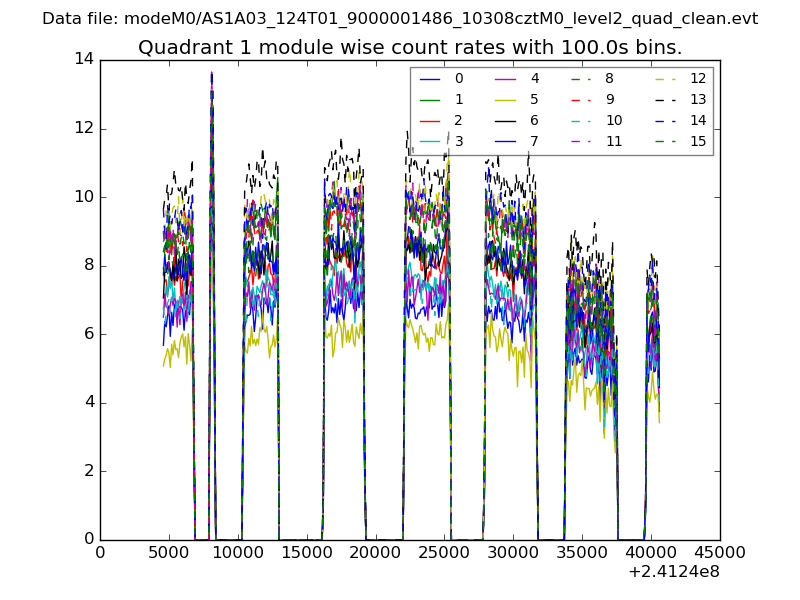
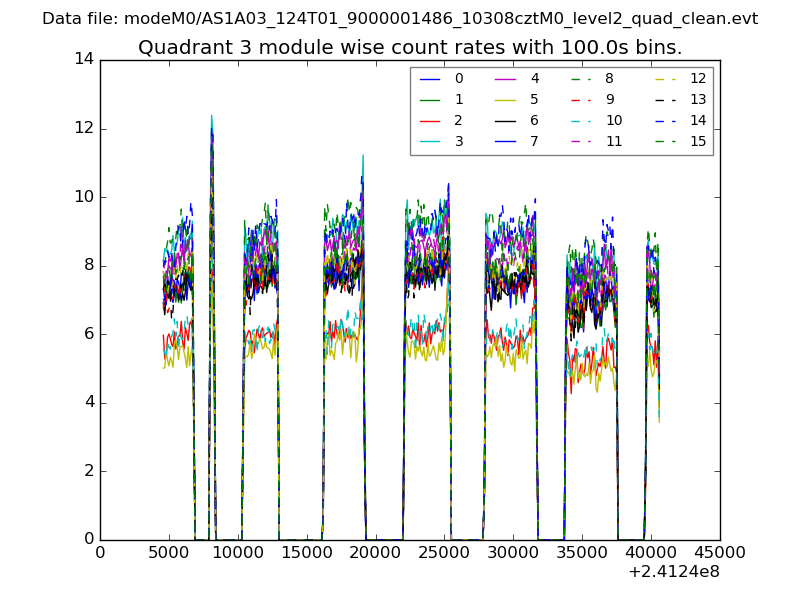
| Module-wise count rates for Quadrant A Data is divided into 100 sec bins |
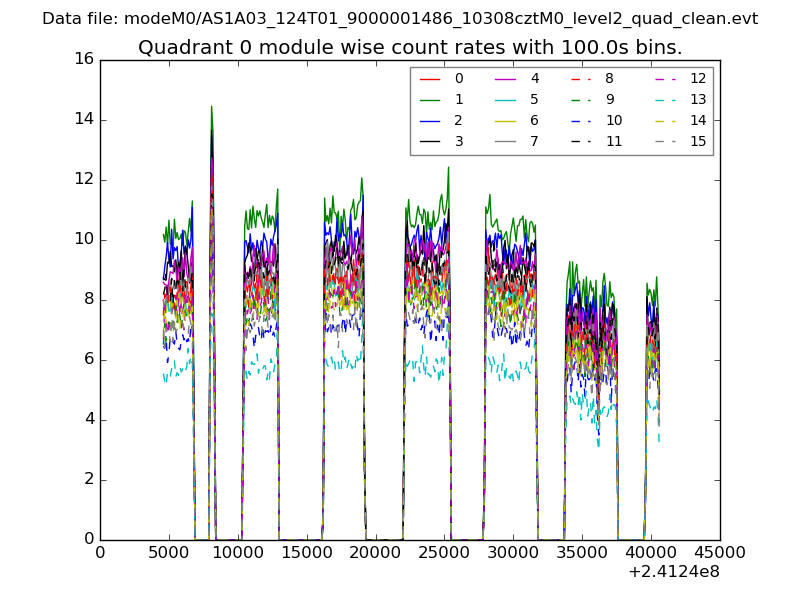 |
 |
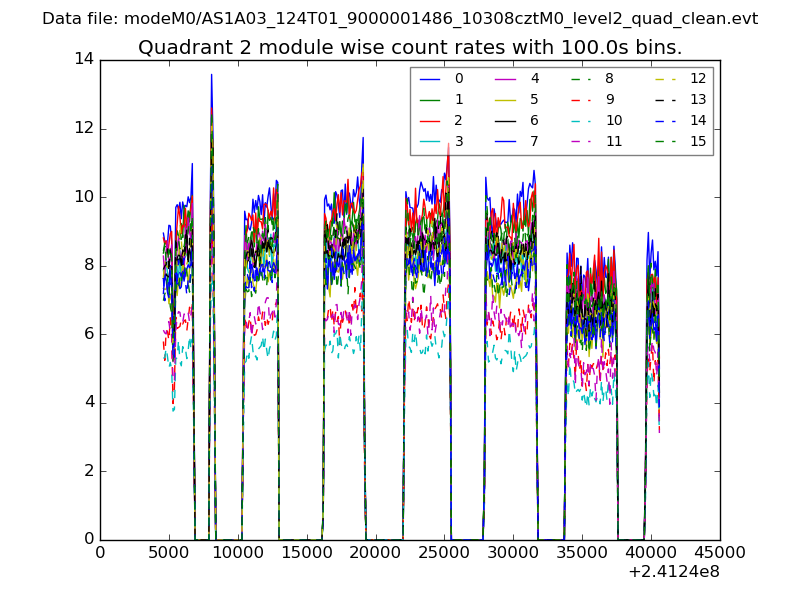
| Module-wise count rates for Quadrant B Data is divided into 100 sec bins |
 |
 |
| Module-wise count rates for Quadrant C Data is divided into 100 sec bins |
 |
 |
| Module-wise count rates for Quadrant D Data is divided into 100 sec bins |
 |
 |
| Parameter | Plot |
|---|---|
| CZT HV Monitor | 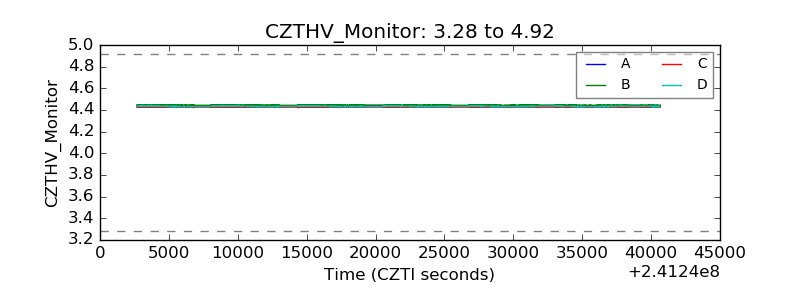 |
| D_VDD | 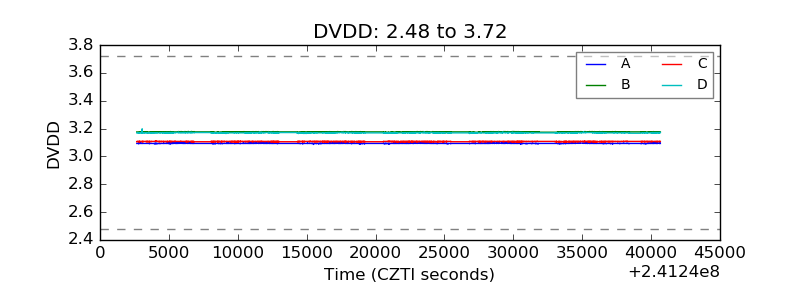 |
| Temperature 1 | 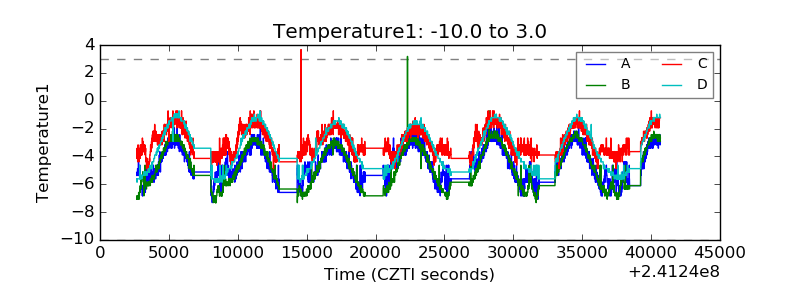 |
| Veto HV Monitor | 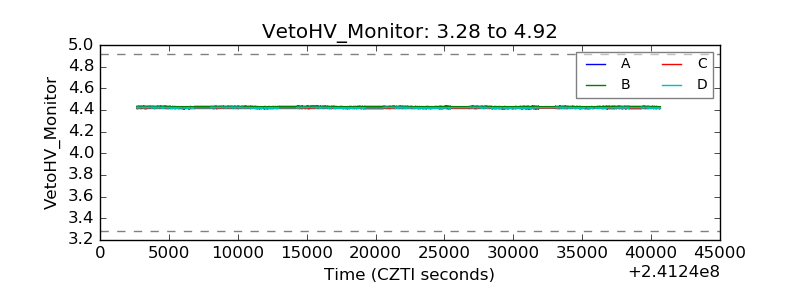 |
| Veto LLD | 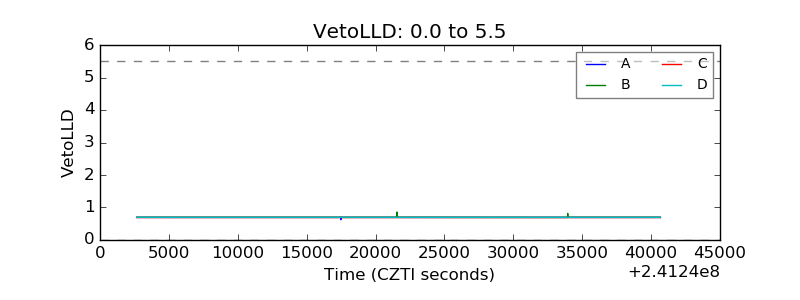 |
| Alpha Counter | 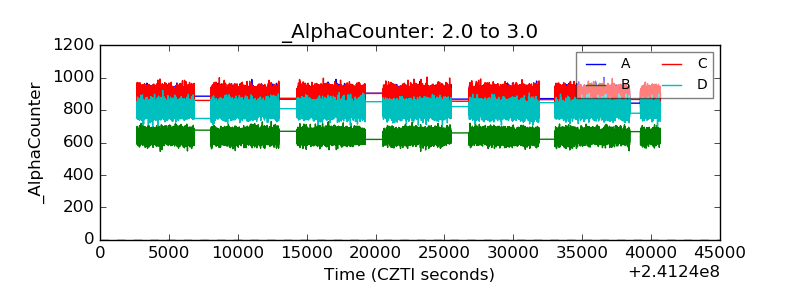 |
| _CPM_Rate | 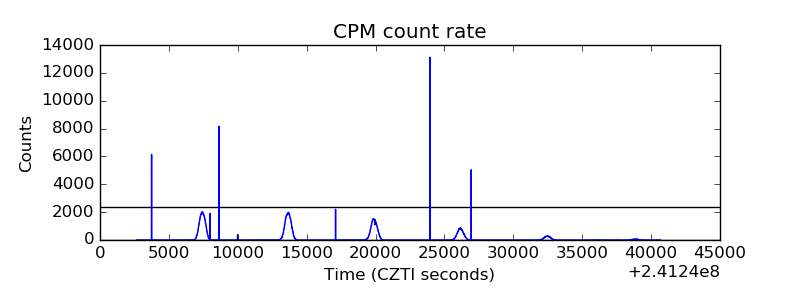 |
| CZT Counter | 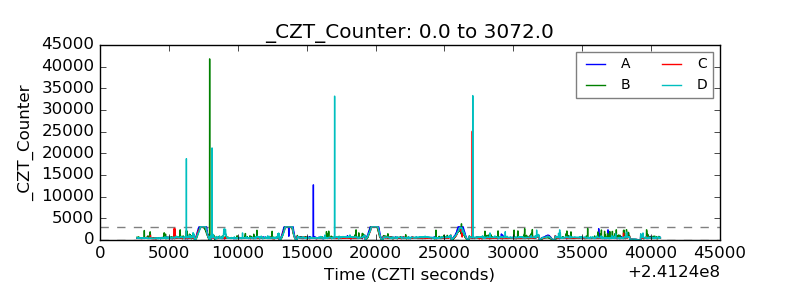 |
| +2.5 Volts monitor | 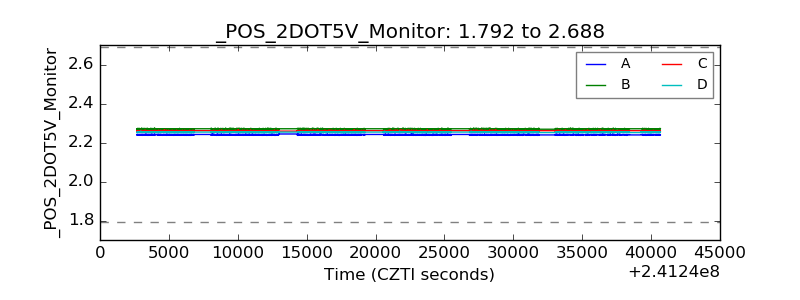 |
| +5 Volts monitor | 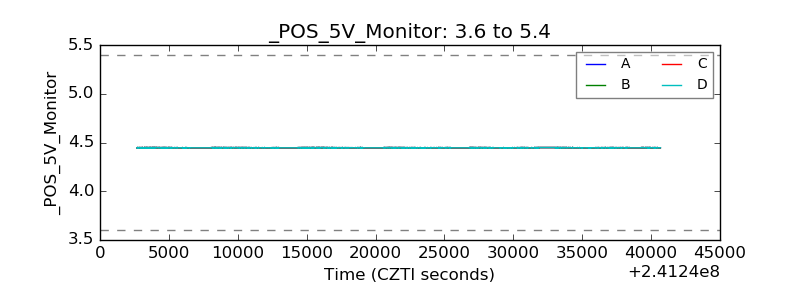 |
| _ROLL_ROT |  |
| _Roll_DEC | 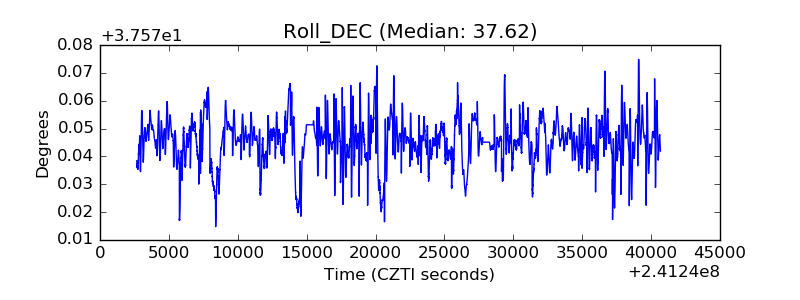 |
| _Roll_RA | 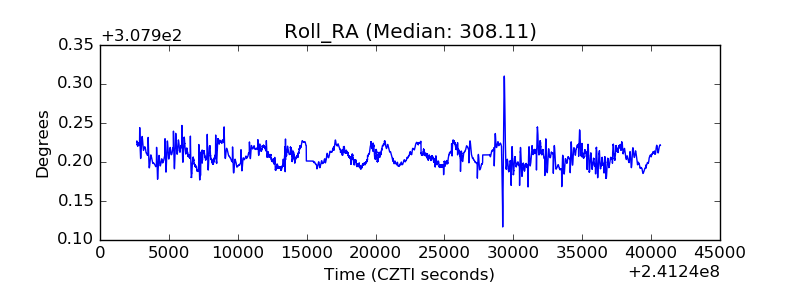 |
| Veto Counter | 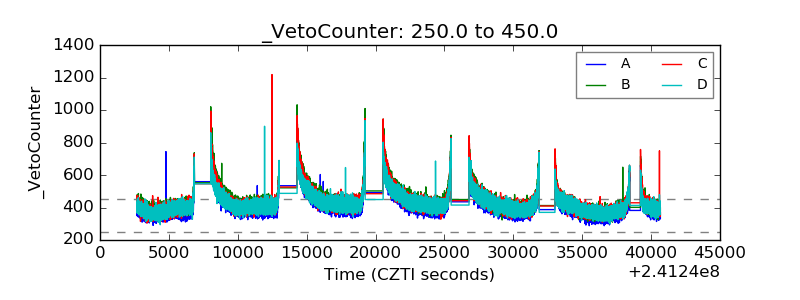 |