| Param | Original file | Final file |
|---|---|---|
| Filename | modeM0/AS1A03_124T01_9000001486_10309cztM0_level2.evt | modeM0/AS1A03_124T01_9000001486_10309cztM0_level2_quad_clean.evt |
| Size (bytes) | 323,199,360 | 65,655,360 |
| Size | 308.2 MB | 62.6 MB |
| Events in quadrant A | 2,294,607 | 424,798 |
| Events in quadrant B | 2,295,064 | 386,898 |
| Events in quadrant C | 2,270,890 | 415,148 |
| Events in quadrant D | 2,598,789 | 423,762 |
| Mode M0 | |||
|---|---|---|---|
| Quadrant | BADHDUFLAG | Total packets | Discarded packets |
| A | 0 | 25112 | 15137 |
| B | 0 | 30379 | 20685 |
| C | 0 | 26439 | 16283 |
| D | 0 | 27129 | 16299 |
| Mode M9 | |||
|---|---|---|---|
| Quadrant | BADHDUFLAG | Total packets | Discarded packets |
| A | 0 | 6 | 3 |
| B | 0 | 6 | 3 |
| C | 0 | 6 | 3 |
| D | 0 | 6 | 4 |
| Mode SS | |||
|---|---|---|---|
| Quadrant | BADHDUFLAG | Total packets | Discarded packets |
| A | 0 | 255 | 142 |
| B | 0 | 257 | 153 |
| C | 0 | 256 | 156 |
| D | 0 | 250 | 140 |
| Quadrant | Total seconds | Saturated seconds | Saturation percentage |
|---|---|---|---|
| A | 4837 | 55 | 1.137068% |
| B | 4388 | 72 | 1.640839% |
| C | 4806 | 64 | 1.331669% |
| D | 5103 | 35 | 0.685871% |
Noise dominated data is calculated using 1-second bins in cleaned event files. If a bin has >2000 counts, and if more than 50% of those come from <1% of pixels, then it is considered to be noise-dominated and hence unusable.
| Quadrant | # 1 sec bins | Bins with >0 counts | Bins with >2000 counts | High rate bins dominated by noise | Noise dominated (total time) | Noise dominated (detector-on time) | Marked lightcurve |
|---|---|---|---|---|---|---|---|
| A | 7245 | 5702 | 0 | 0 | 0.00% | 0.00% | 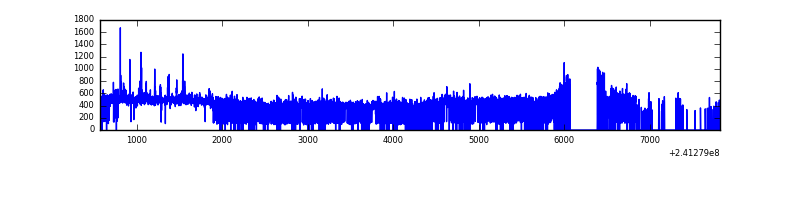 |
| B | 7244 | 5293 | 13 | 13 | 0.18% | 0.25% | 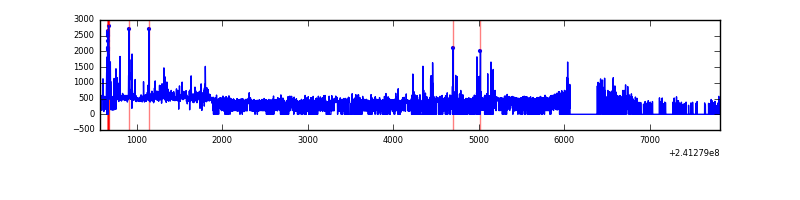 |
| C | 7241 | 5682 | 21 | 21 | 0.29% | 0.37% | 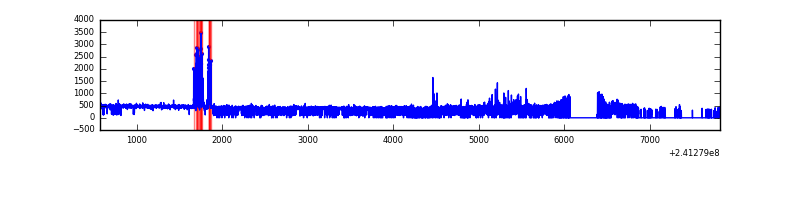 |
| D | 7243 | 5703 | 4 | 4 | 0.06% | 0.07% | 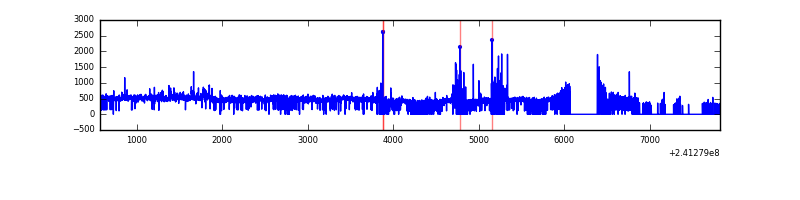 |
Top three noisy pixels from each quadrant. If the there are fewer than three noisy pixels in the level2.evt file, extra rows are filled as -1
| Pixel properties | Quadrant properties | ||||||
|---|---|---|---|---|---|---|---|
| Quadrant | DetID | PixID | Counts | Sigma | Mean | Median | Sigma |
| A | 8 | 5 | 59189 | 503.22 | 566 | 554 | 116.5 |
| A | 8 | 15 | 32248 | 272.0 | 566 | 554 | 116.5 |
| A | 3 | 1 | 17114 | 142.12 | 566 | 554 | 116.5 |
| B | 4 | 239 | 204407 | 2050.83 | 511 | 498 | 99.4 |
| B | 11 | 51 | 77691 | 776.38 | 511 | 498 | 99.4 |
| B | 0 | 214 | 19101 | 187.1 | 511 | 498 | 99.4 |
| C | 4 | 254 | 142103 | 1112.86 | 544 | 546 | 127.2 |
| C | 13 | 61 | 4094 | 27.89 | 544 | 546 | 127.2 |
| C | 14 | 255 | 2782 | 17.58 | 544 | 546 | 127.2 |
| D | 8 | 195 | 140807 | 1016.33 | 574 | 559 | 138.0 |
| D | 2 | 16 | 87039 | 626.69 | 574 | 559 | 138.0 |
| D | 12 | 233 | 44162 | 315.98 | 574 | 559 | 138.0 |
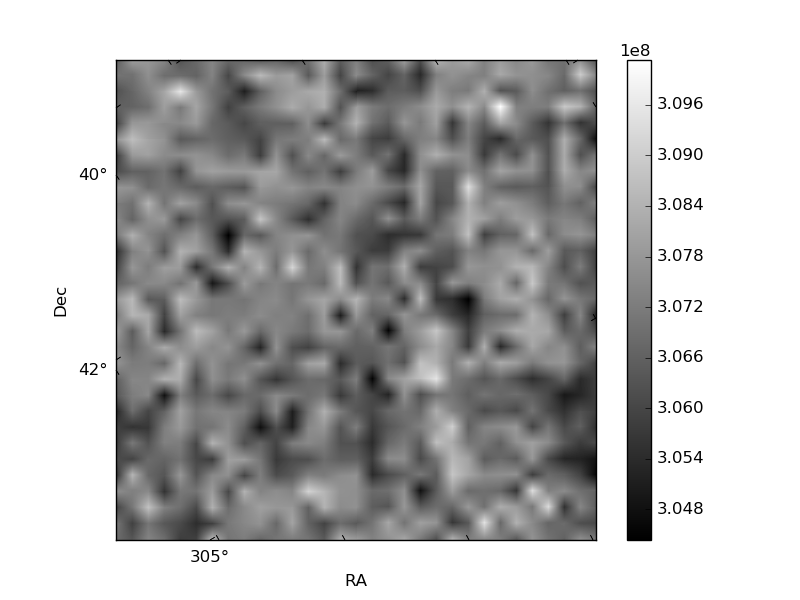
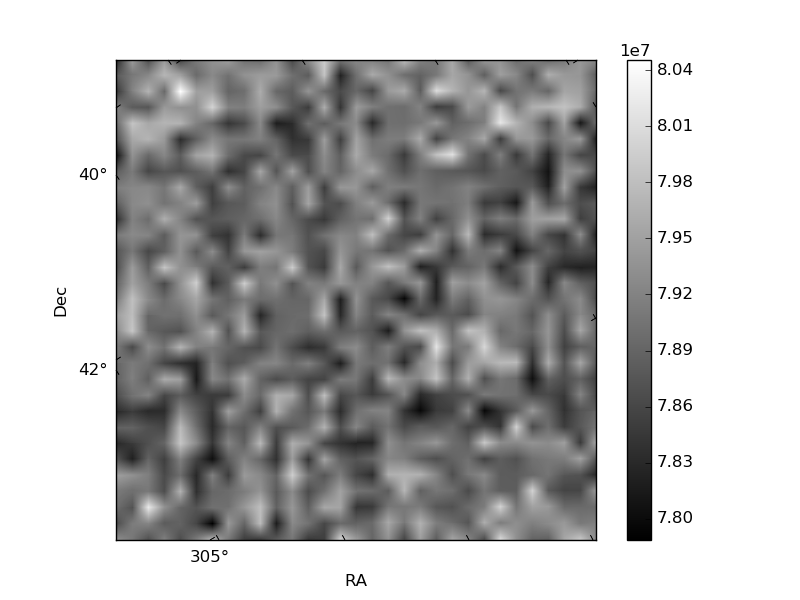
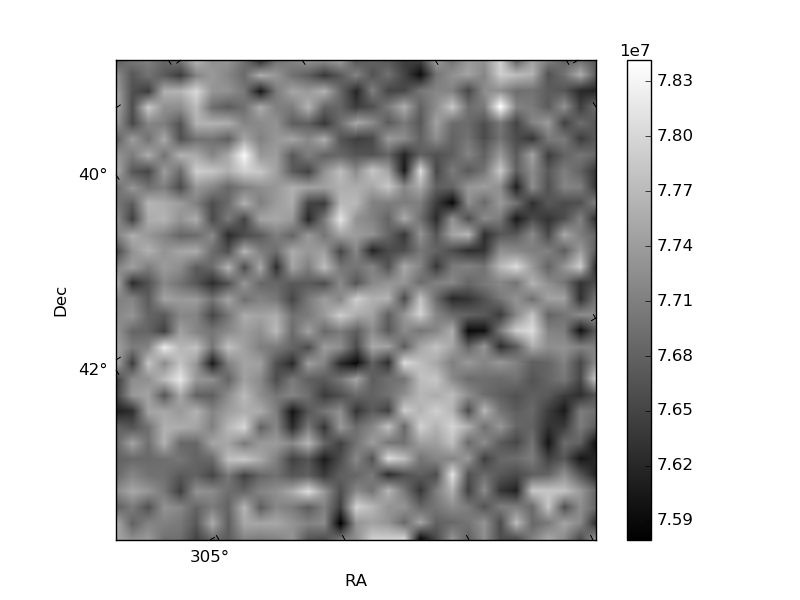
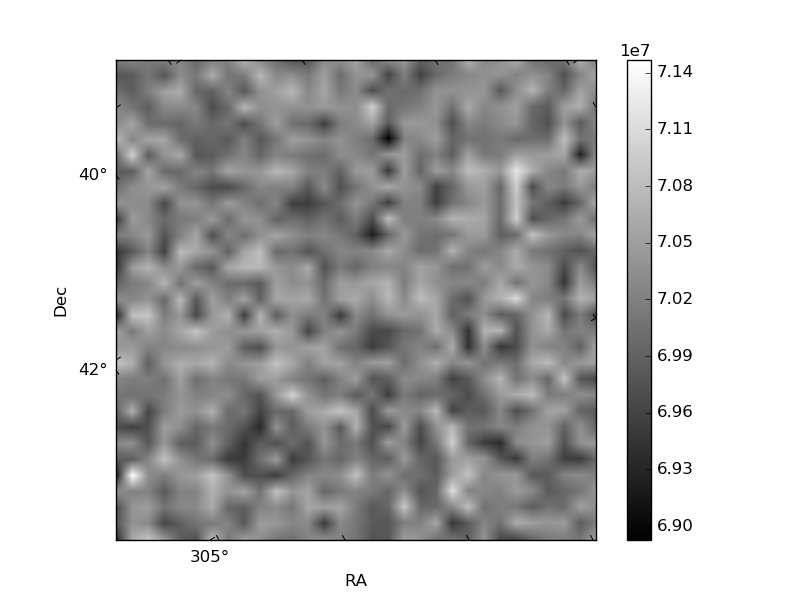
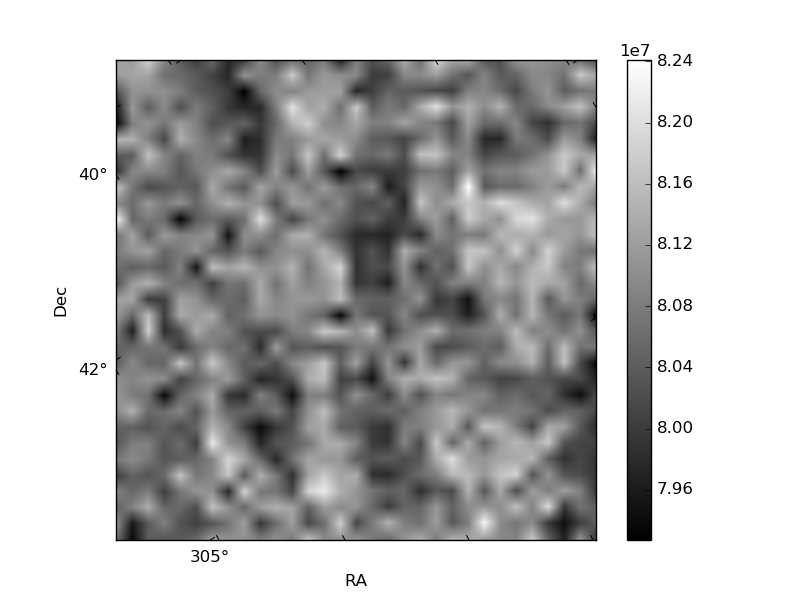
Histogram calculated using DETX and DETY for each event in the final _common_clean file
| Quadrant A | 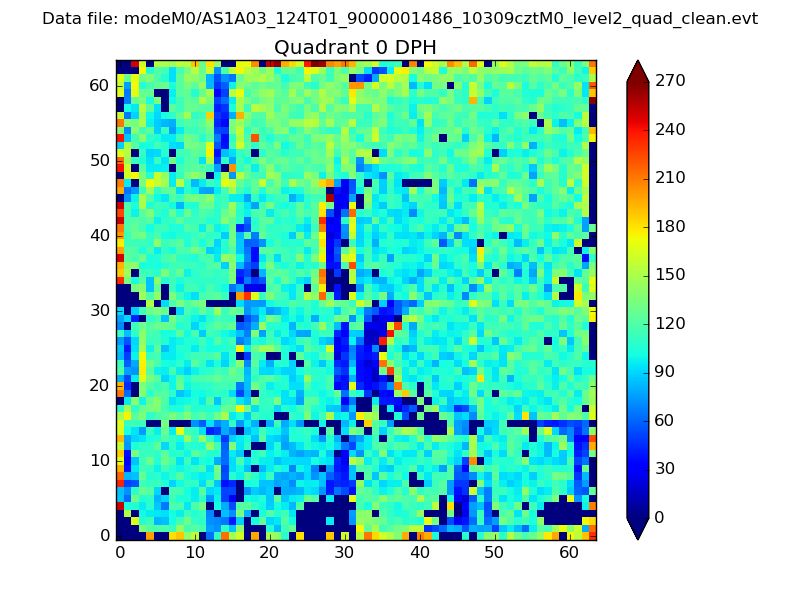 |
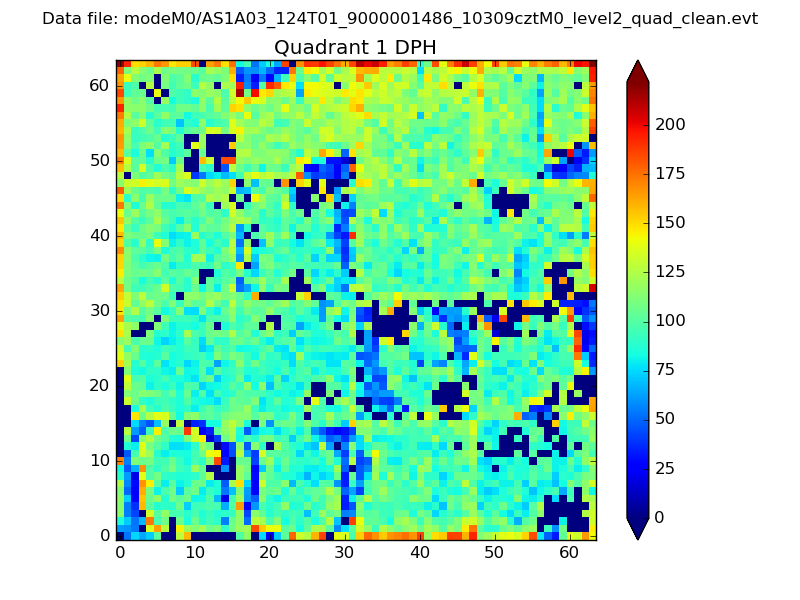 |
Quadrant B |
|---|---|---|---|
| Quadrant D | 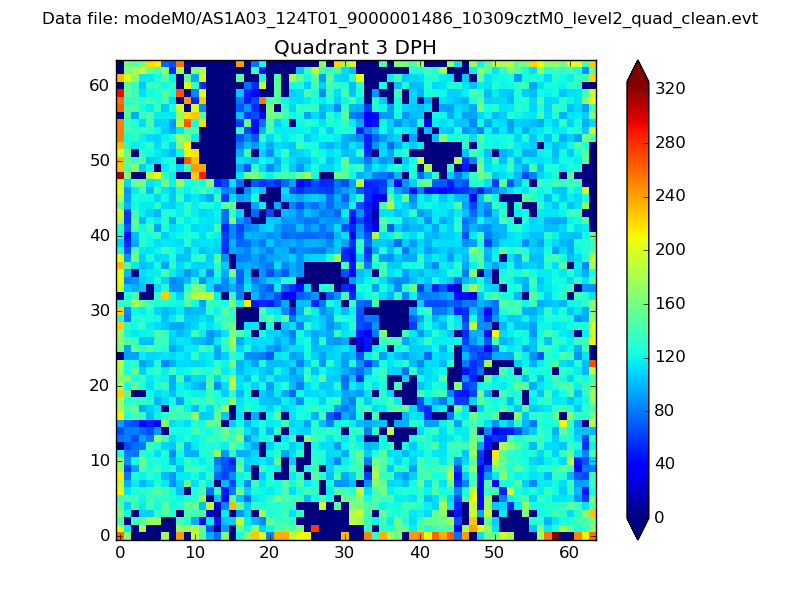 |
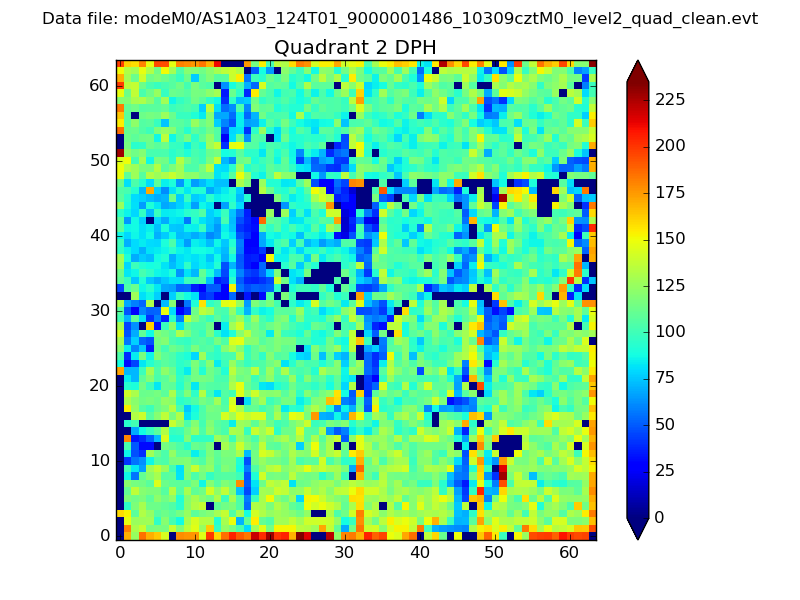 |
Quadrant C |
| Plot type | Count rate plots | Images |
|---|---|---|
| Comparison with Poisson distribution Blue bars denote a histogram of data divided into 1 sec bins. Red curve is a Poisson curve with rate = median count rate of data. |
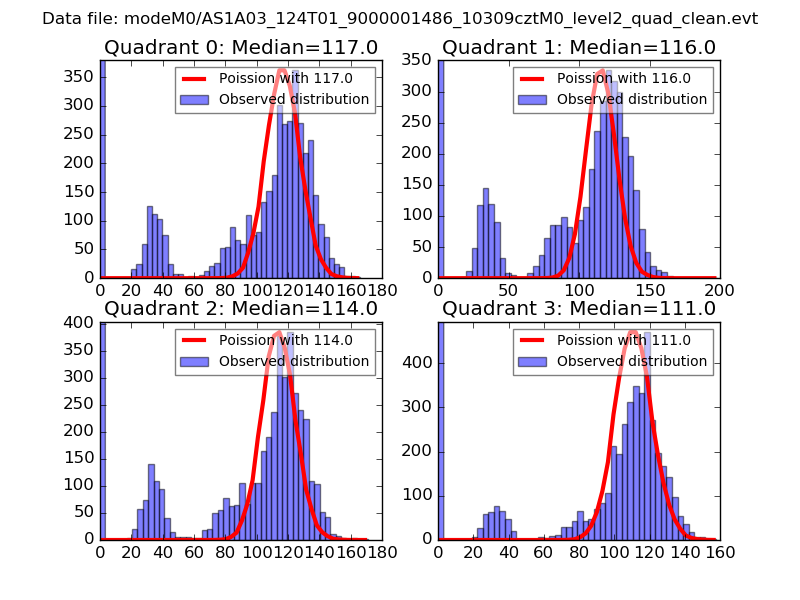 |
 |
| Quadrant-wise count rates Data is divided into 100 sec bins |
 |
|
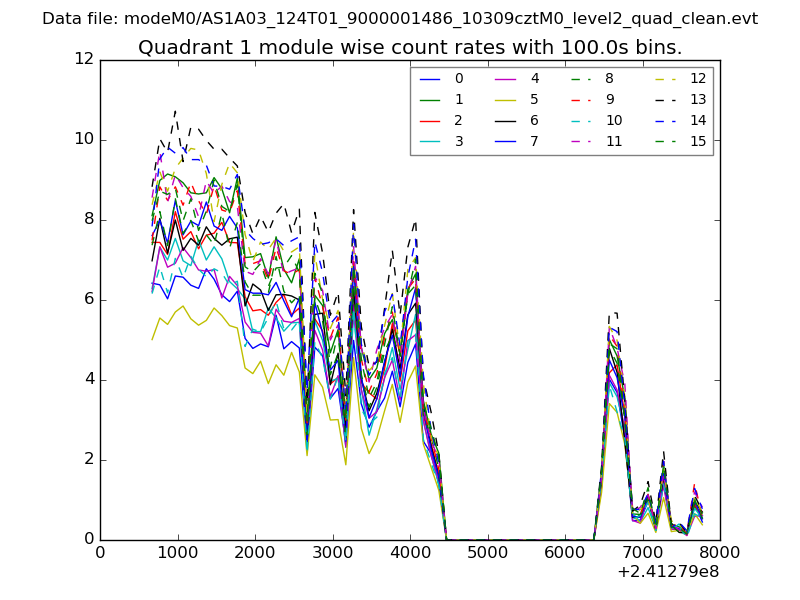
| Module-wise count rates for Quadrant A Data is divided into 100 sec bins |
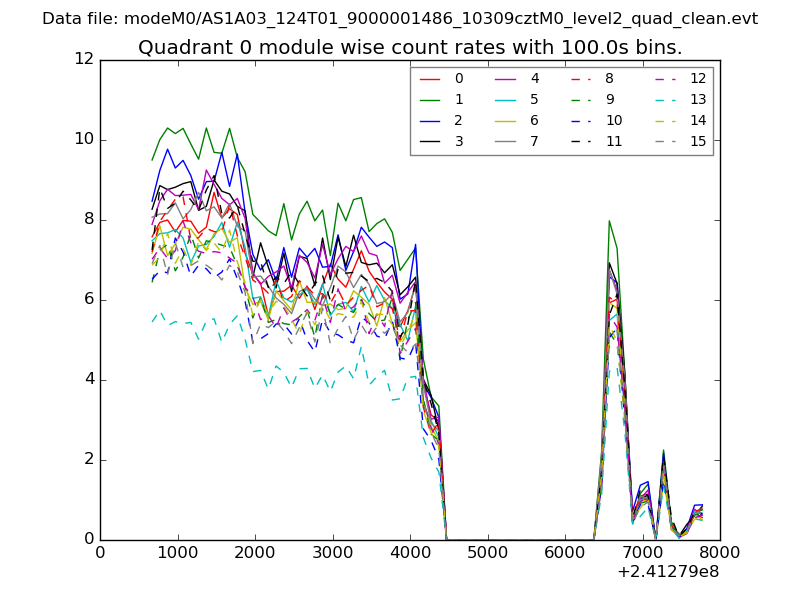 |
 |
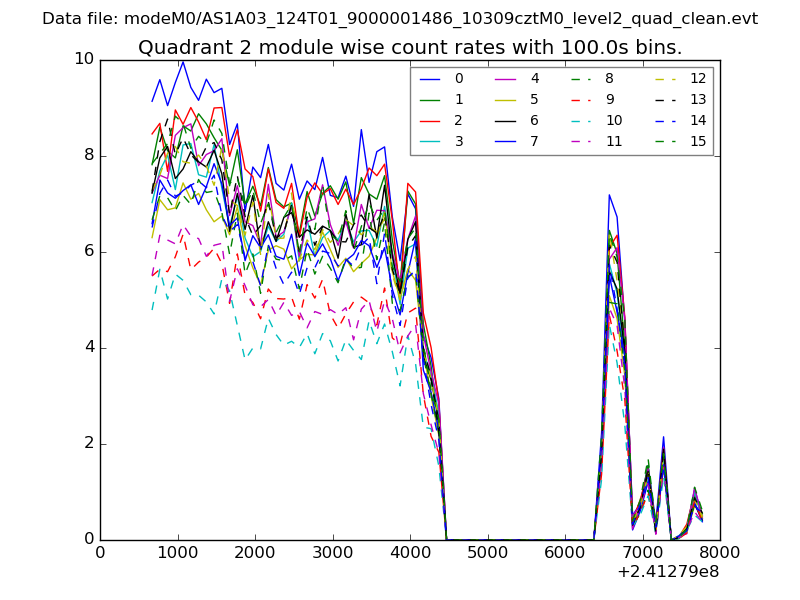
| Module-wise count rates for Quadrant B Data is divided into 100 sec bins |
 |
 |
| Module-wise count rates for Quadrant C Data is divided into 100 sec bins |
 |
 |
| Module-wise count rates for Quadrant D Data is divided into 100 sec bins |
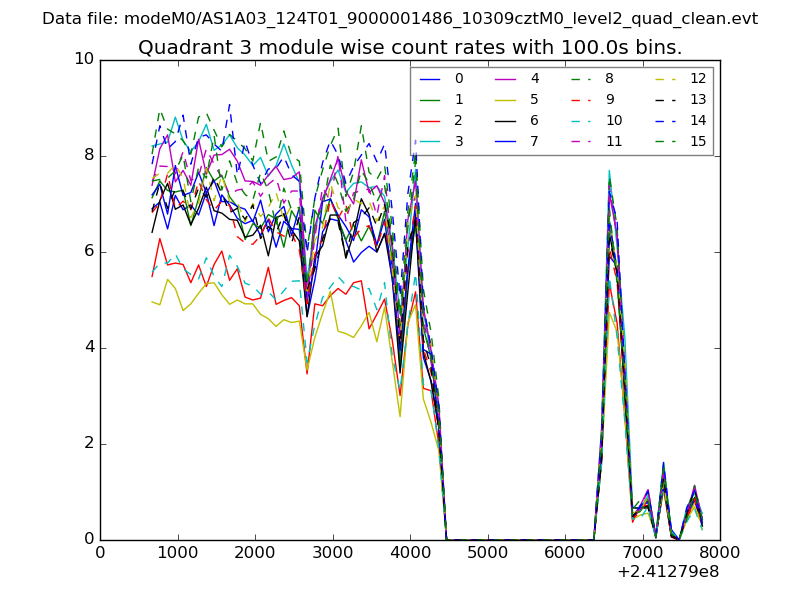 |
 |
| Parameter | Plot |
|---|---|
| CZT HV Monitor | 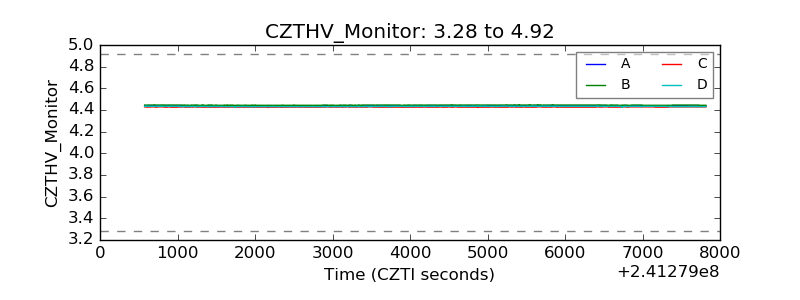 |
| D_VDD | 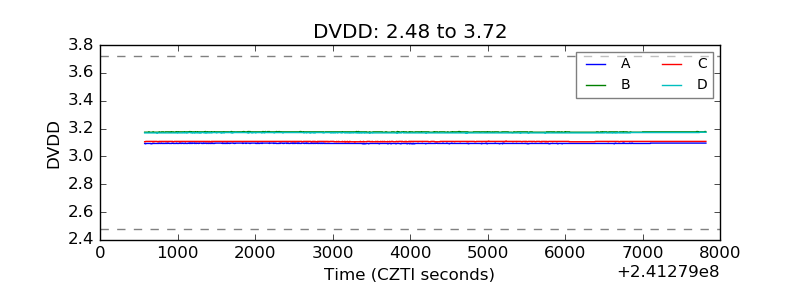 |
| Temperature 1 | 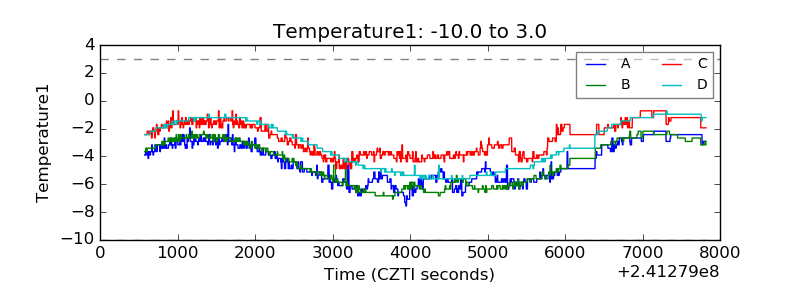 |
| Veto HV Monitor | 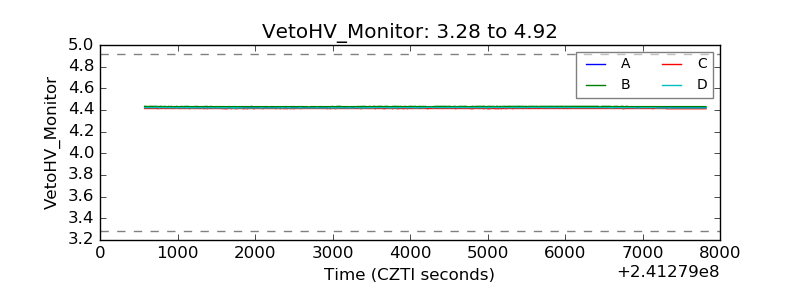 |
| Veto LLD | 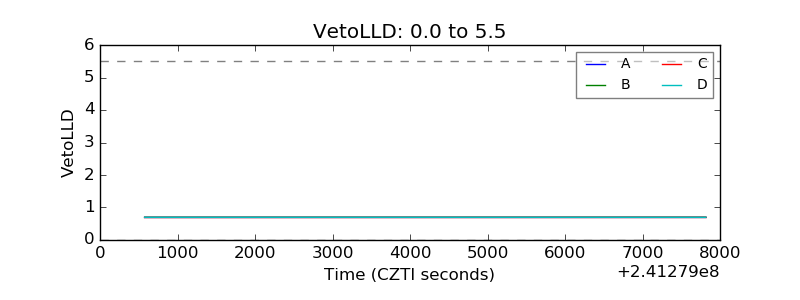 |
| Alpha Counter | 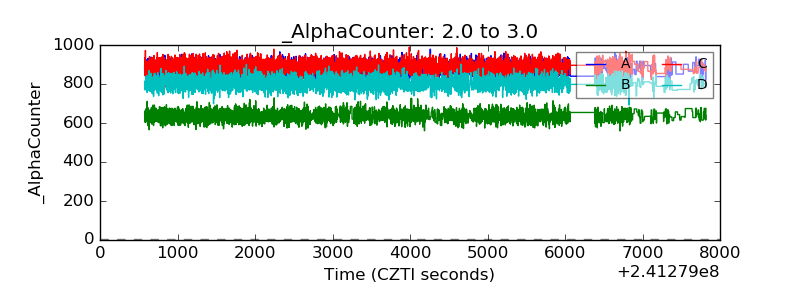 |
| _CPM_Rate | 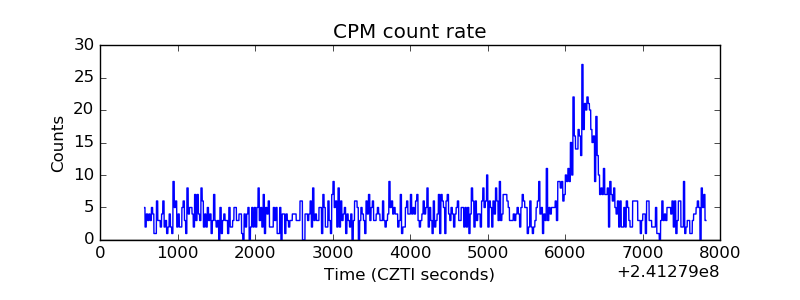 |
| CZT Counter | 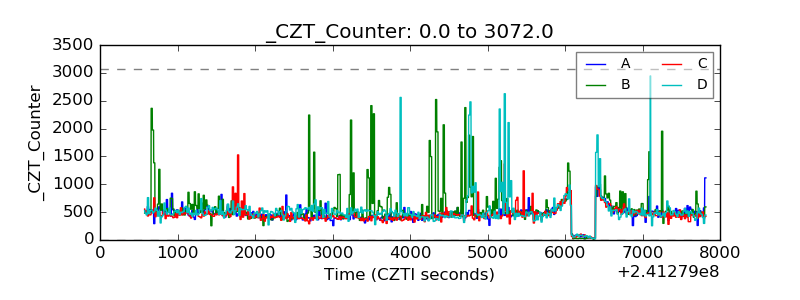 |
| +2.5 Volts monitor |  |
| +5 Volts monitor |  |
| _ROLL_ROT | 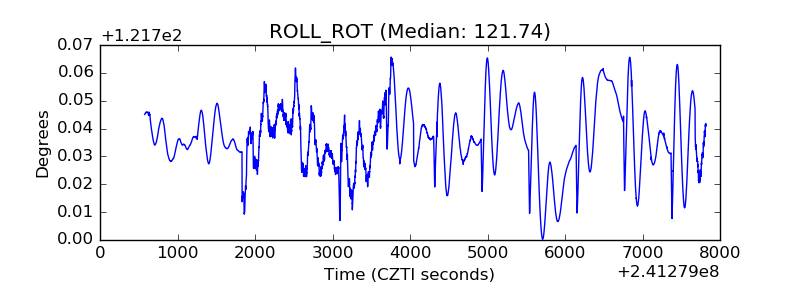 |
| _Roll_DEC | 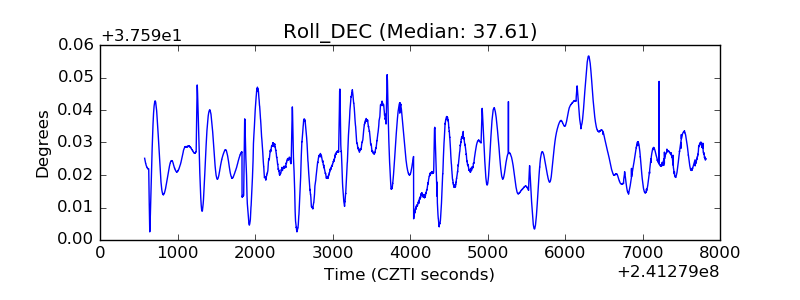 |
| _Roll_RA | 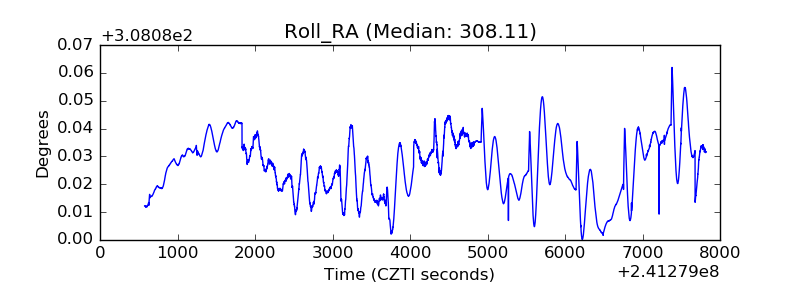 |
| Veto Counter | 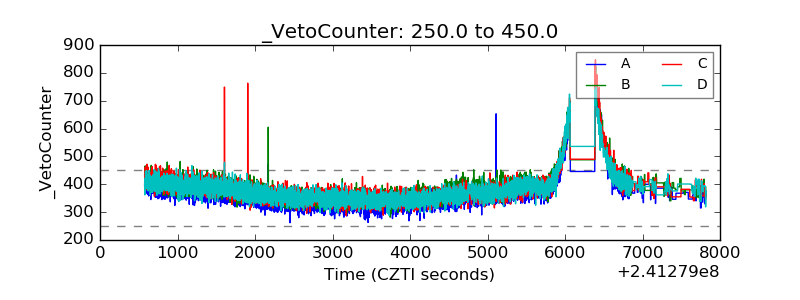 |