| Param | Original file | Final file |
|---|---|---|
| Filename | modeM0/AS1A03_124T01_9000001486_10310cztM0_level2.evt | modeM0/AS1A03_124T01_9000001486_10310cztM0_level2_quad_clean.evt |
| Size (bytes) | 406,719,360 | 76,944,960 |
| Size | 387.9 MB | 73.4 MB |
| Events in quadrant A | 2,871,836 | 468,048 |
| Events in quadrant B | 2,882,021 | 457,964 |
| Events in quadrant C | 2,758,032 | 472,168 |
| Events in quadrant D | 3,395,882 | 512,608 |
| Mode M0 | |||
|---|---|---|---|
| Quadrant | BADHDUFLAG | Total packets | Discarded packets |
| A | 0 | 32977 | 20677 |
| B | 0 | 36600 | 24313 |
| C | 0 | 33647 | 21310 |
| D | 0 | 35983 | 21502 |
| Mode M9 | |||
|---|---|---|---|
| Quadrant | BADHDUFLAG | Total packets | Discarded packets |
| A | 0 | 8 | 4 |
| B | 0 | 8 | 4 |
| C | 0 | 8 | 4 |
| D | 0 | 8 | 4 |
| Mode SS | |||
|---|---|---|---|
| Quadrant | BADHDUFLAG | Total packets | Discarded packets |
| A | 0 | 326 | 194 |
| B | 0 | 326 | 197 |
| C | 0 | 326 | 193 |
| D | 0 | 312 | 183 |
| Quadrant | Total seconds | Saturated seconds | Saturation percentage |
|---|---|---|---|
| A | 5766 | 137 | 2.375997% |
| B | 5594 | 132 | 2.359671% |
| C | 5883 | 81 | 1.376849% |
| D | 6686 | 92 | 1.376010% |
Noise dominated data is calculated using 1-second bins in cleaned event files. If a bin has >2000 counts, and if more than 50% of those come from <1% of pixels, then it is considered to be noise-dominated and hence unusable.
| Quadrant | # 1 sec bins | Bins with >0 counts | Bins with >2000 counts | High rate bins dominated by noise | Noise dominated (total time) | Noise dominated (detector-on time) | Marked lightcurve |
|---|---|---|---|---|---|---|---|
| A | 8391 | 7090 | 0 | 0 | 0.00% | 0.00% | 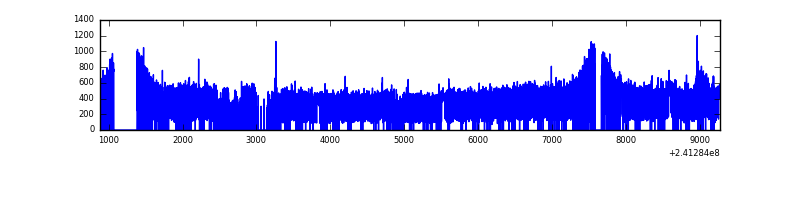 |
| B | 8391 | 6908 | 1 | 1 | 0.01% | 0.01% | 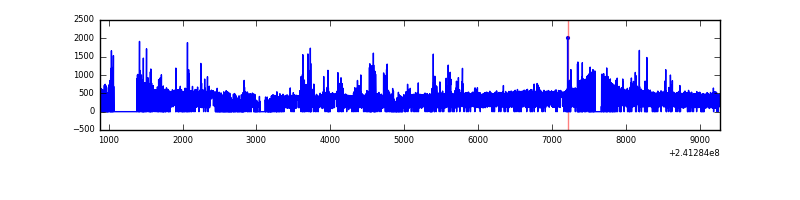 |
| C | 8390 | 7143 | 0 | 0 | 0.00% | 0.00% | 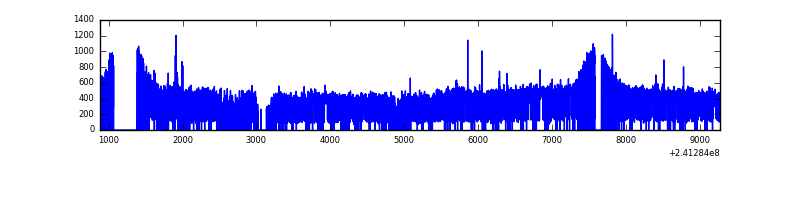 |
| D | 8391 | 7251 | 3 | 3 | 0.04% | 0.04% | 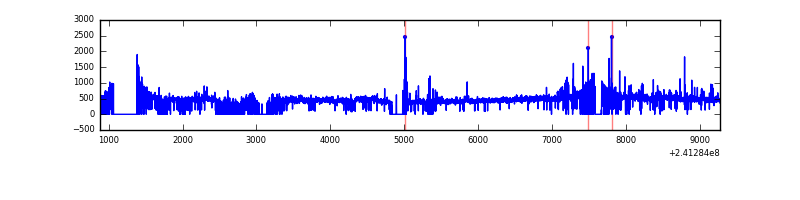 |
Top three noisy pixels from each quadrant. If the there are fewer than three noisy pixels in the level2.evt file, extra rows are filled as -1
| Pixel properties | Quadrant properties | ||||||
|---|---|---|---|---|---|---|---|
| Quadrant | DetID | PixID | Counts | Sigma | Mean | Median | Sigma |
| A | 8 | 15 | 110929 | 760.75 | 704 | 687 | 144.9 |
| A | 8 | 5 | 35771 | 242.1 | 704 | 687 | 144.9 |
| A | 3 | 1 | 9136 | 58.3 | 704 | 687 | 144.9 |
| B | 4 | 239 | 192314 | 1445.15 | 678 | 662 | 132.6 |
| B | 0 | 214 | 27813 | 204.73 | 678 | 662 | 132.6 |
| B | 12 | 111 | 14422 | 103.76 | 678 | 662 | 132.6 |
| C | 4 | 254 | 20286 | 119.52 | 698 | 703 | 163.8 |
| C | 13 | 61 | 5286 | 27.97 | 698 | 703 | 163.8 |
| C | 14 | 255 | 4601 | 23.79 | 698 | 703 | 163.8 |
| D | 8 | 195 | 150894 | 778.71 | 791 | 769 | 192.8 |
| D | 2 | 16 | 77238 | 396.65 | 791 | 769 | 192.8 |
| D | 12 | 233 | 51713 | 264.25 | 791 | 769 | 192.8 |
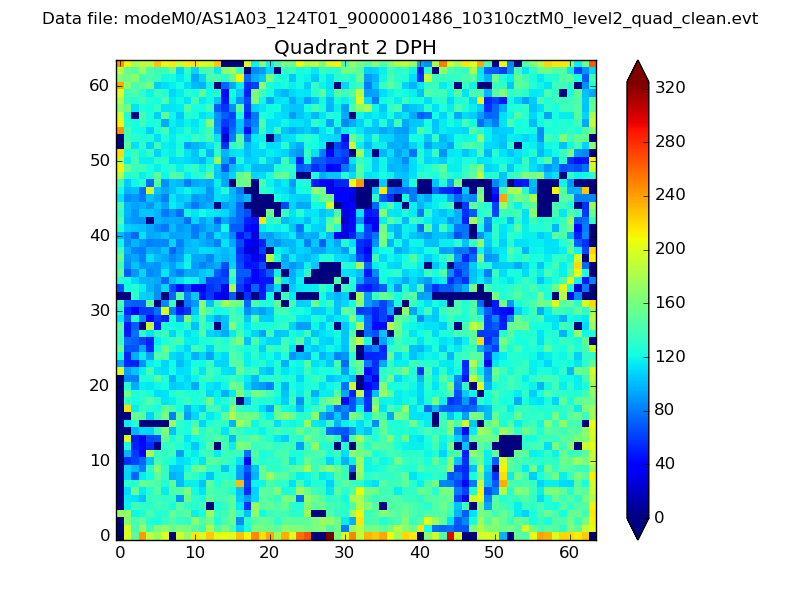
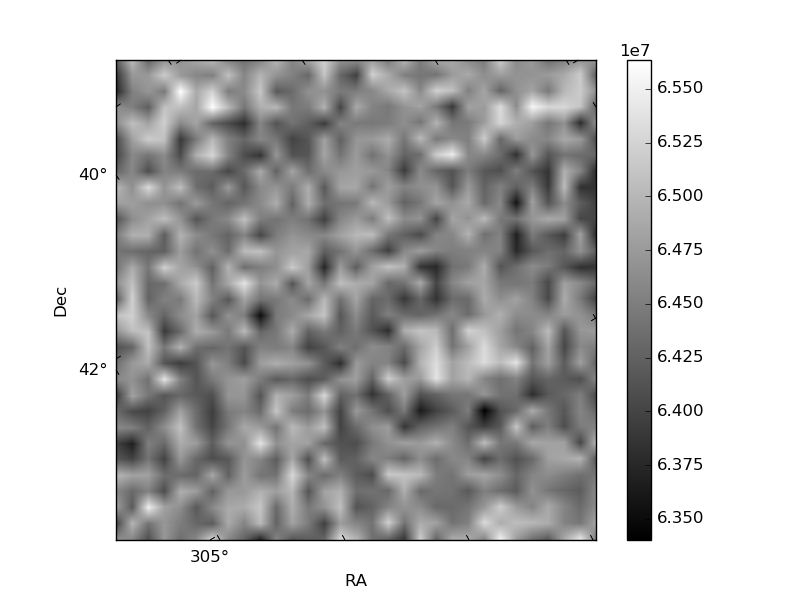
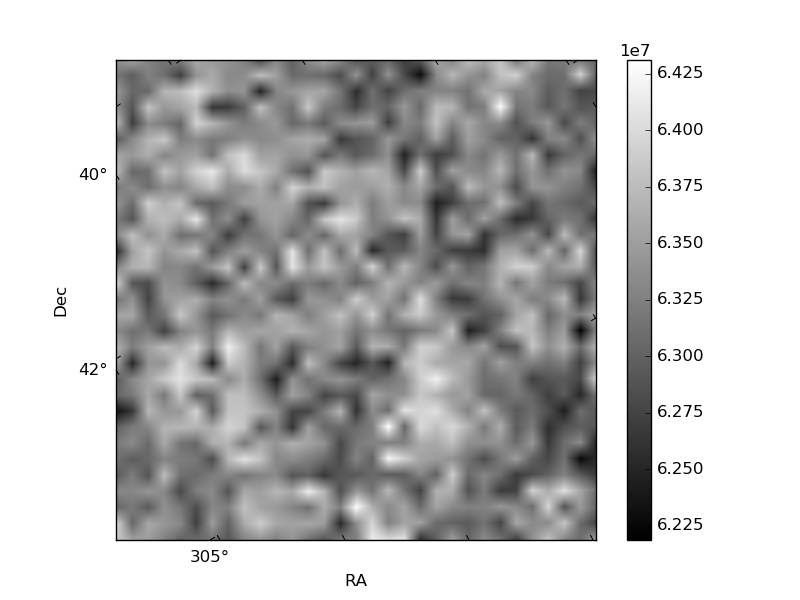
Histogram calculated using DETX and DETY for each event in the final _common_clean file
| Quadrant A | 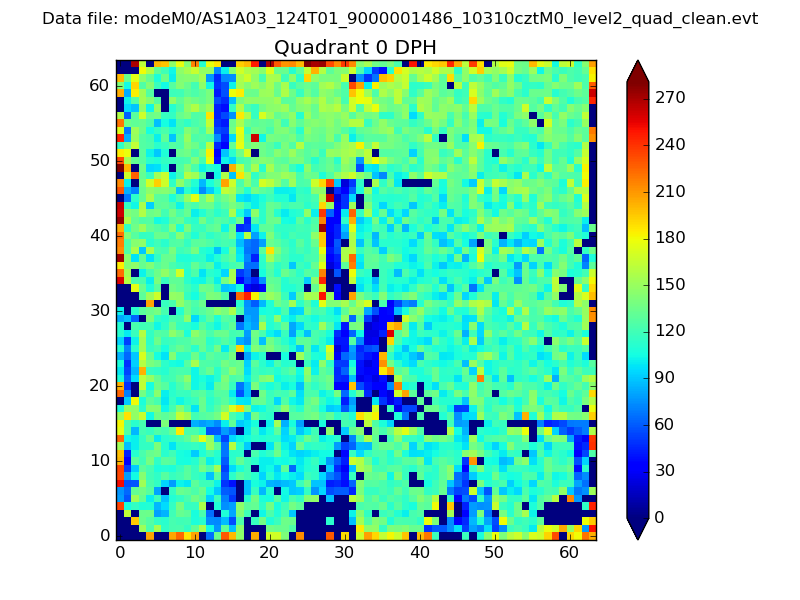 |
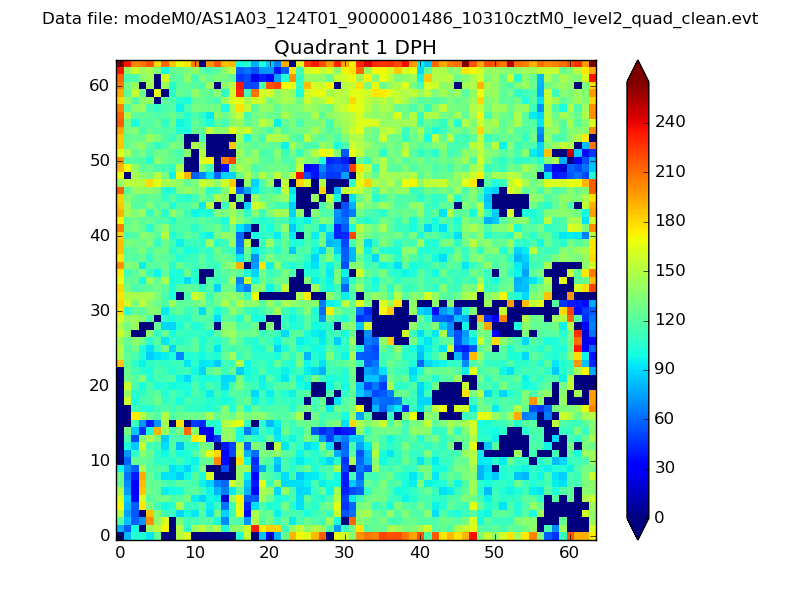 |
Quadrant B |
|---|---|---|---|
| Quadrant D | 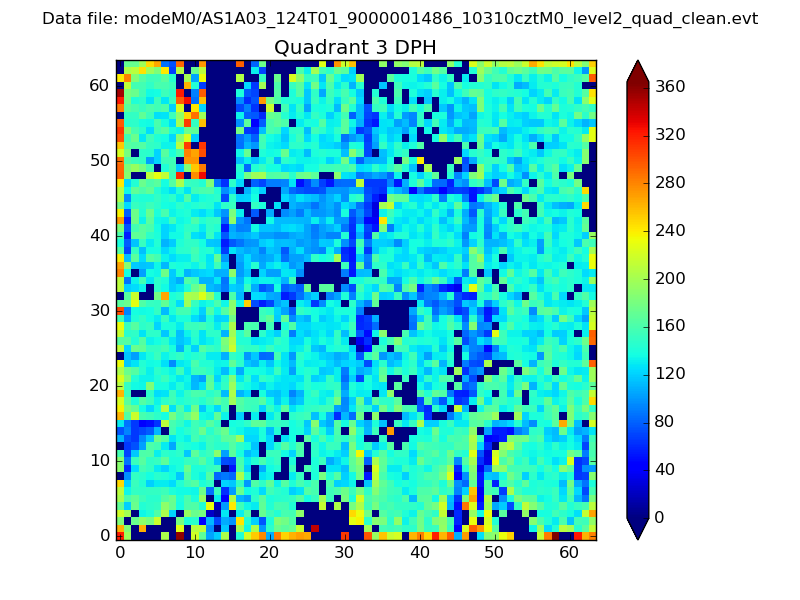 |
 |
Quadrant C |
| Plot type | Count rate plots | Images |
|---|---|---|
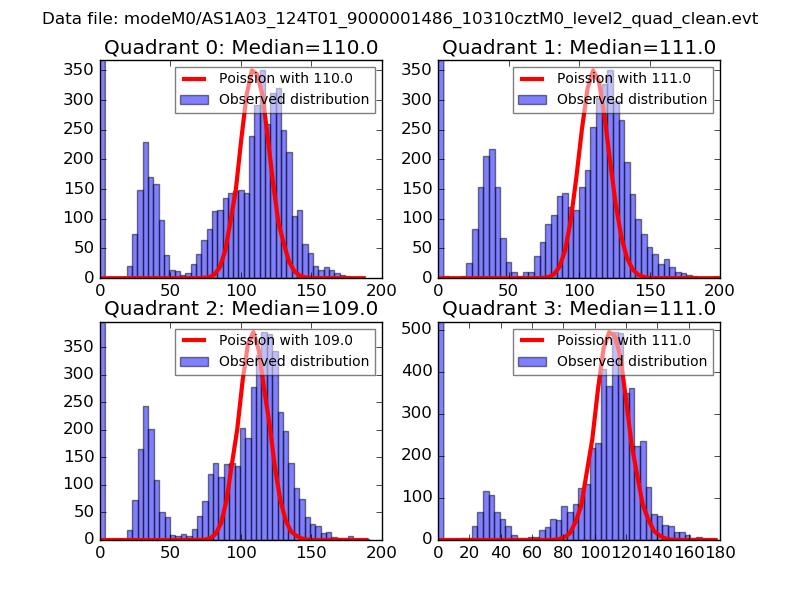
| Comparison with Poisson distribution Blue bars denote a histogram of data divided into 1 sec bins. Red curve is a Poisson curve with rate = median count rate of data. |
 |
 |
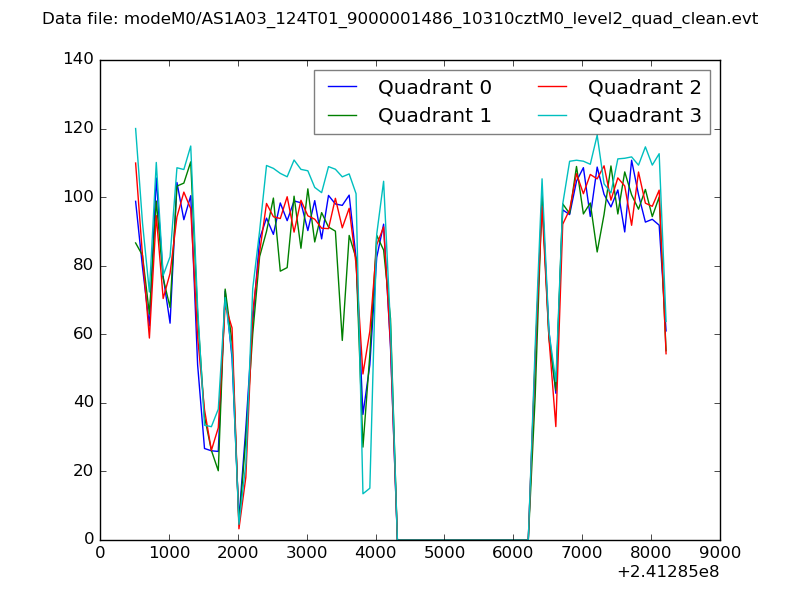
| Quadrant-wise count rates Data is divided into 100 sec bins |
 |
|
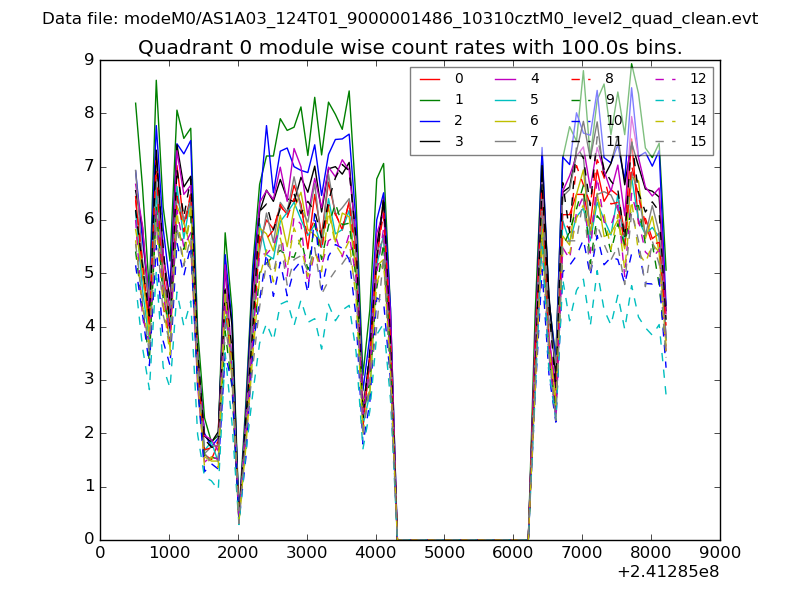
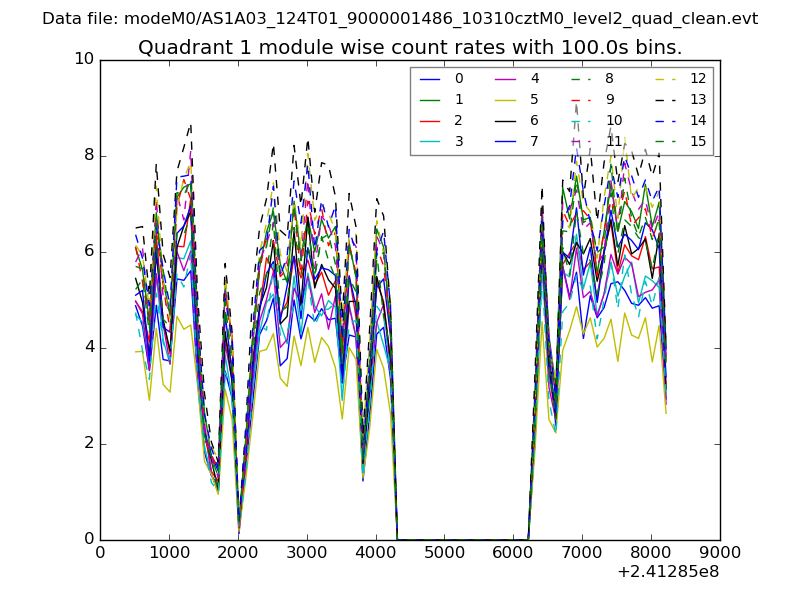
| Module-wise count rates for Quadrant A Data is divided into 100 sec bins |
 |
 |
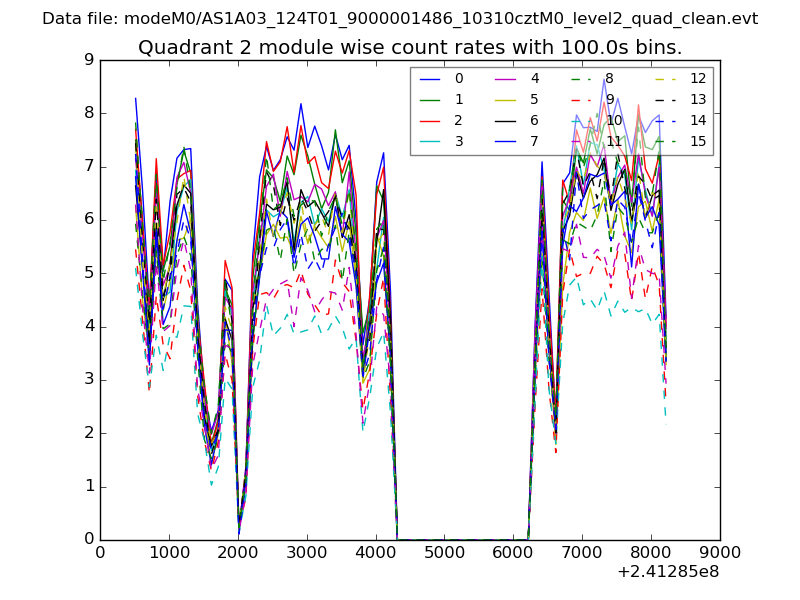
| Module-wise count rates for Quadrant B Data is divided into 100 sec bins |
 |
 |
| Module-wise count rates for Quadrant C Data is divided into 100 sec bins |
 |
 |
| Module-wise count rates for Quadrant D Data is divided into 100 sec bins |
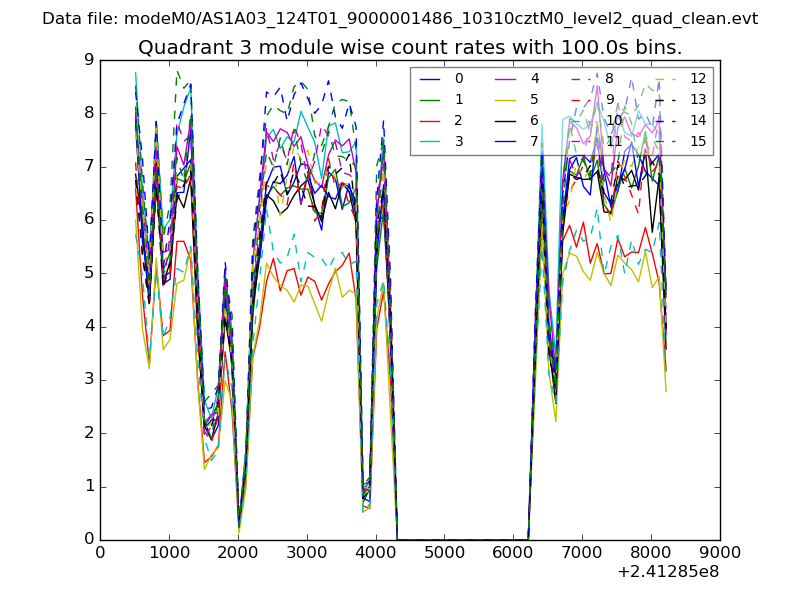 |
 |
| Parameter | Plot |
|---|---|
| CZT HV Monitor | 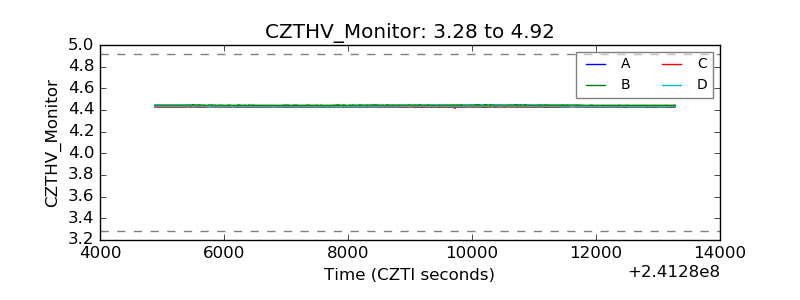 |
| D_VDD | 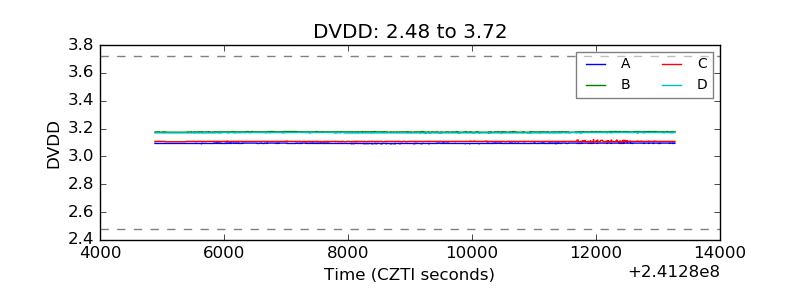 |
| Temperature 1 | 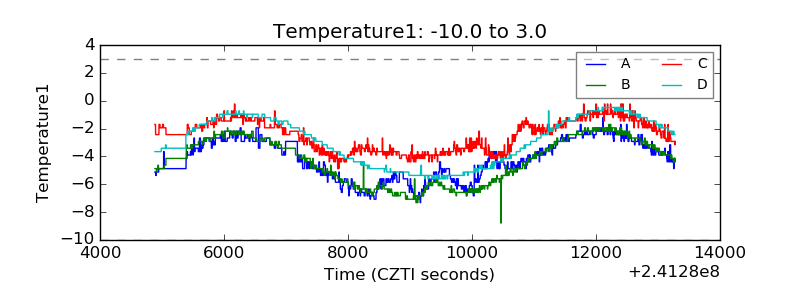 |
| Veto HV Monitor | 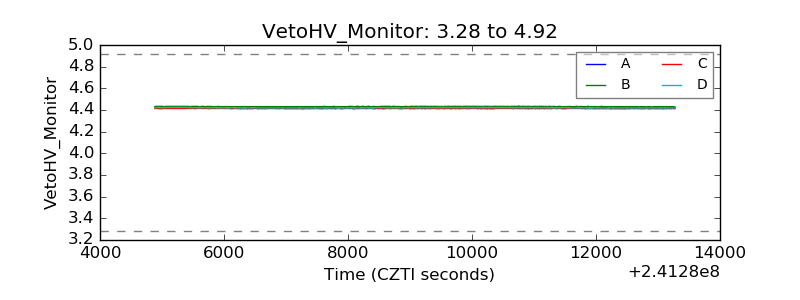 |
| Veto LLD | 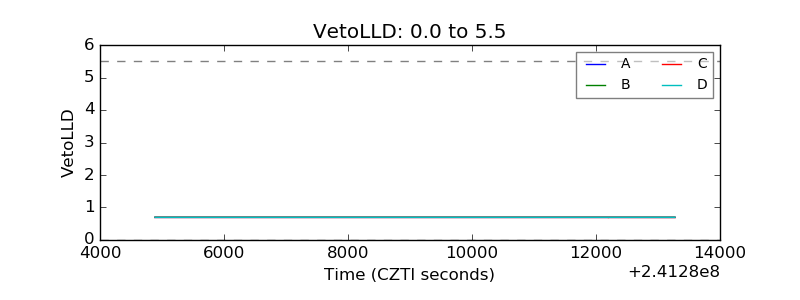 |
| Alpha Counter | 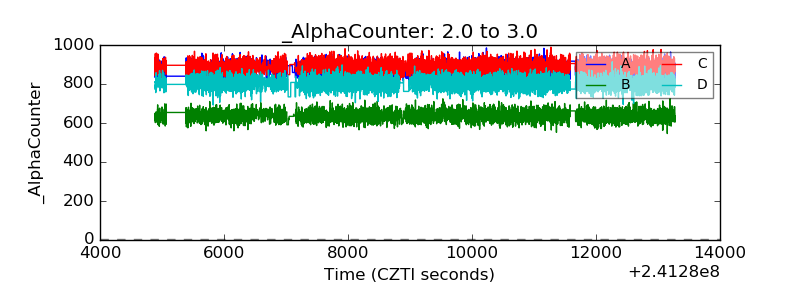 |
| _CPM_Rate | 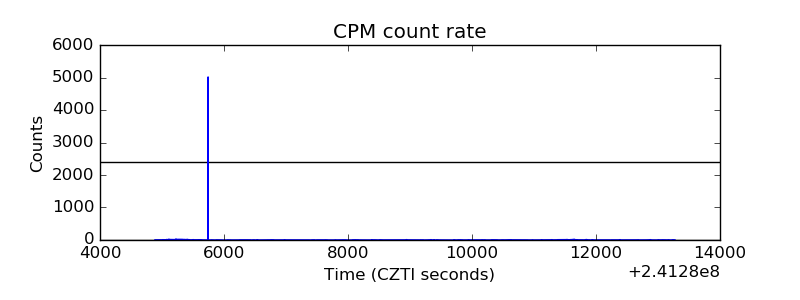 |
| CZT Counter | 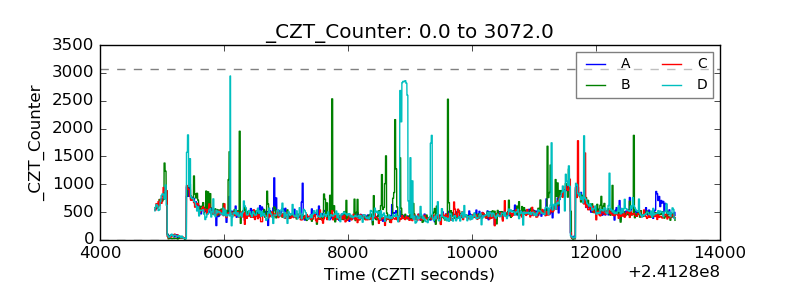 |
| +2.5 Volts monitor |  |
| +5 Volts monitor | 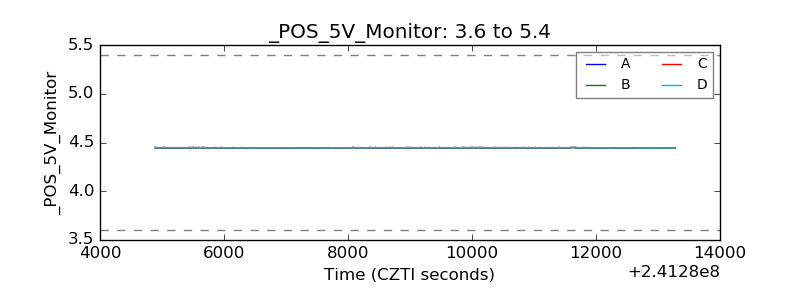 |
| _ROLL_ROT | 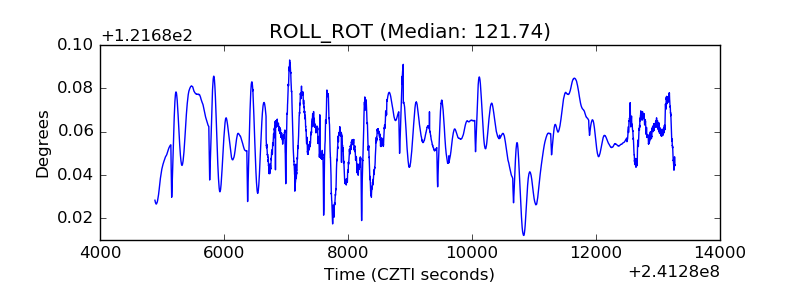 |
| _Roll_DEC | 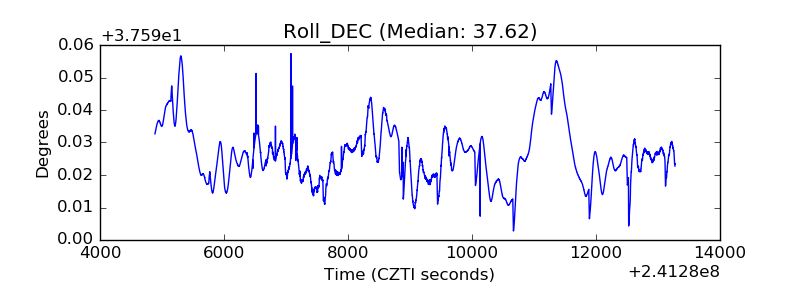 |
| _Roll_RA | 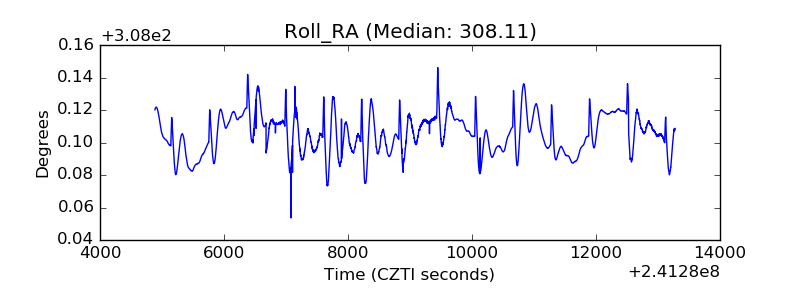 |
| Veto Counter | 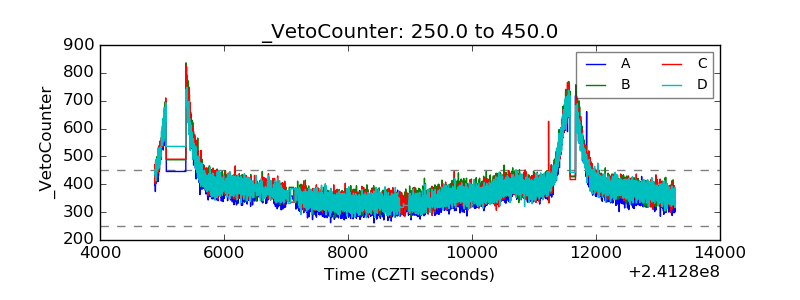 |