| Param | Original file | Final file |
|---|---|---|
| Filename | modeM0/AS1A03_124T01_9000001486_10314cztM0_level2.evt | modeM0/AS1A03_124T01_9000001486_10314cztM0_level2_quad_clean.evt |
| Size (bytes) | 396,915,840 | 79,441,920 |
| Size | 378.5 MB | 75.8 MB |
| Events in quadrant A | 2,761,988 | 498,808 |
| Events in quadrant B | 2,791,655 | 467,800 |
| Events in quadrant C | 2,605,624 | 507,546 |
| Events in quadrant D | 3,459,558 | 520,208 |
| Mode M0 | |||
|---|---|---|---|
| Quadrant | BADHDUFLAG | Total packets | Discarded packets |
| A | 0 | 29075 | 17041 |
| B | 0 | 34533 | 22679 |
| C | 0 | 29088 | 17163 |
| D | 0 | 34475 | 19896 |
| Mode M9 | |||
|---|---|---|---|
| Quadrant | BADHDUFLAG | Total packets | Discarded packets |
| A | 0 | 29 | 14 |
| B | 0 | 30 | 15 |
| C | 0 | 30 | 15 |
| D | 0 | 30 | 15 |
| Mode SS | |||
|---|---|---|---|
| Quadrant | BADHDUFLAG | Total packets | Discarded packets |
| A | 0 | 298 | 163 |
| B | 0 | 297 | 168 |
| C | 0 | 298 | 167 |
| D | 0 | 286 | 154 |
| Quadrant | Total seconds | Saturated seconds | Saturation percentage |
|---|---|---|---|
| A | 5776 | 25 | 0.432825% |
| B | 5436 | 34 | 0.625460% |
| C | 5891 | 14 | 0.237651% |
| D | 6373 | 47 | 0.737486% |
Noise dominated data is calculated using 1-second bins in cleaned event files. If a bin has >2000 counts, and if more than 50% of those come from <1% of pixels, then it is considered to be noise-dominated and hence unusable.
| Quadrant | # 1 sec bins | Bins with >0 counts | Bins with >2000 counts | High rate bins dominated by noise | Noise dominated (total time) | Noise dominated (detector-on time) | Marked lightcurve |
|---|---|---|---|---|---|---|---|
| A | 8779 | 6882 | 0 | 0 | 0.00% | 0.00% | 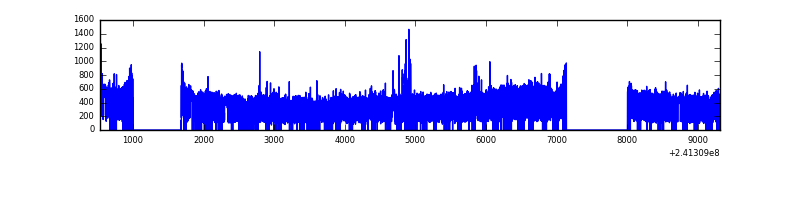 |
| B | 8780 | 6553 | 1 | 1 | 0.01% | 0.02% | 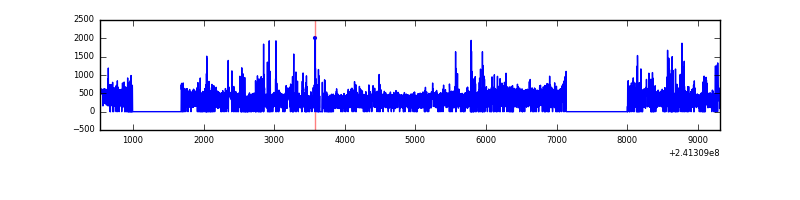 |
| C | 8780 | 6942 | 0 | 0 | 0.00% | 0.00% | 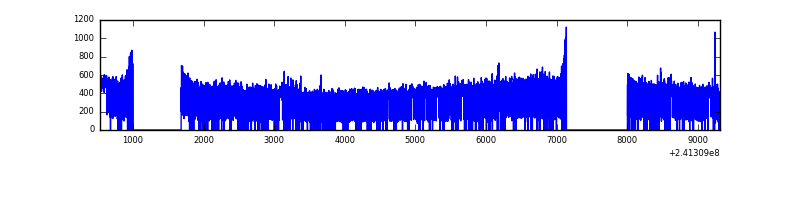 |
| D | 8780 | 6904 | 6 | 6 | 0.07% | 0.09% | 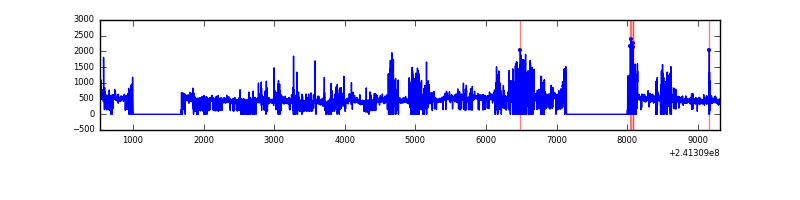 |
Top three noisy pixels from each quadrant. If the there are fewer than three noisy pixels in the level2.evt file, extra rows are filled as -1
| Pixel properties | Quadrant properties | ||||||
|---|---|---|---|---|---|---|---|
| Quadrant | DetID | PixID | Counts | Sigma | Mean | Median | Sigma |
| A | 8 | 15 | 99045 | 719.8 | 664 | 651 | 136.7 |
| A | 8 | 5 | 81921 | 594.53 | 664 | 651 | 136.7 |
| A | 3 | 1 | 13769 | 95.96 | 664 | 651 | 136.7 |
| B | 4 | 239 | 270703 | 2215.2 | 629 | 615 | 121.9 |
| B | 0 | 214 | 35019 | 282.17 | 629 | 615 | 121.9 |
| B | 11 | 51 | 20661 | 164.41 | 629 | 615 | 121.9 |
| C | 14 | 234 | 10913 | 65.85 | 665 | 669 | 155.6 |
| C | 13 | 61 | 4880 | 27.07 | 665 | 669 | 155.6 |
| C | 8 | 222 | 2053 | 8.9 | 665 | 669 | 155.6 |
| D | 1 | 52 | 500531 | 2895.16 | 708 | 687 | 172.6 |
| D | 8 | 195 | 143668 | 828.17 | 708 | 687 | 172.6 |
| D | 2 | 14 | 45645 | 260.4 | 708 | 687 | 172.6 |
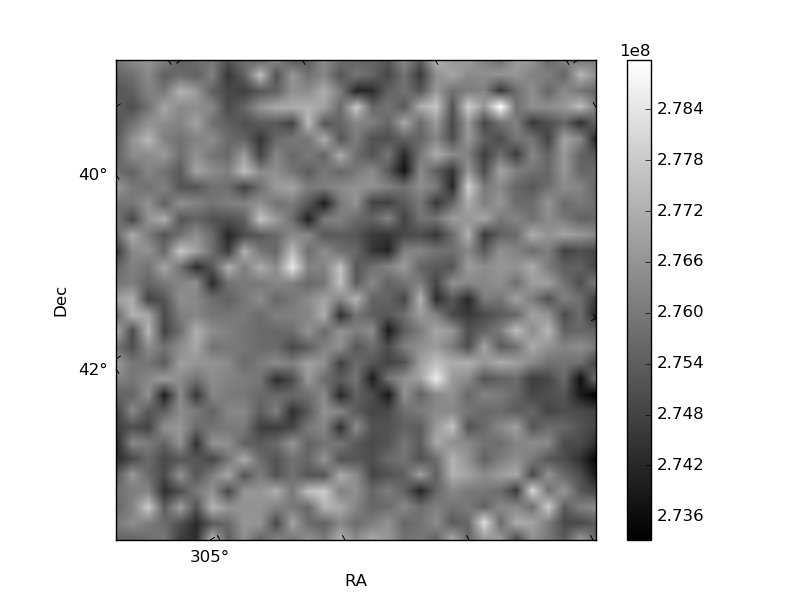
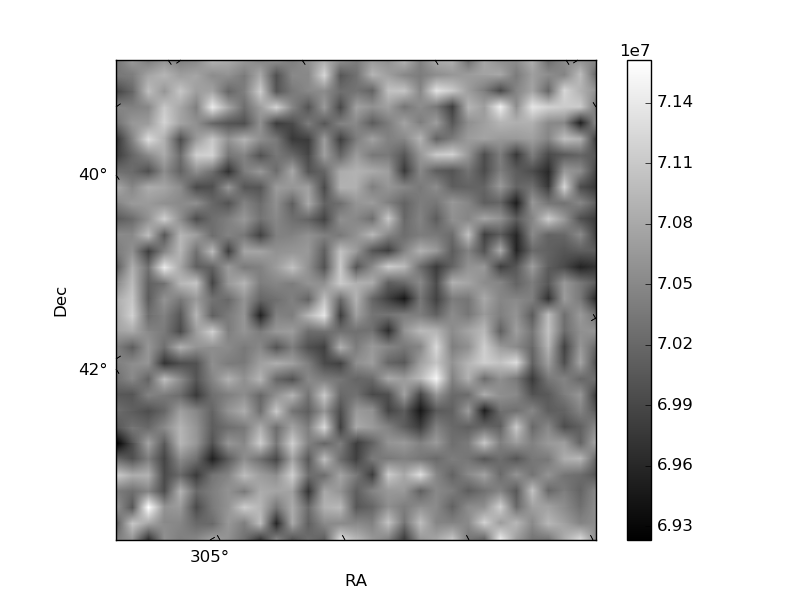
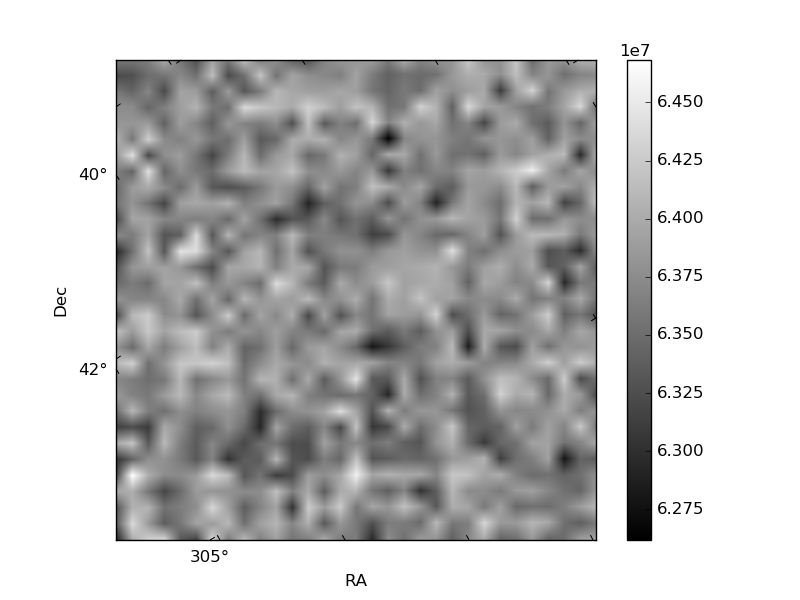
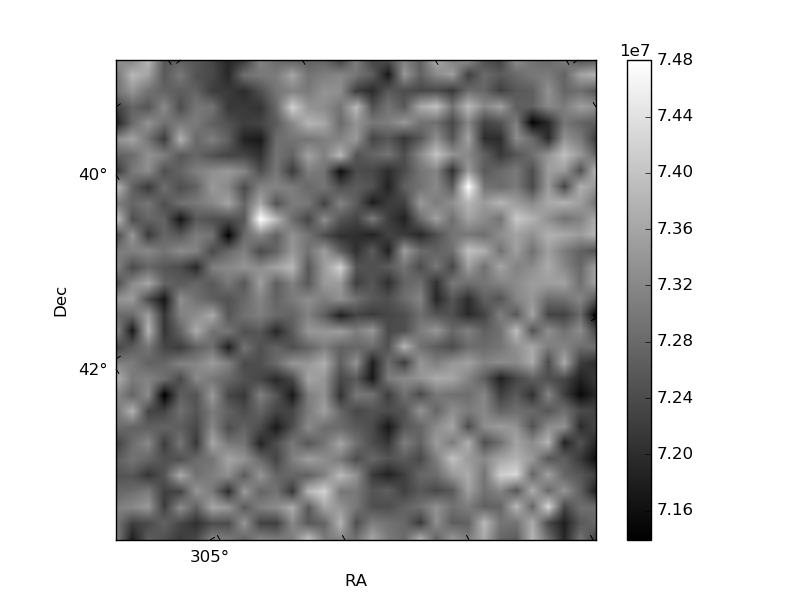
Histogram calculated using DETX and DETY for each event in the final _common_clean file
| Quadrant A | 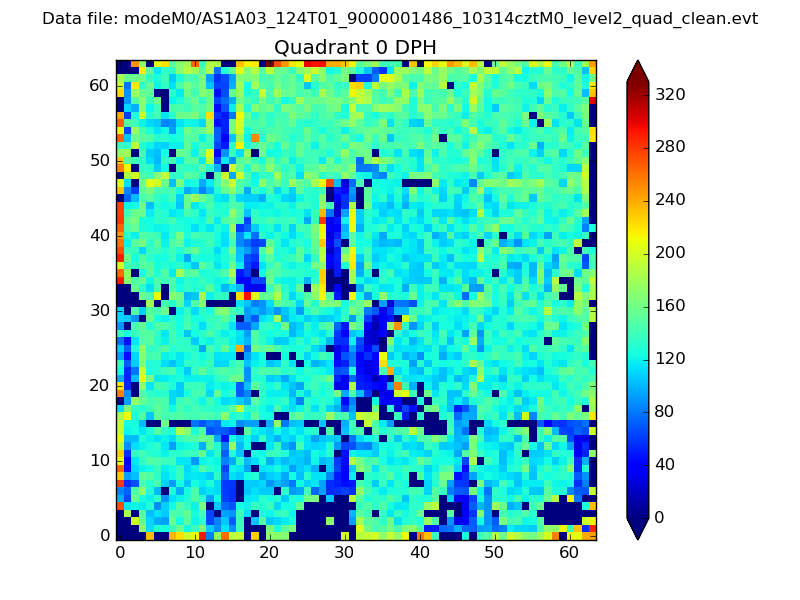 |
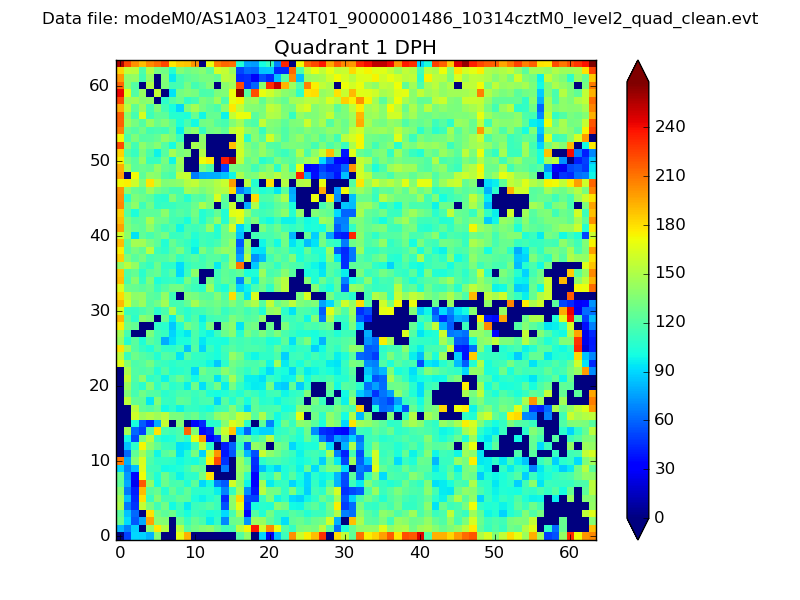 |
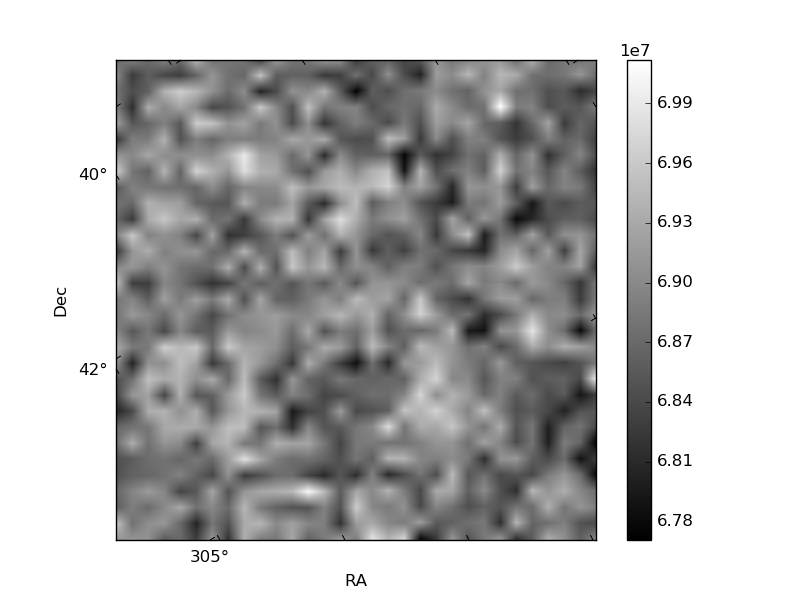
Quadrant B |
|---|---|---|---|
| Quadrant D | 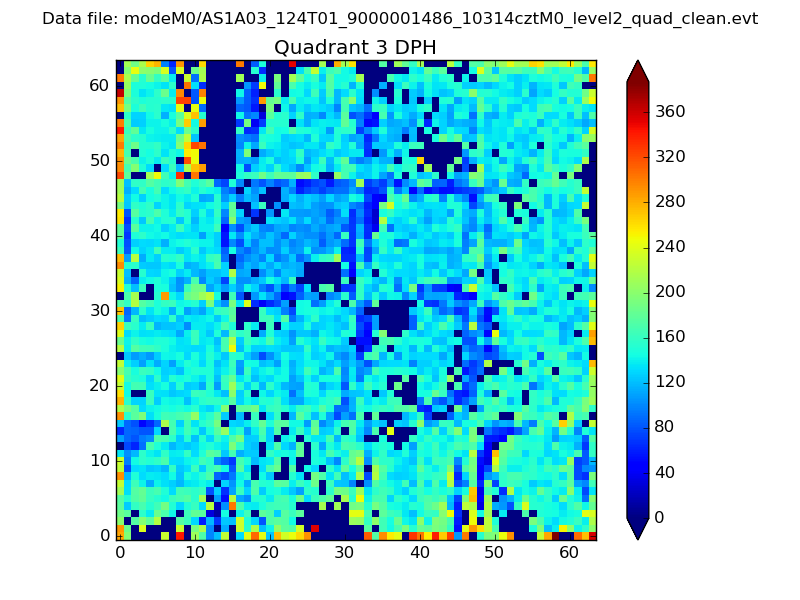 |
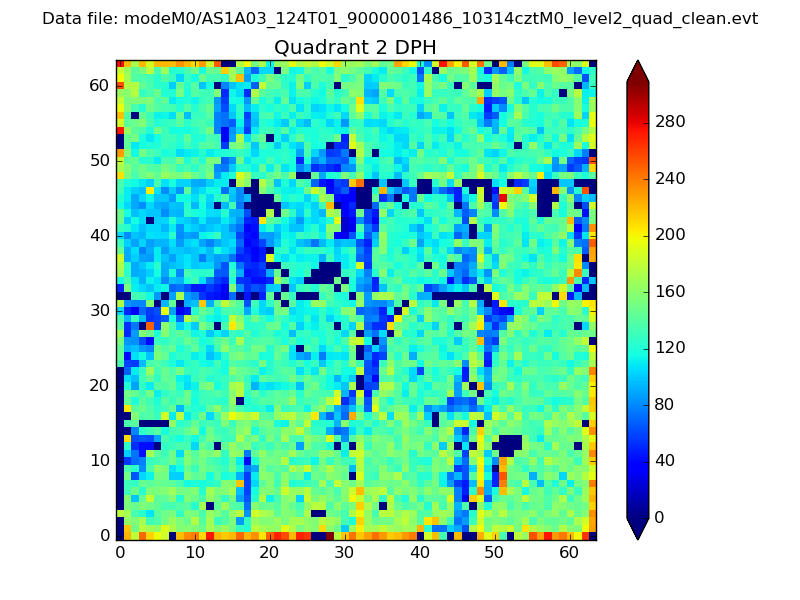 |
Quadrant C |
| Plot type | Count rate plots | Images |
|---|---|---|
| Comparison with Poisson distribution Blue bars denote a histogram of data divided into 1 sec bins. Red curve is a Poisson curve with rate = median count rate of data. |
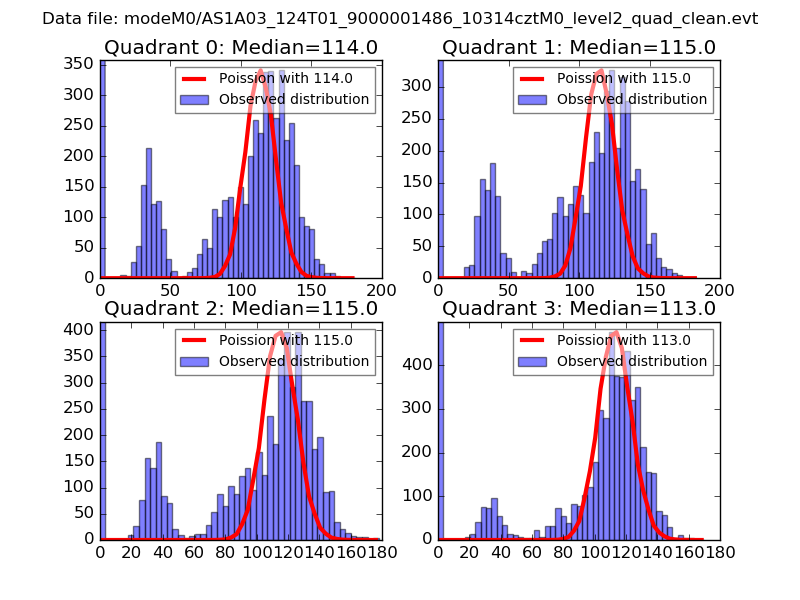 |
 |
| Quadrant-wise count rates Data is divided into 100 sec bins |
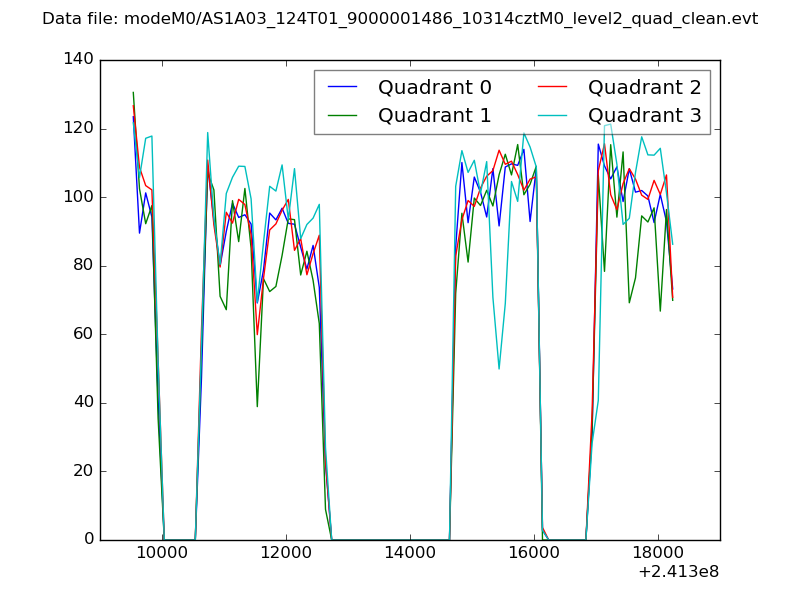 |
|
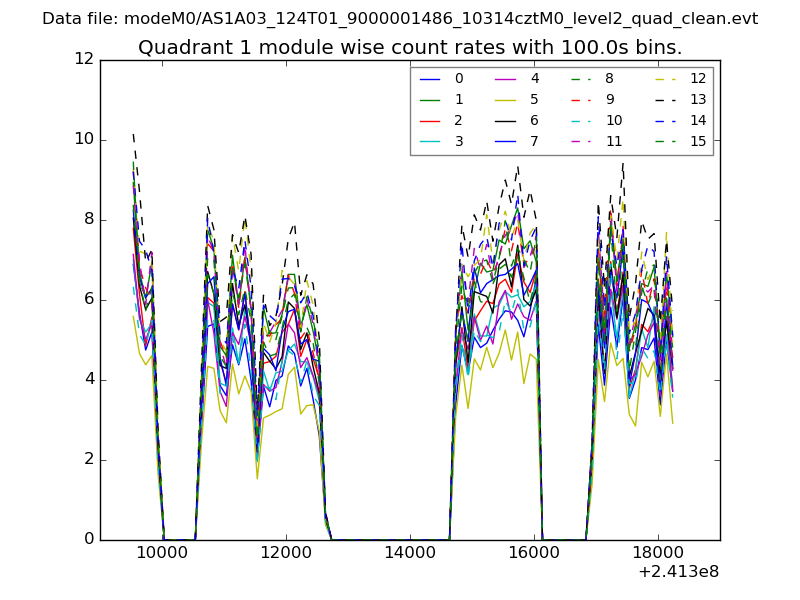
| Module-wise count rates for Quadrant A Data is divided into 100 sec bins |
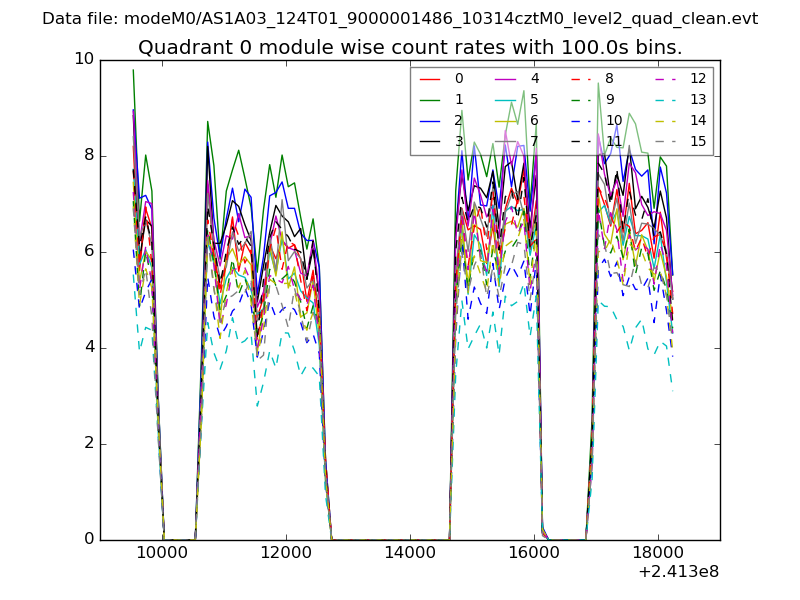 |
 |
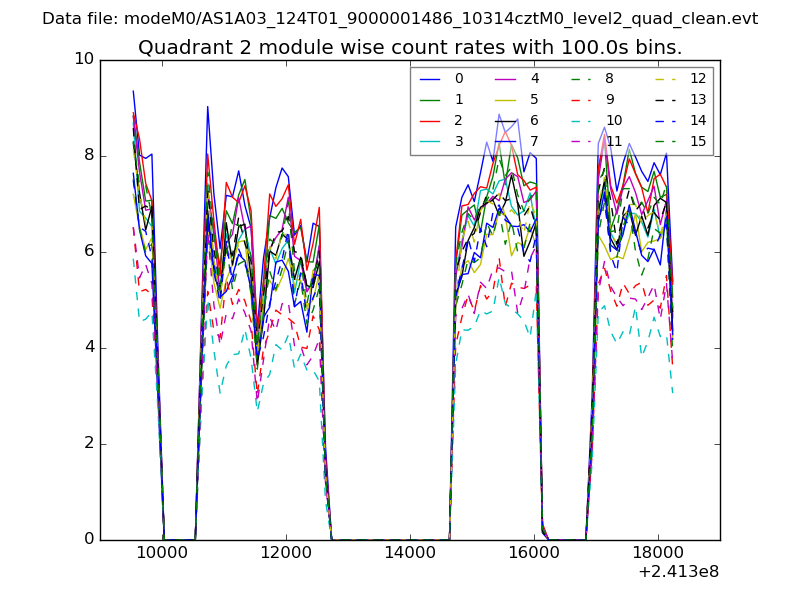
| Module-wise count rates for Quadrant B Data is divided into 100 sec bins |
 |
 |
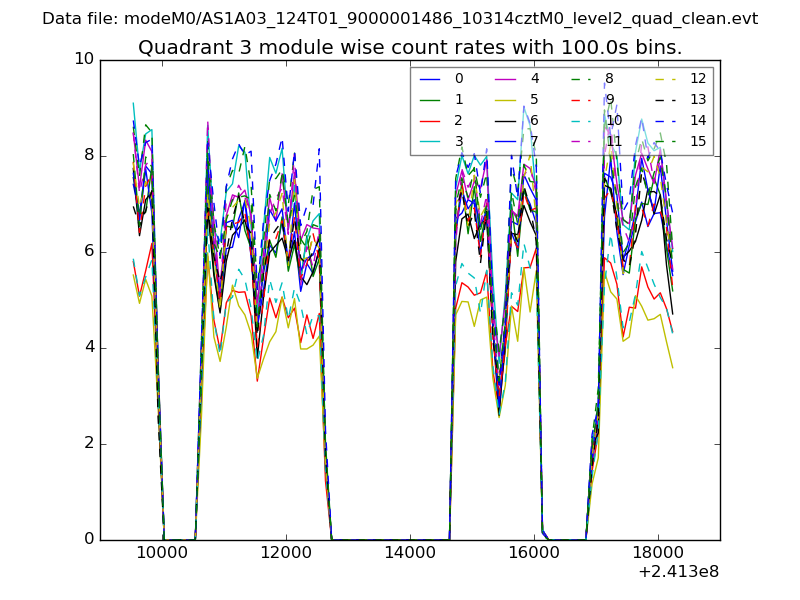
| Module-wise count rates for Quadrant C Data is divided into 100 sec bins |
 |
 |
| Module-wise count rates for Quadrant D Data is divided into 100 sec bins |
 |
 |
| Parameter | Plot |
|---|---|
| CZT HV Monitor | 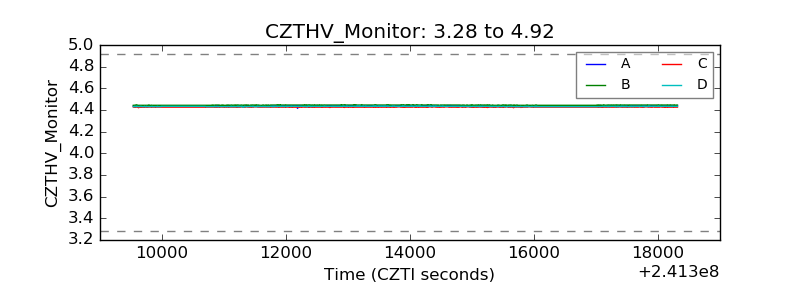 |
| D_VDD | 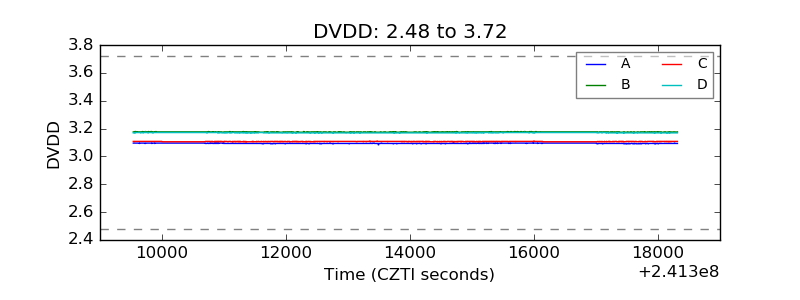 |
| Temperature 1 | 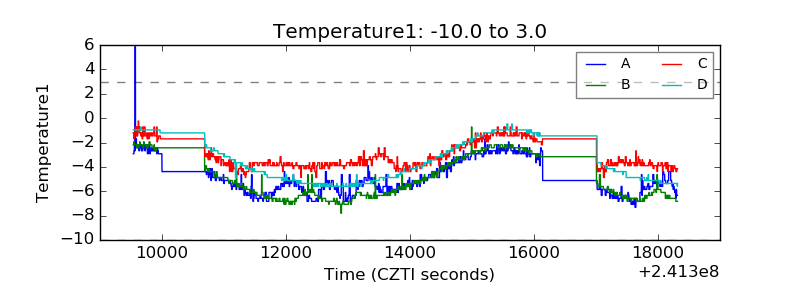 |
| Veto HV Monitor | 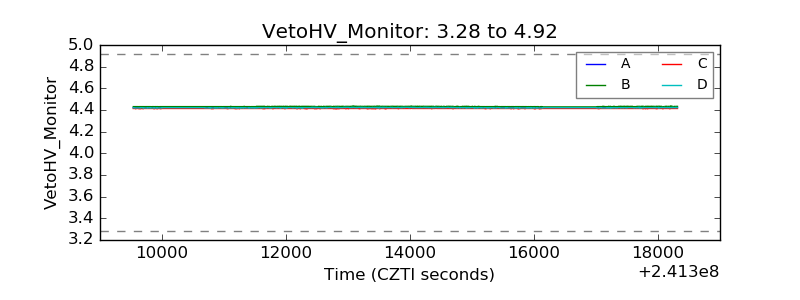 |
| Veto LLD | 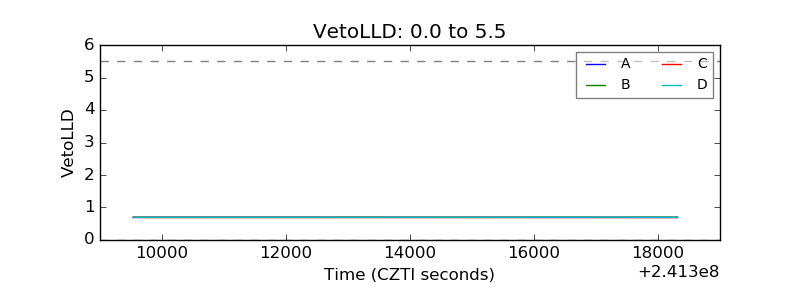 |
| Alpha Counter | 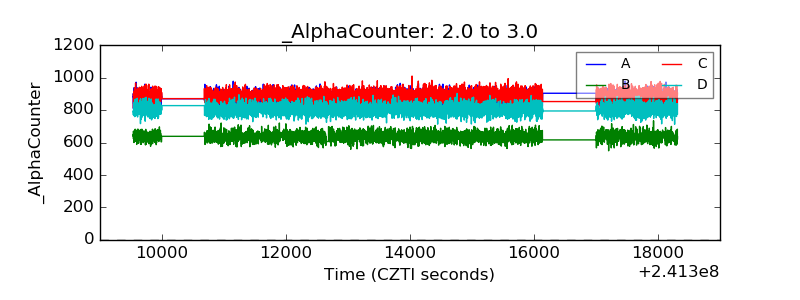 |
| _CPM_Rate | 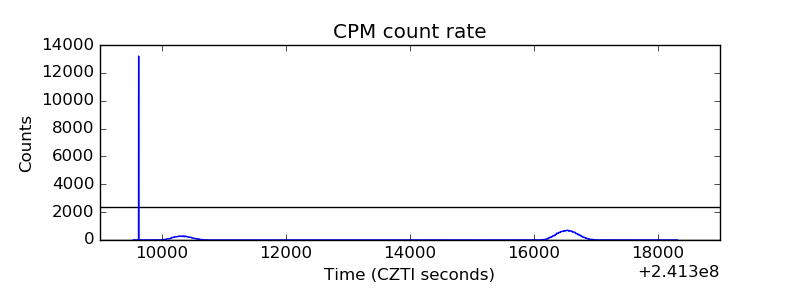 |
| CZT Counter | 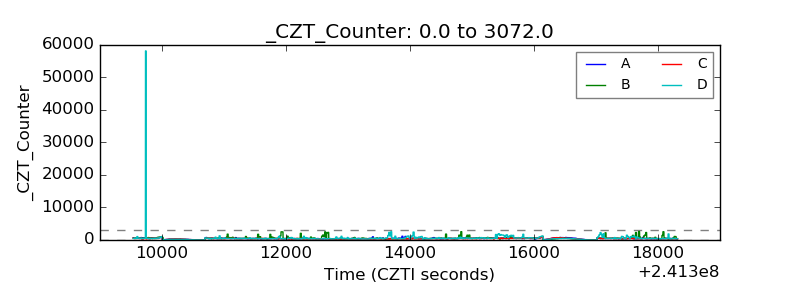 |
| +2.5 Volts monitor |  |
| +5 Volts monitor | 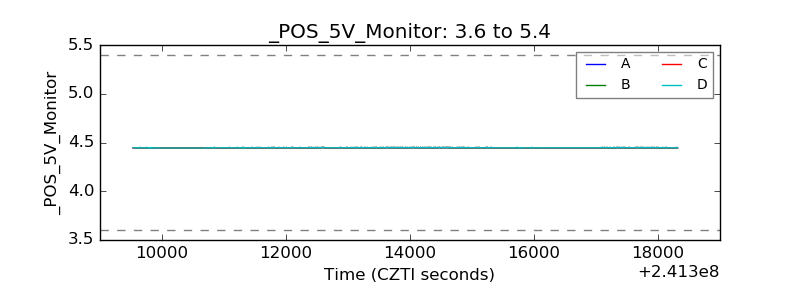 |
| _ROLL_ROT | 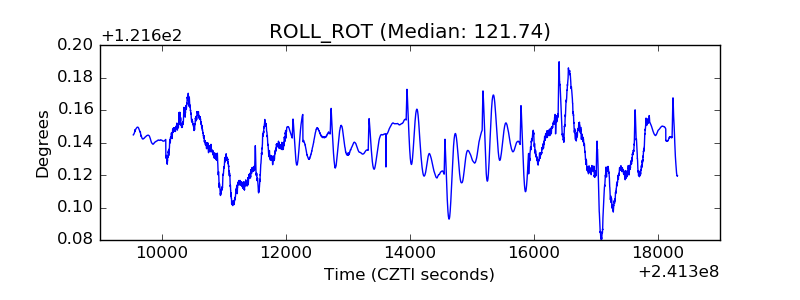 |
| _Roll_DEC | 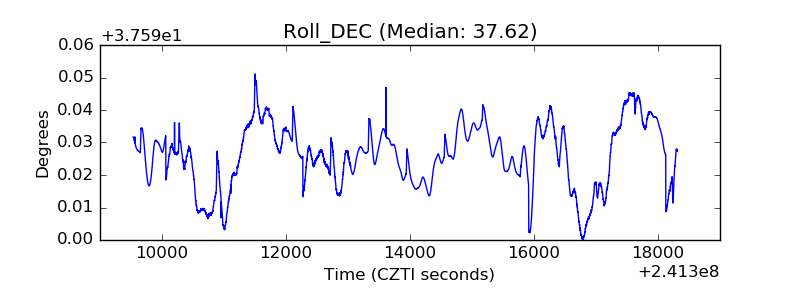 |
| _Roll_RA | 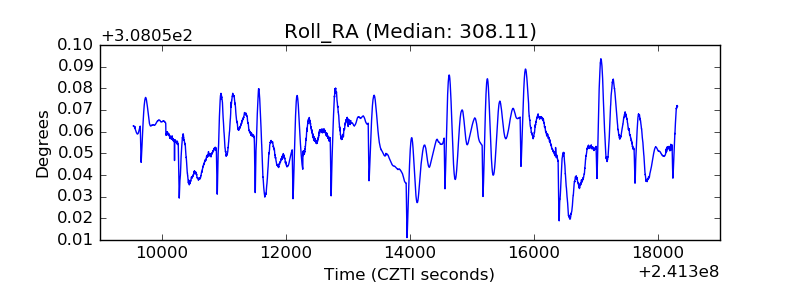 |
| Veto Counter | 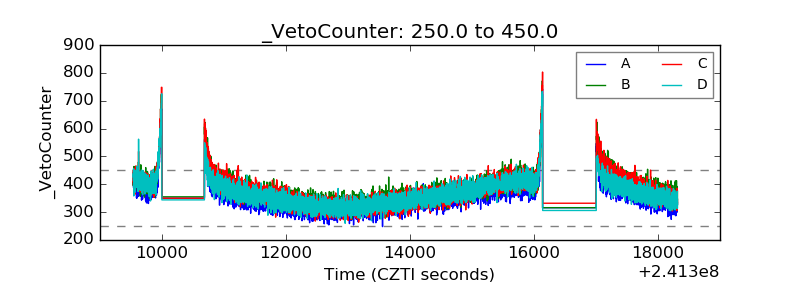 |