| Param | Original file | Final file |
|---|---|---|
| Filename | modeM0/AS1A03_124T01_9000001486_10315cztM0_level2.evt | modeM0/AS1A03_124T01_9000001486_10315cztM0_level2_quad_clean.evt |
| Size (bytes) | 1,526,135,040 | 275,630,400 |
| Size | 1.4 GB | 262.9 MB |
| Events in quadrant A | 10,861,464 | 1,719,599 |
| Events in quadrant B | 11,927,420 | 1,687,049 |
| Events in quadrant C | 9,735,940 | 1,712,880 |
| Events in quadrant D | 12,177,722 | 1,685,653 |
| Mode M0 | |||
|---|---|---|---|
| Quadrant | BADHDUFLAG | Total packets | Discarded packets |
| A | 0 | 61660 | 14570 |
| B | 0 | 71243 | 20809 |
| C | 0 | 60626 | 15451 |
| D | 0 | 67442 | 15409 |
| Mode M9 | |||
|---|---|---|---|
| Quadrant | BADHDUFLAG | Total packets | Discarded packets |
| A | 0 | 43 | 12 |
| B | 0 | 48 | 17 |
| C | 0 | 48 | 17 |
| D | 0 | 46 | 15 |
| Mode SS | |||
|---|---|---|---|
| Quadrant | BADHDUFLAG | Total packets | Discarded packets |
| A | 0 | 608 | 141 |
| B | 0 | 608 | 141 |
| C | 0 | 608 | 140 |
| D | 0 | 598 | 132 |
| Quadrant | Total seconds | Saturated seconds | Saturation percentage |
|---|---|---|---|
| A | 22292 | 90 | 0.403732% |
| B | 21889 | 425 | 1.941615% |
| C | 22324 | 37 | 0.165741% |
| D | 23092 | 197 | 0.853109% |
Noise dominated data is calculated using 1-second bins in cleaned event files. If a bin has >2000 counts, and if more than 50% of those come from <1% of pixels, then it is considered to be noise-dominated and hence unusable.
| Quadrant | # 1 sec bins | Bins with >0 counts | Bins with >2000 counts | High rate bins dominated by noise | Noise dominated (total time) | Noise dominated (detector-on time) | Marked lightcurve |
|---|---|---|---|---|---|---|---|
| A | 26564 | 23273 | 17 | 17 | 0.06% | 0.07% |  |
| B | 26564 | 22930 | 268 | 268 | 1.01% | 1.17% |  |
| C | 26564 | 23254 | 2 | 2 | 0.01% | 0.01% |  |
| D | 26564 | 23336 | 117 | 117 | 0.44% | 0.50% |  |
Top three noisy pixels from each quadrant. If the there are fewer than three noisy pixels in the level2.evt file, extra rows are filled as -1
| Pixel properties | Quadrant properties | ||||||
|---|---|---|---|---|---|---|---|
| Quadrant | DetID | PixID | Counts | Sigma | Mean | Median | Sigma |
| A | 8 | 15 | 563670 | 1093.94 | 2545 | 2486 | 513.0 |
| A | 8 | 5 | 386841 | 749.24 | 2545 | 2486 | 513.0 |
| A | 13 | 251 | 53560 | 99.56 | 2545 | 2486 | 513.0 |
| B | 4 | 239 | 1845515 | 3875.45 | 2496 | 2435 | 475.6 |
| B | 11 | 51 | 150927 | 312.23 | 2496 | 2435 | 475.6 |
| B | 0 | 214 | 123102 | 253.73 | 2496 | 2435 | 475.6 |
| C | 14 | 234 | 34496 | 55.81 | 2482 | 2493 | 573.4 |
| C | 4 | 254 | 21102 | 32.45 | 2482 | 2493 | 573.4 |
| C | 13 | 61 | 18526 | 27.96 | 2482 | 2493 | 573.4 |
| D | 1 | 52 | 1029307 | 1680.35 | 2544 | 2472 | 611.1 |
| D | 8 | 195 | 681251 | 1110.78 | 2544 | 2472 | 611.1 |
| D | 12 | 233 | 211909 | 342.73 | 2544 | 2472 | 611.1 |
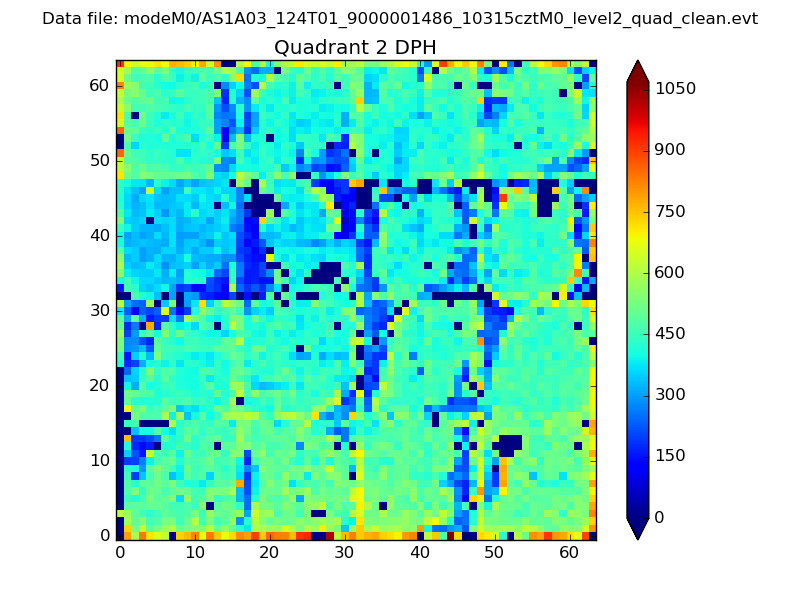
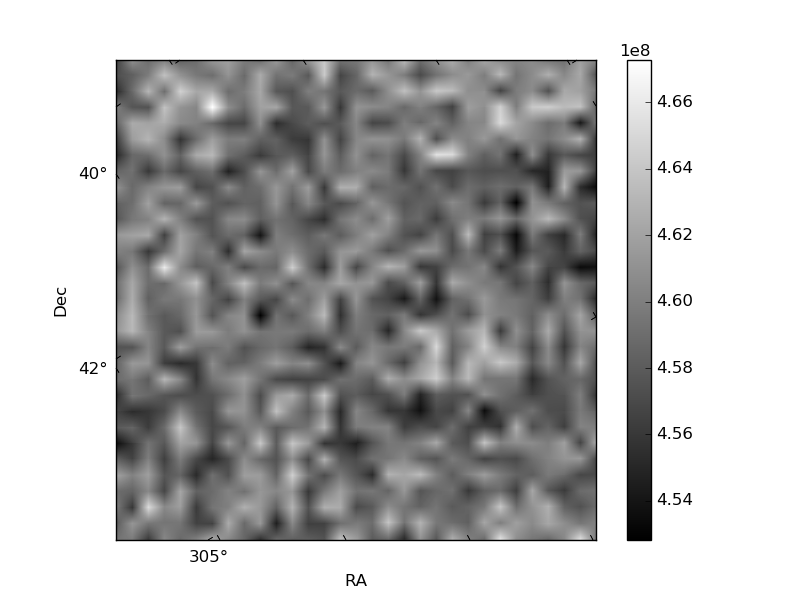
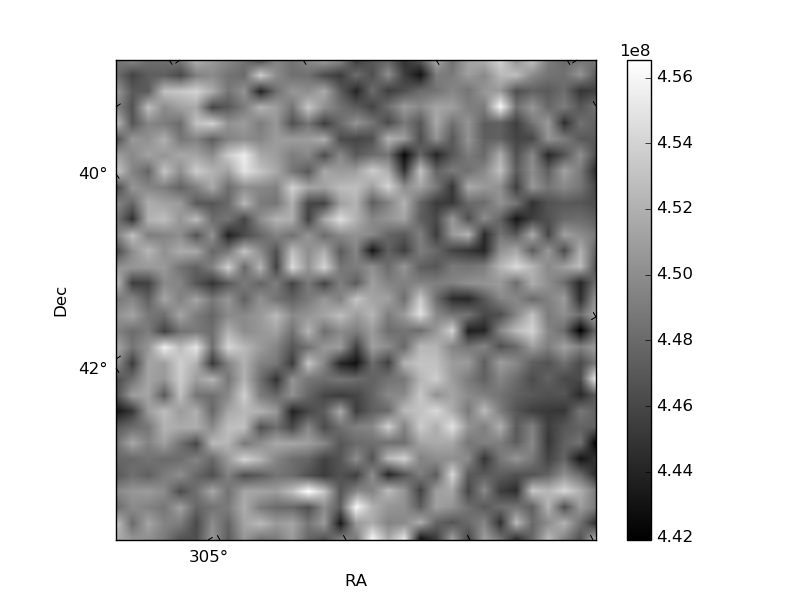
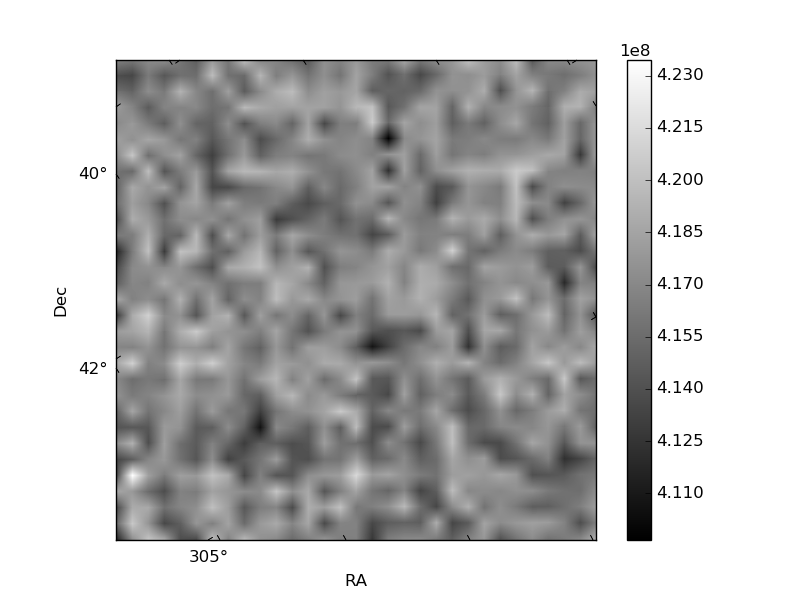
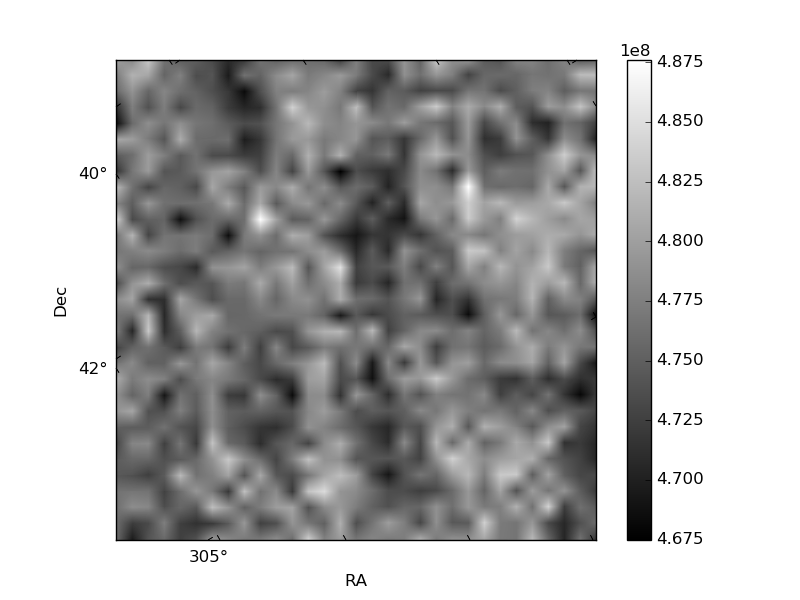
Histogram calculated using DETX and DETY for each event in the final _common_clean file
| Quadrant A | 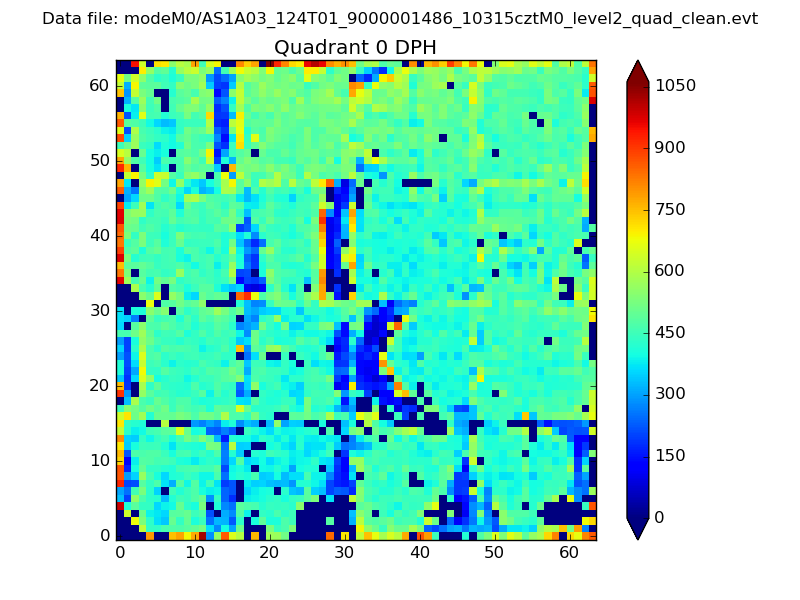 |
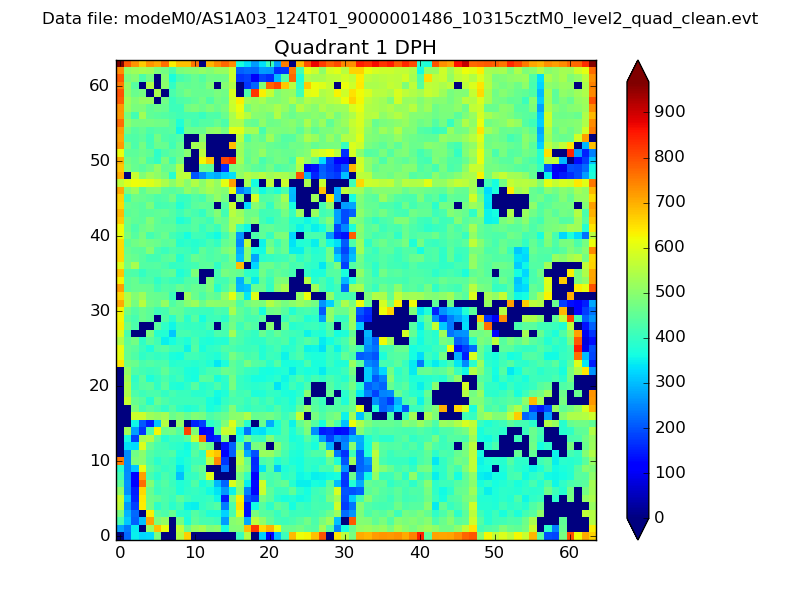 |
Quadrant B |
|---|---|---|---|
| Quadrant D | 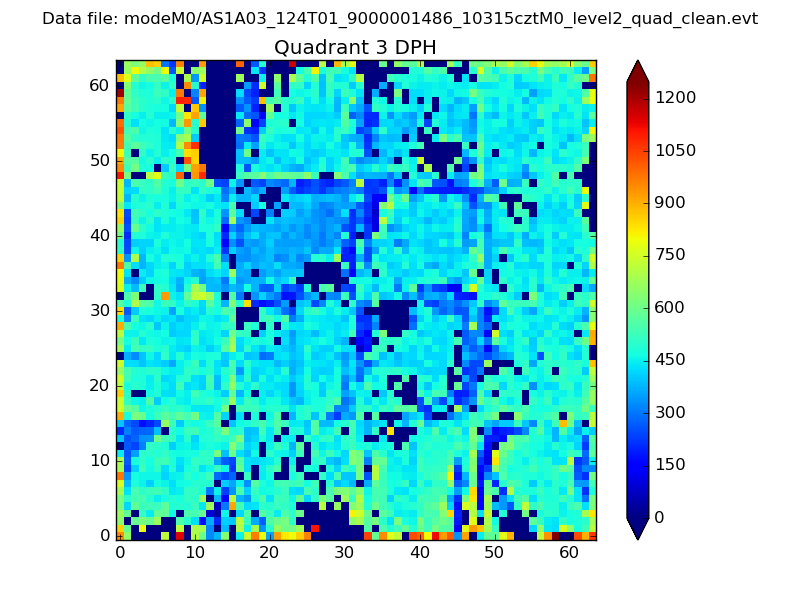 |
 |
Quadrant C |
| Plot type | Count rate plots | Images |
|---|---|---|
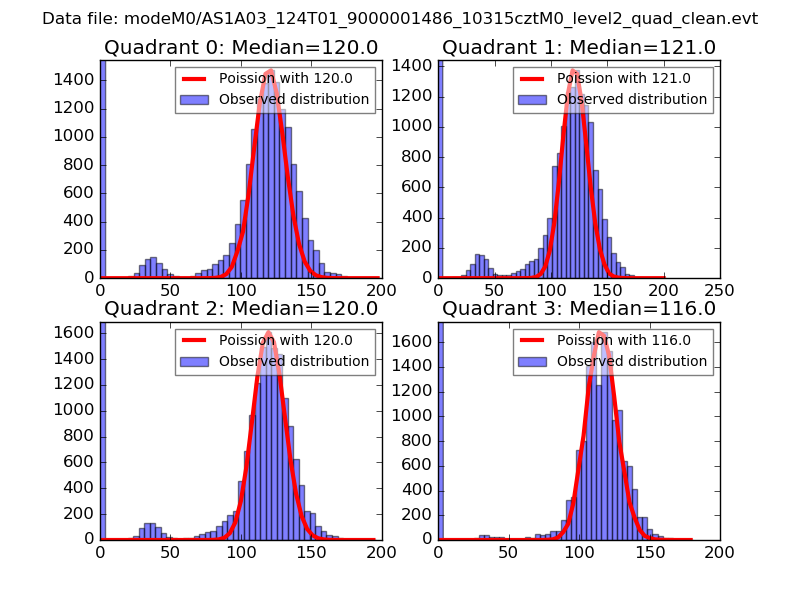
| Comparison with Poisson distribution Blue bars denote a histogram of data divided into 1 sec bins. Red curve is a Poisson curve with rate = median count rate of data. |
 |
 |
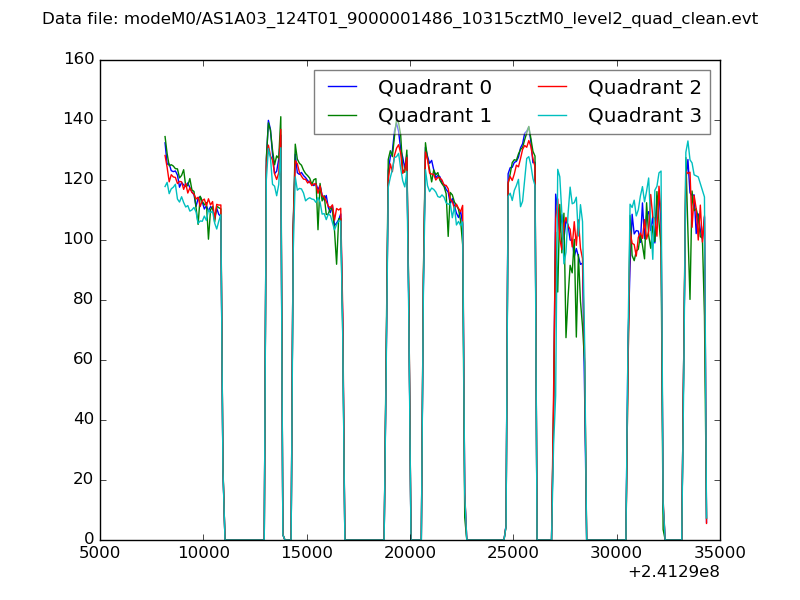
| Quadrant-wise count rates Data is divided into 100 sec bins |
 |
|
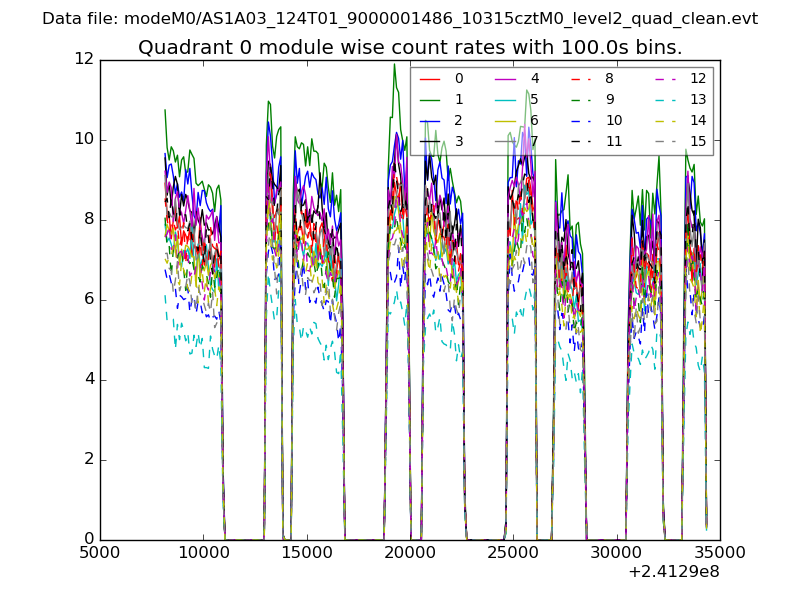
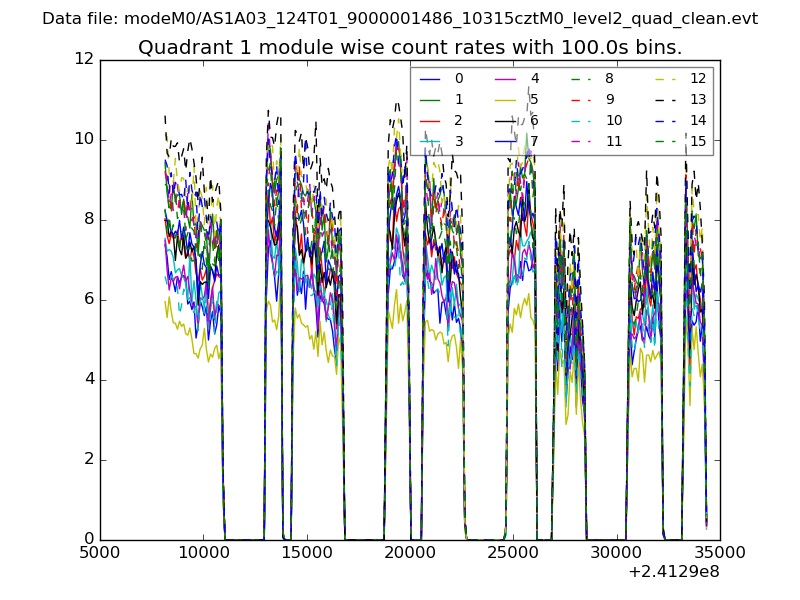
| Module-wise count rates for Quadrant A Data is divided into 100 sec bins |
 |
 |
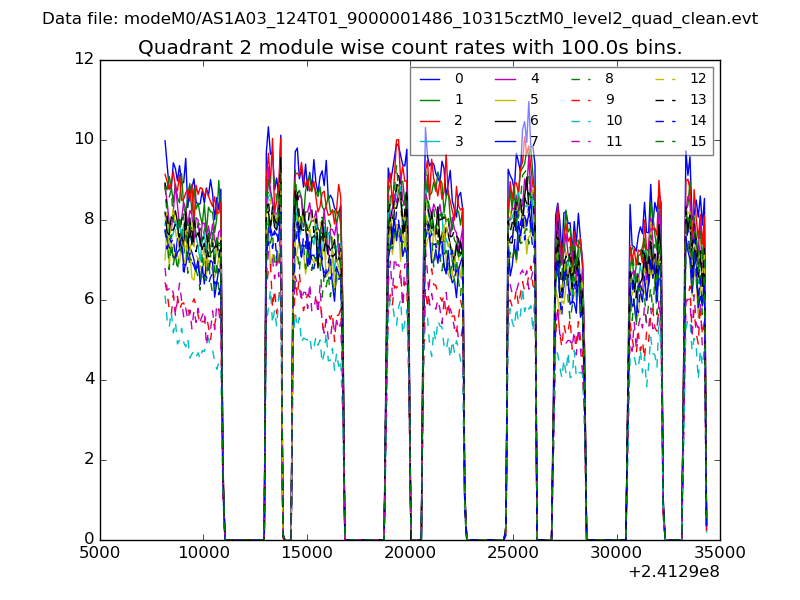
| Module-wise count rates for Quadrant B Data is divided into 100 sec bins |
 |
 |
| Module-wise count rates for Quadrant C Data is divided into 100 sec bins |
 |
 |
| Module-wise count rates for Quadrant D Data is divided into 100 sec bins |
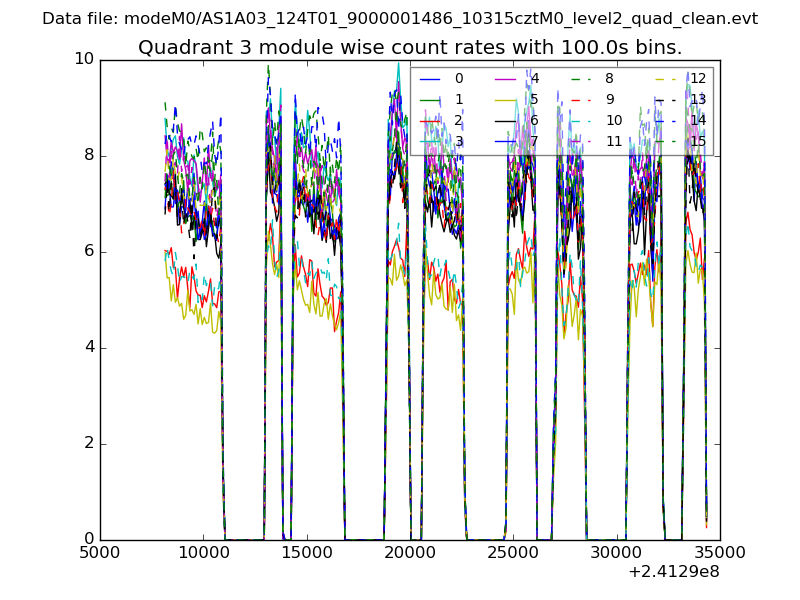 |
 |
| Parameter | Plot |
|---|---|
| CZT HV Monitor | 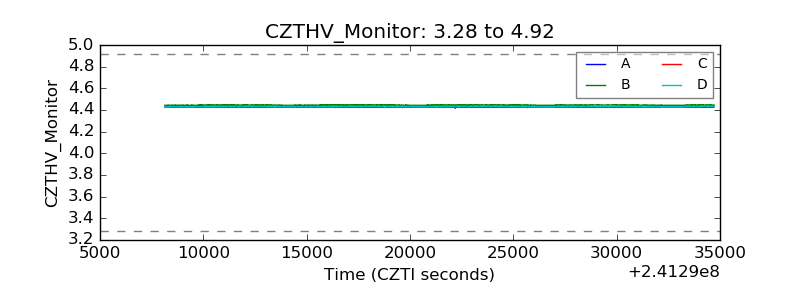 |
| D_VDD | 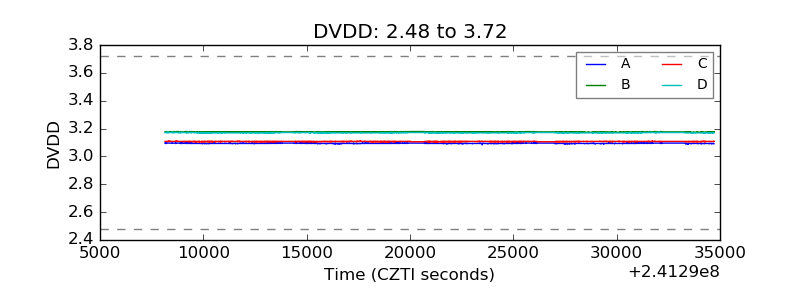 |
| Temperature 1 | 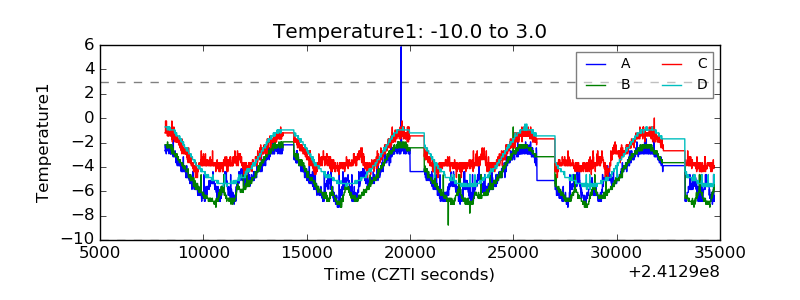 |
| Veto HV Monitor | 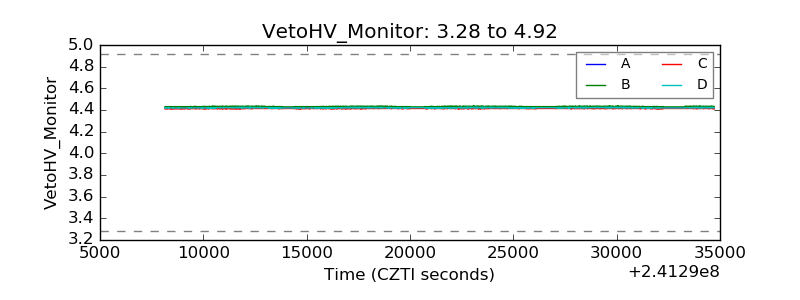 |
| Veto LLD | 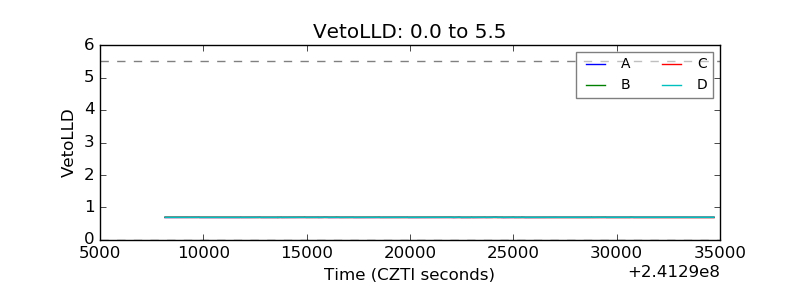 |
| Alpha Counter | 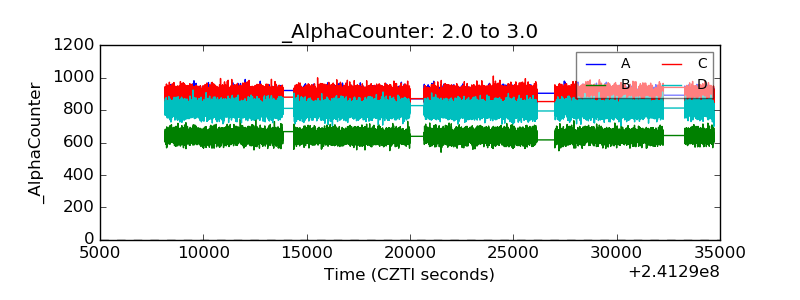 |
| _CPM_Rate | 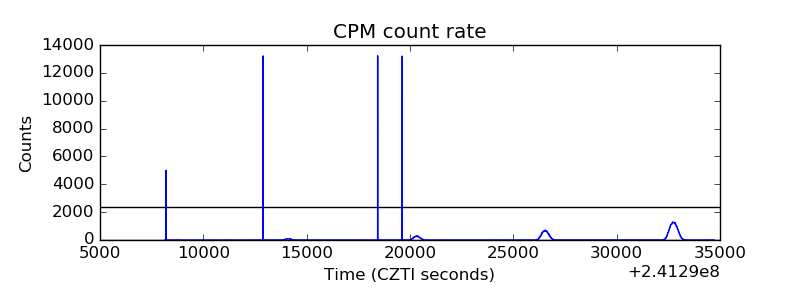 |
| CZT Counter | 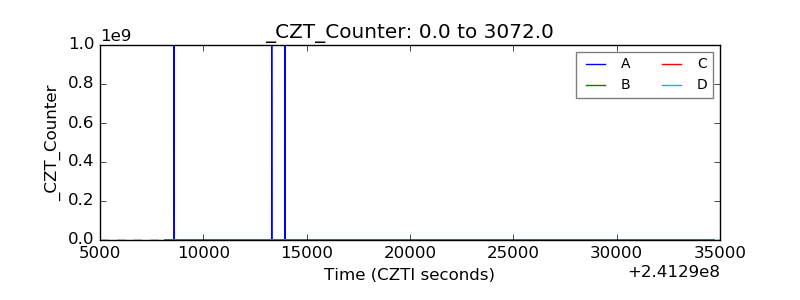 |
| +2.5 Volts monitor |  |
| +5 Volts monitor |  |
| _ROLL_ROT | 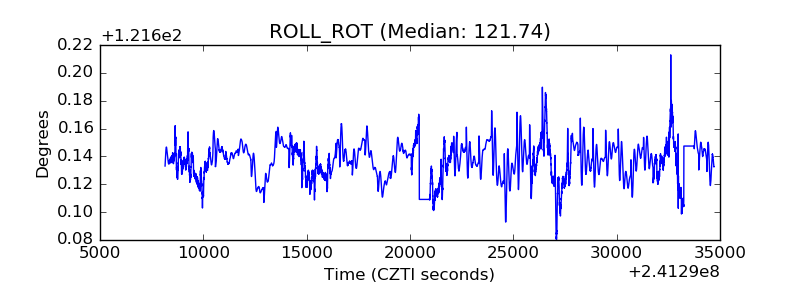 |
| _Roll_DEC | 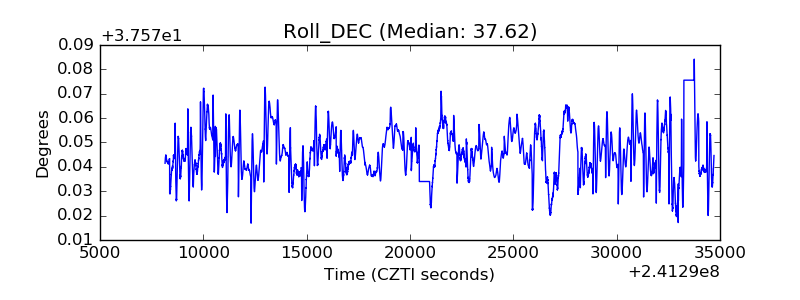 |
| _Roll_RA | 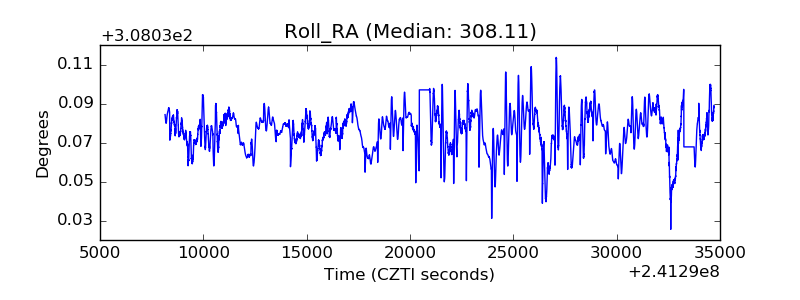 |
| Veto Counter | 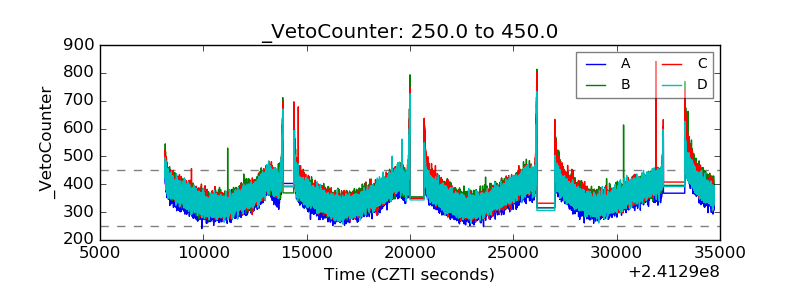 |