| Param | Original file | Final file |
|---|---|---|
| Filename | modeM0/AS1A03_124T01_9000001486_10317cztM0_level2.evt | modeM0/AS1A03_124T01_9000001486_10317cztM0_level2_quad_clean.evt |
| Size (bytes) | 463,363,200 | 84,277,440 |
| Size | 441.9 MB | 80.4 MB |
| Events in quadrant A | 3,214,427 | 532,236 |
| Events in quadrant B | 3,852,566 | 533,051 |
| Events in quadrant C | 3,038,081 | 523,941 |
| Events in quadrant D | 3,477,141 | 500,164 |
| Mode M0 | |||
|---|---|---|---|
| Quadrant | BADHDUFLAG | Total packets | Discarded packets |
| A | 0 | 13663 | 2 |
| B | 0 | 15813 | 3 |
| C | 0 | 13581 | 1 |
| D | 0 | 14375 | 1 |
| Mode M9 | |||
|---|---|---|---|
| Quadrant | BADHDUFLAG | Total packets | Discarded packets |
| A | 0 | 22 | 0 |
| B | 0 | 22 | 0 |
| C | 0 | 22 | 0 |
| D | 0 | 22 | 0 |
| Mode SS | |||
|---|---|---|---|
| Quadrant | BADHDUFLAG | Total packets | Discarded packets |
| A | 0 | 138 | 0 |
| B | 0 | 138 | 0 |
| C | 0 | 138 | 0 |
| D | 0 | 138 | 0 |
| Quadrant | Total seconds | Saturated seconds | Saturation percentage |
|---|---|---|---|
| A | 6630 | 22 | 0.331825% |
| B | 6629 | 185 | 2.790768% |
| C | 6630 | 16 | 0.241327% |
| D | 6630 | 23 | 0.346908% |
Noise dominated data is calculated using 1-second bins in cleaned event files. If a bin has >2000 counts, and if more than 50% of those come from <1% of pixels, then it is considered to be noise-dominated and hence unusable.
| Quadrant | # 1 sec bins | Bins with >0 counts | Bins with >2000 counts | High rate bins dominated by noise | Noise dominated (total time) | Noise dominated (detector-on time) | Marked lightcurve |
|---|---|---|---|---|---|---|---|
| A | 8820 | 6632 | 0 | 0 | 0.00% | 0.00% | 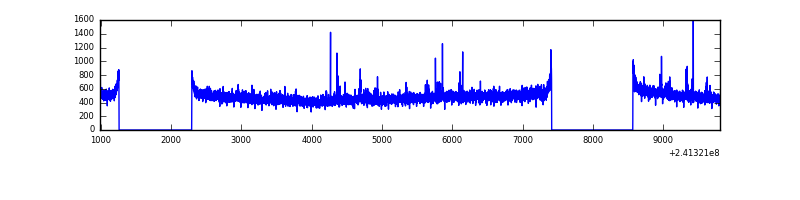 |
| B | 8820 | 6631 | 114 | 114 | 1.29% | 1.72% | 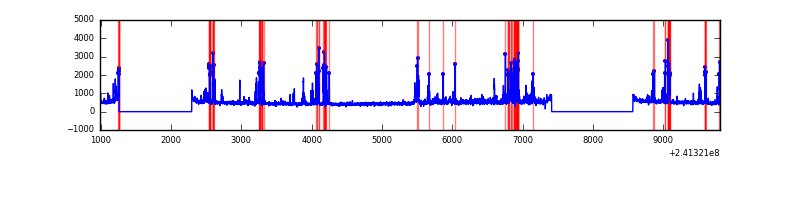 |
| C | 8820 | 6632 | 2 | 2 | 0.02% | 0.03% | 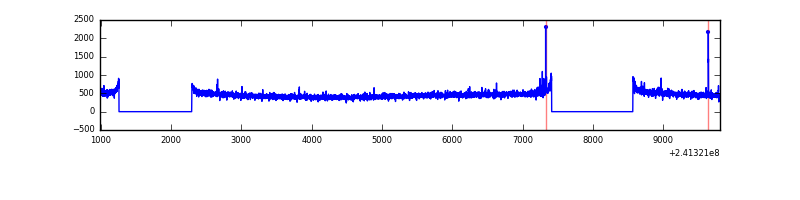 |
| D | 8820 | 6632 | 13 | 13 | 0.15% | 0.20% | 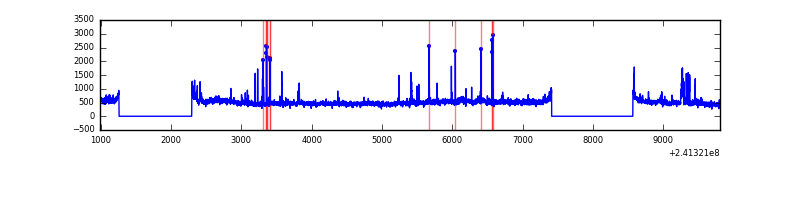 |
Top three noisy pixels from each quadrant. If the there are fewer than three noisy pixels in the level2.evt file, extra rows are filled as -1
| Pixel properties | Quadrant properties | ||||||
|---|---|---|---|---|---|---|---|
| Quadrant | DetID | PixID | Counts | Sigma | Mean | Median | Sigma |
| A | 8 | 15 | 93093 | 577.78 | 796 | 780 | 159.8 |
| A | 8 | 5 | 33576 | 205.27 | 796 | 780 | 159.8 |
| A | 3 | 1 | 14434 | 85.46 | 796 | 780 | 159.8 |
| B | 4 | 239 | 669928 | 4439.17 | 793 | 772 | 150.7 |
| B | 11 | 51 | 57450 | 376.0 | 793 | 772 | 150.7 |
| B | 0 | 214 | 26201 | 168.7 | 793 | 772 | 150.7 |
| C | 4 | 254 | 18462 | 98.6 | 772 | 776 | 179.4 |
| C | 12 | 4 | 5913 | 28.64 | 772 | 776 | 179.4 |
| C | 13 | 61 | 5900 | 28.57 | 772 | 776 | 179.4 |
| D | 8 | 195 | 322725 | 1758.23 | 764 | 744 | 183.1 |
| D | 1 | 52 | 81187 | 439.27 | 764 | 744 | 183.1 |
| D | 2 | 14 | 66871 | 361.1 | 764 | 744 | 183.1 |
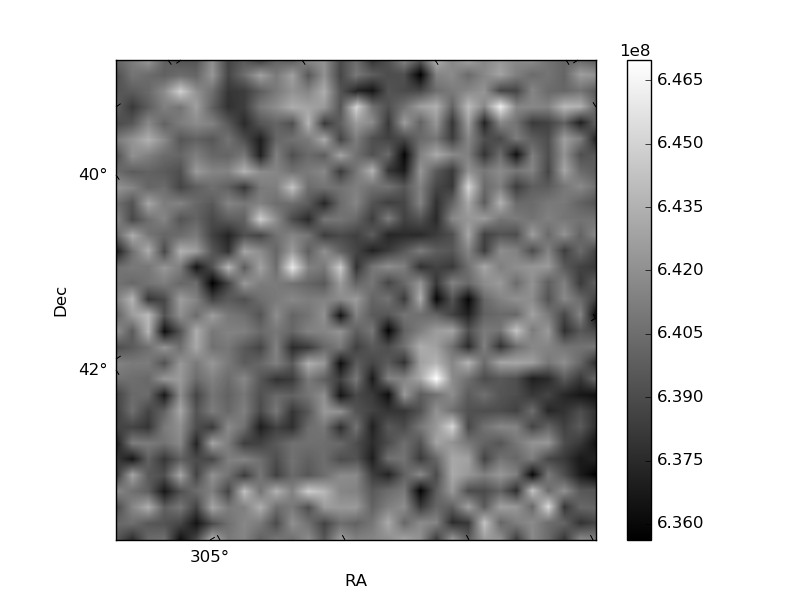
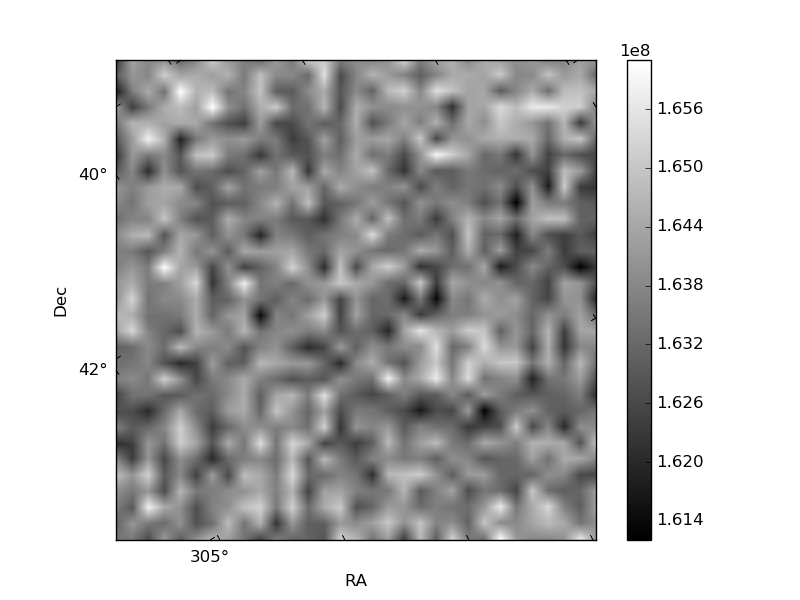
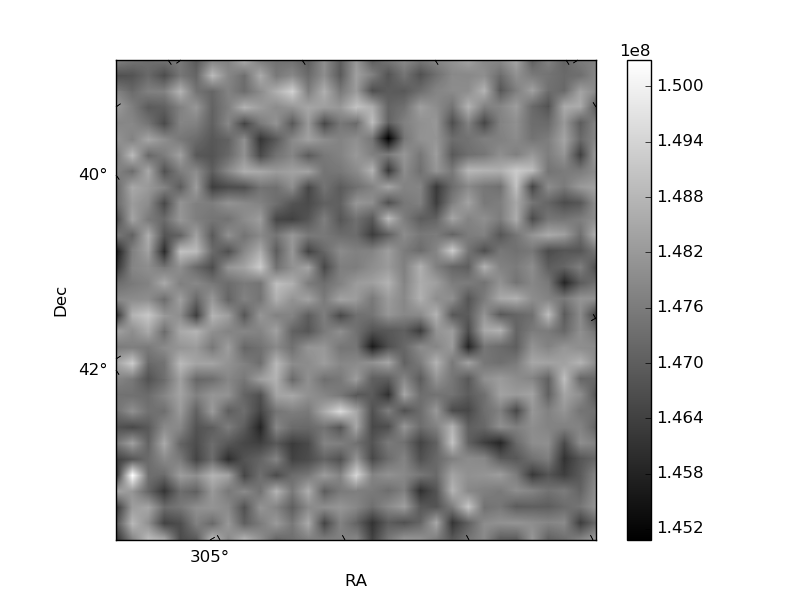
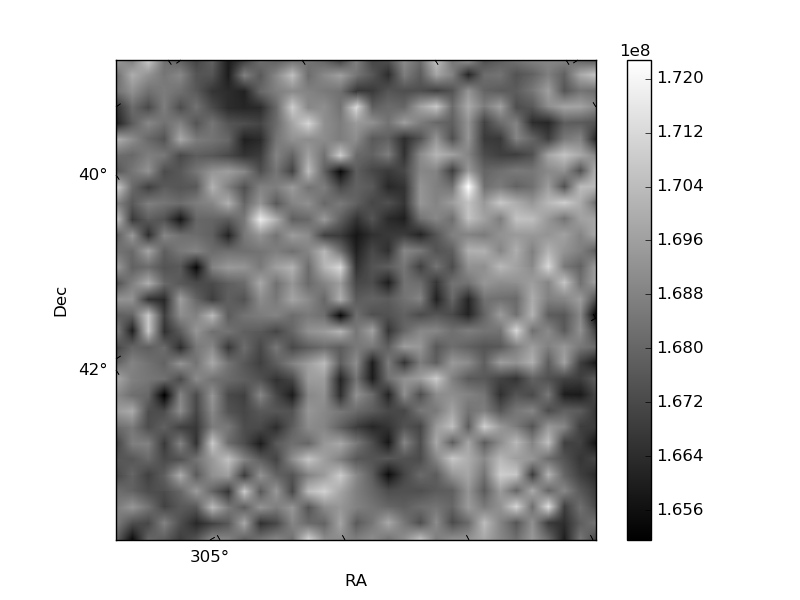
Histogram calculated using DETX and DETY for each event in the final _common_clean file
| Quadrant A | 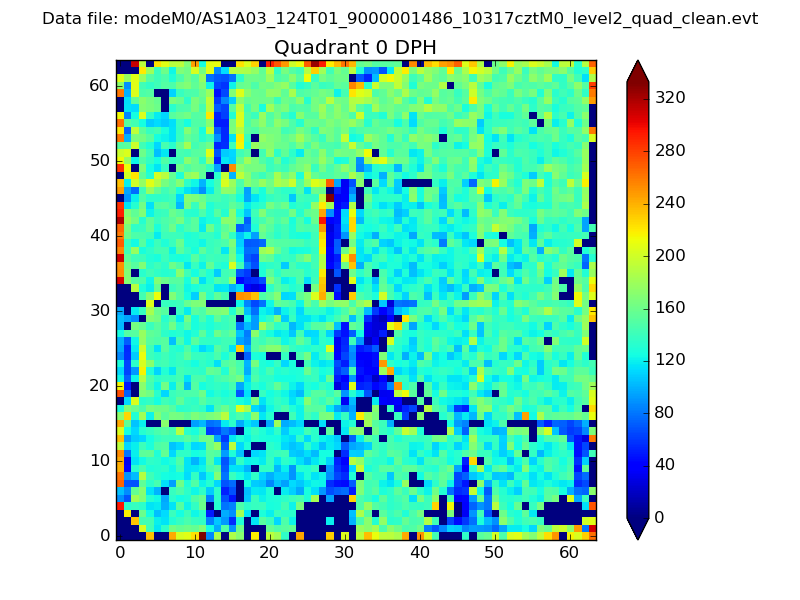 |
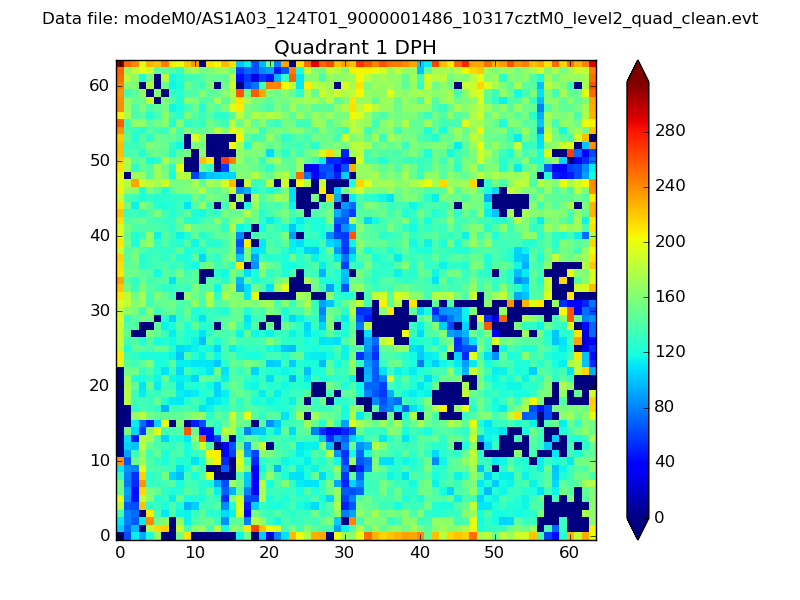 |
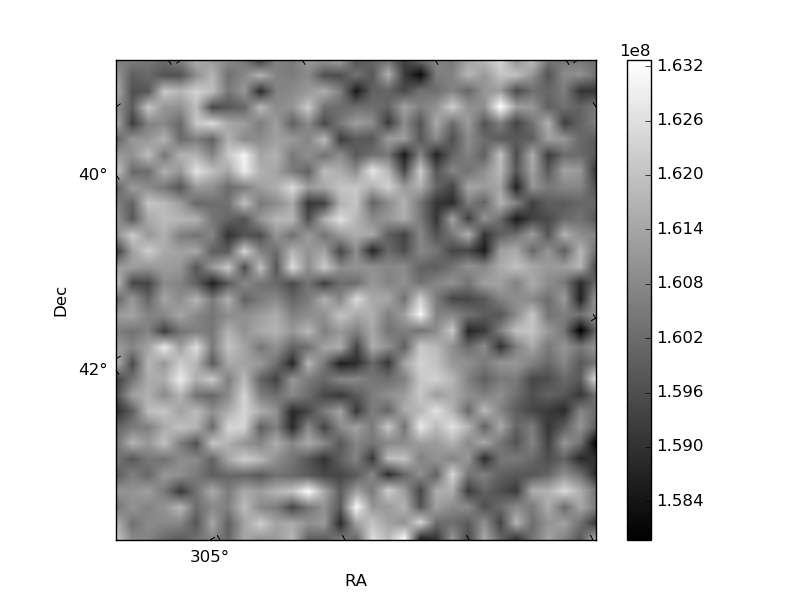
Quadrant B |
|---|---|---|---|
| Quadrant D | 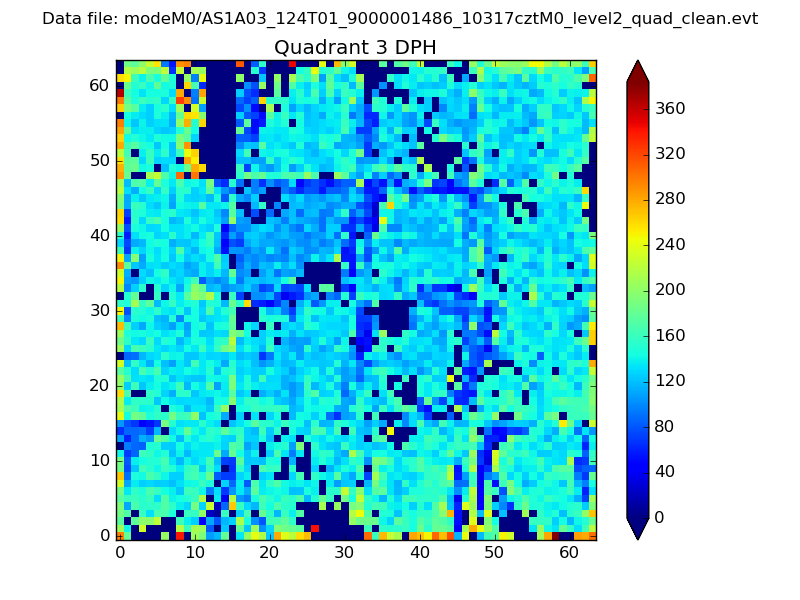 |
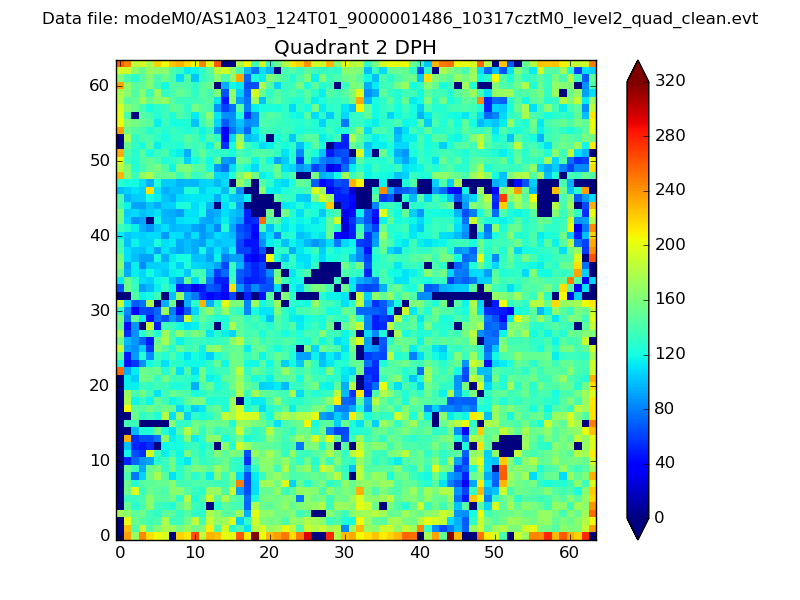 |
Quadrant C |
| Plot type | Count rate plots | Images |
|---|---|---|
| Comparison with Poisson distribution Blue bars denote a histogram of data divided into 1 sec bins. Red curve is a Poisson curve with rate = median count rate of data. |
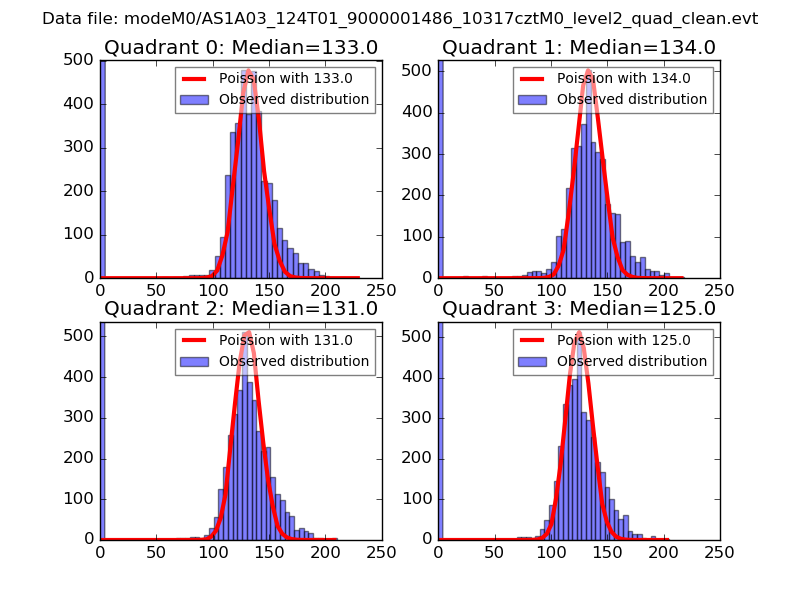 |
 |
| Quadrant-wise count rates Data is divided into 100 sec bins |
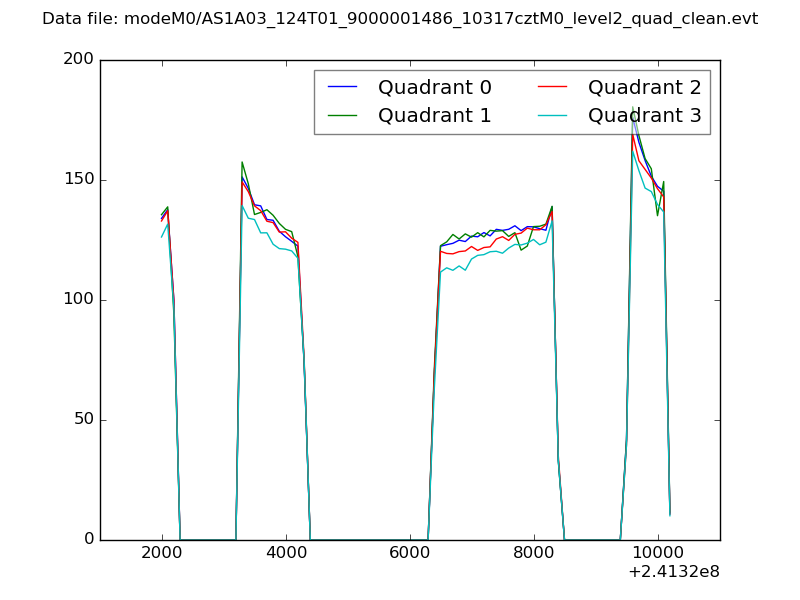 |
|
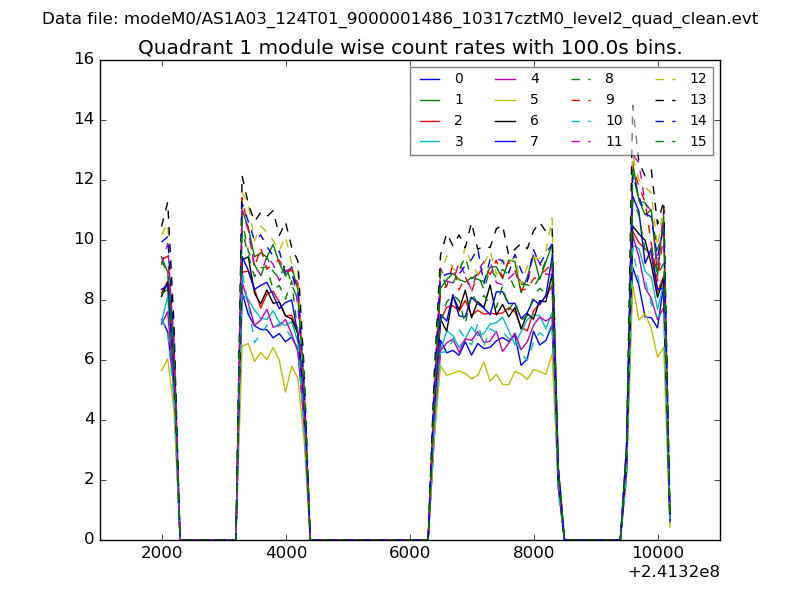
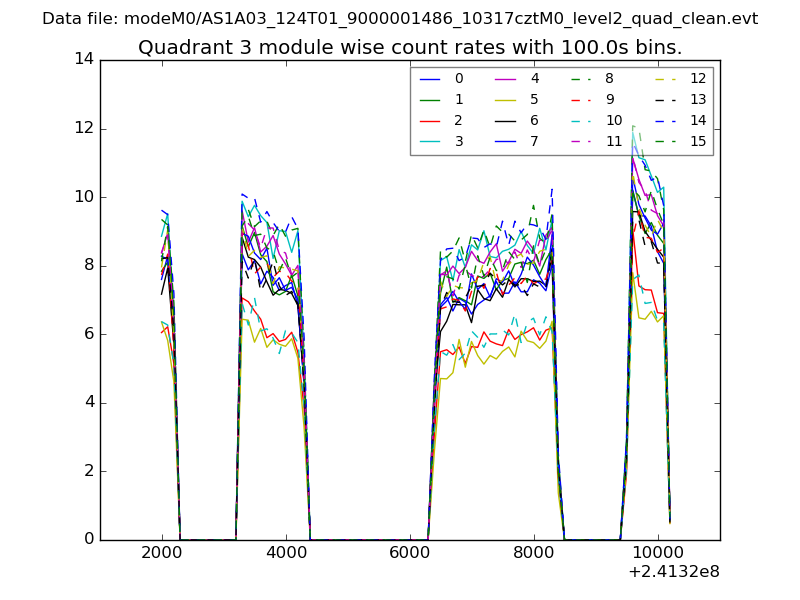
| Module-wise count rates for Quadrant A Data is divided into 100 sec bins |
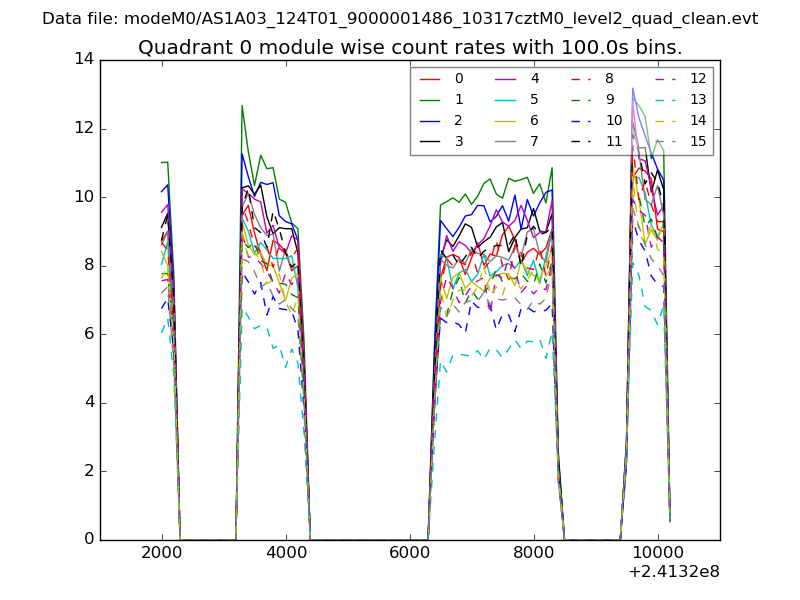 |
 |
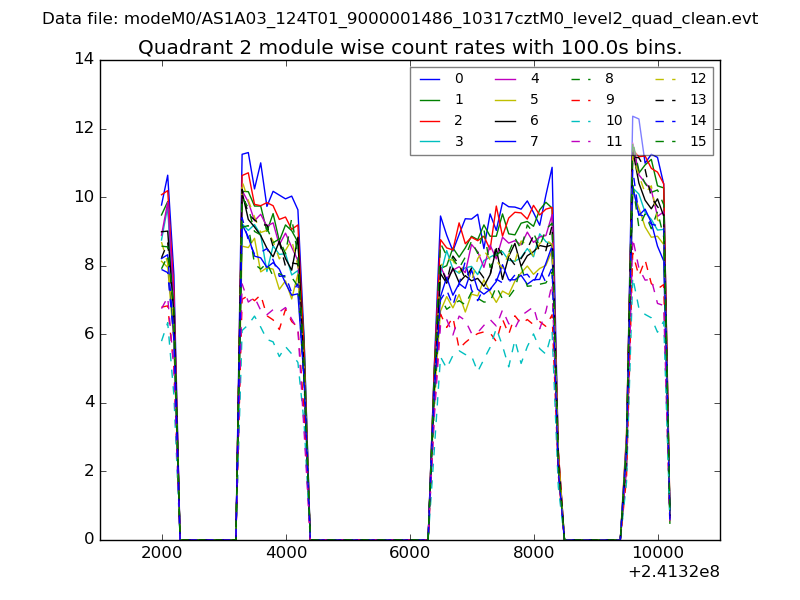
| Module-wise count rates for Quadrant B Data is divided into 100 sec bins |
 |
 |
| Module-wise count rates for Quadrant C Data is divided into 100 sec bins |
 |
 |
| Module-wise count rates for Quadrant D Data is divided into 100 sec bins |
 |
 |
| Parameter | Plot |
|---|---|
| CZT HV Monitor | 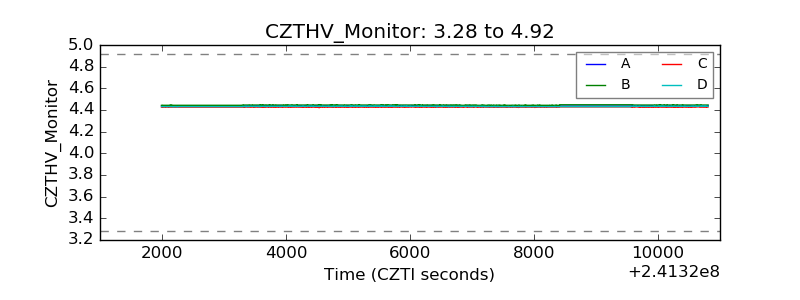 |
| D_VDD | 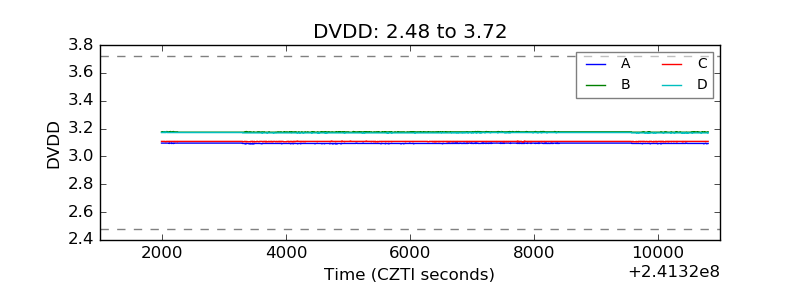 |
| Temperature 1 | 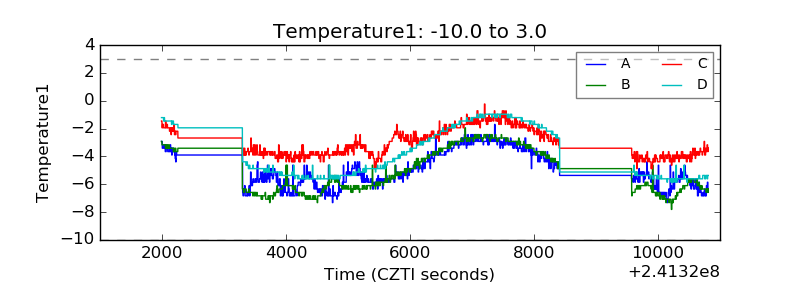 |
| Veto HV Monitor | 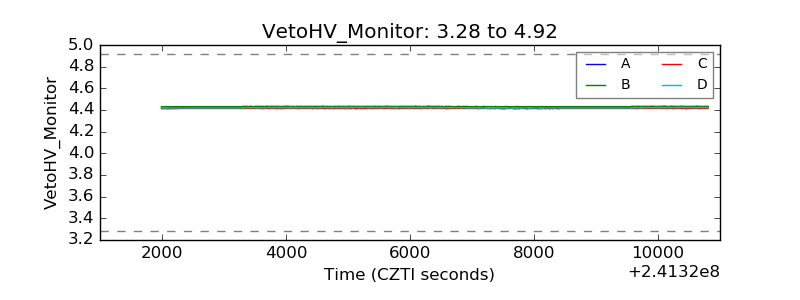 |
| Veto LLD | 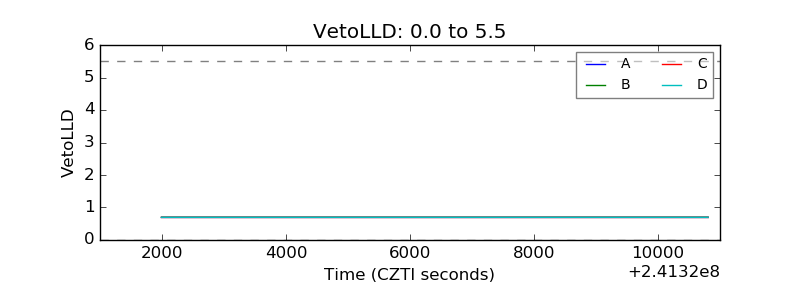 |
| Alpha Counter | 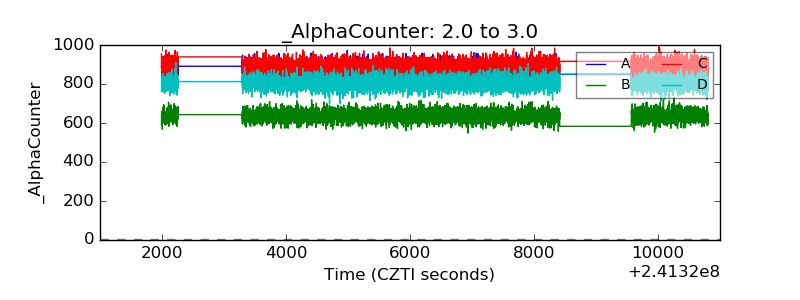 |
| _CPM_Rate | 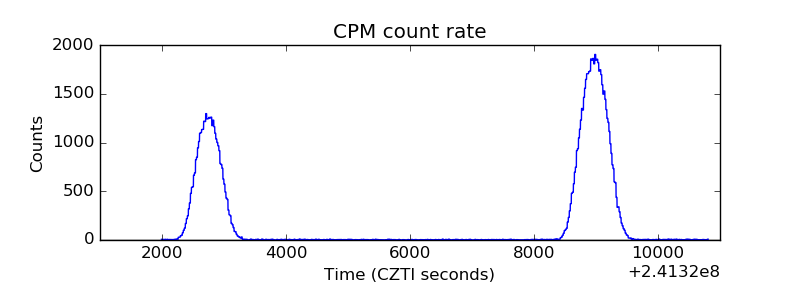 |
| CZT Counter | 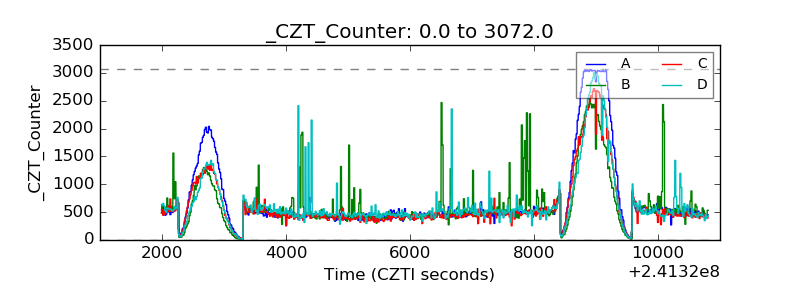 |
| +2.5 Volts monitor |  |
| +5 Volts monitor |  |
| _ROLL_ROT | 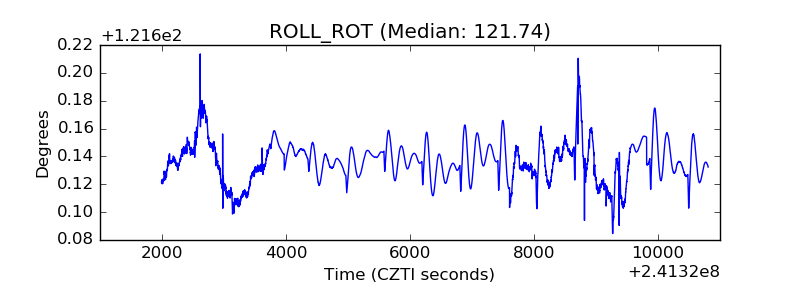 |
| _Roll_DEC | 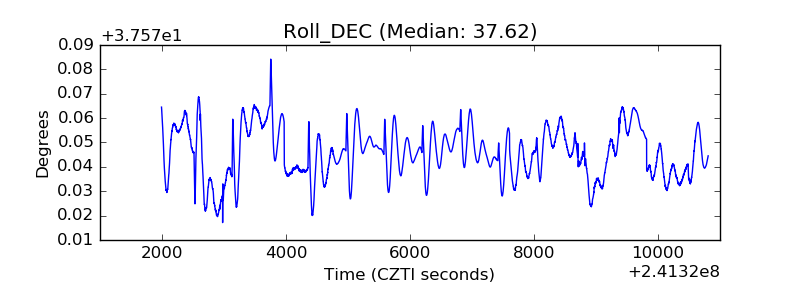 |
| _Roll_RA | 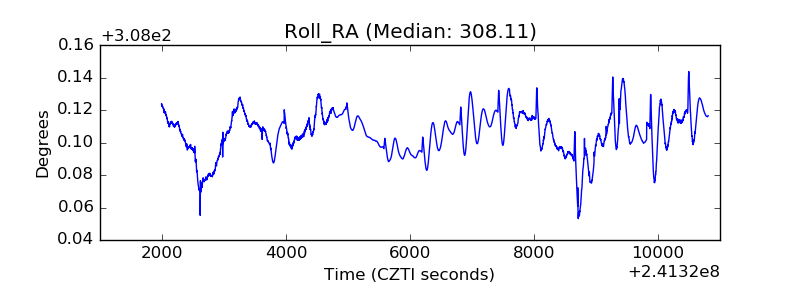 |
| Veto Counter | 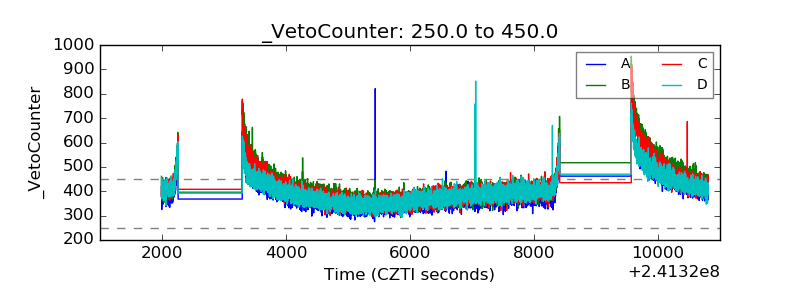 |