| Param | Original file | Final file |
|---|---|---|
| Filename | modeM0/AS1A03_124T01_9000001486_10318cztM0_level2.evt | modeM0/AS1A03_124T01_9000001486_10318cztM0_level2_quad_clean.evt |
| Size (bytes) | 442,376,640 | 70,781,760 |
| Size | 421.9 MB | 67.5 MB |
| Events in quadrant A | 3,181,888 | 438,391 |
| Events in quadrant B | 3,642,084 | 436,026 |
| Events in quadrant C | 2,944,801 | 425,328 |
| Events in quadrant D | 3,204,979 | 408,259 |
| Mode M0 | |||
|---|---|---|---|
| Quadrant | BADHDUFLAG | Total packets | Discarded packets |
| A | 0 | 13173 | 3 |
| B | 0 | 14740 | 2 |
| C | 0 | 12791 | 4 |
| D | 0 | 13448 | 2 |
| Mode M9 | |||
|---|---|---|---|
| Quadrant | BADHDUFLAG | Total packets | Discarded packets |
| A | 0 | 17 | 0 |
| B | 0 | 17 | 0 |
| C | 0 | 17 | 0 |
| D | 0 | 18 | 0 |
| Mode SS | |||
|---|---|---|---|
| Quadrant | BADHDUFLAG | Total packets | Discarded packets |
| A | 0 | 126 | 0 |
| B | 0 | 126 | 0 |
| C | 0 | 126 | 0 |
| D | 0 | 126 | 0 |
| Quadrant | Total seconds | Saturated seconds | Saturation percentage |
|---|---|---|---|
| A | 6236 | 44 | 0.705581% |
| B | 6236 | 189 | 3.030789% |
| C | 6235 | 35 | 0.561347% |
| D | 6236 | 41 | 0.657473% |
Noise dominated data is calculated using 1-second bins in cleaned event files. If a bin has >2000 counts, and if more than 50% of those come from <1% of pixels, then it is considered to be noise-dominated and hence unusable.
| Quadrant | # 1 sec bins | Bins with >0 counts | Bins with >2000 counts | High rate bins dominated by noise | Noise dominated (total time) | Noise dominated (detector-on time) | Marked lightcurve |
|---|---|---|---|---|---|---|---|
| A | 7506 | 6236 | 2 | 2 | 0.03% | 0.03% | 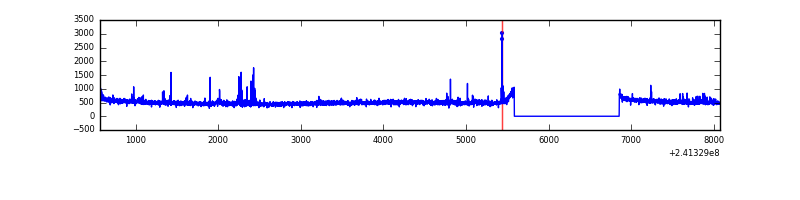 |
| B | 7506 | 6236 | 92 | 92 | 1.23% | 1.48% | 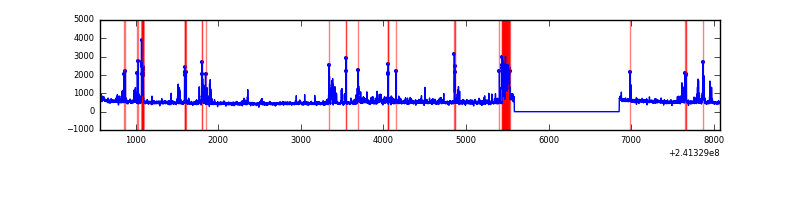 |
| C | 7506 | 6236 | 1 | 1 | 0.01% | 0.02% | 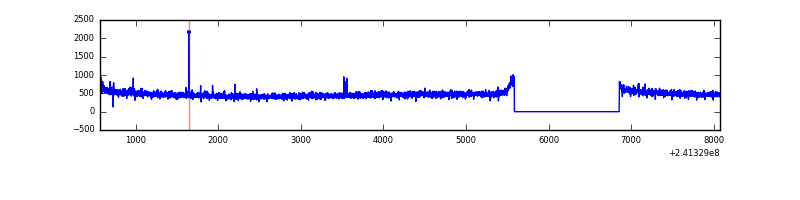 |
| D | 7506 | 6236 | 7 | 7 | 0.09% | 0.11% | 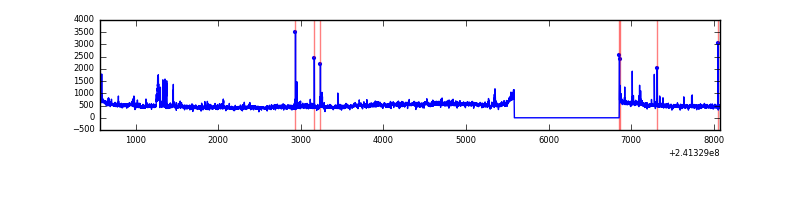 |
Top three noisy pixels from each quadrant. If the there are fewer than three noisy pixels in the level2.evt file, extra rows are filled as -1
| Pixel properties | Quadrant properties | ||||||
|---|---|---|---|---|---|---|---|
| Quadrant | DetID | PixID | Counts | Sigma | Mean | Median | Sigma |
| A | 8 | 15 | 76021 | 480.17 | 782 | 770 | 156.7 |
| A | 8 | 5 | 66153 | 417.21 | 782 | 770 | 156.7 |
| A | 3 | 1 | 25416 | 157.26 | 782 | 770 | 156.7 |
| B | 4 | 239 | 501469 | 3454.27 | 778 | 763 | 145.0 |
| B | 11 | 51 | 55764 | 379.44 | 778 | 763 | 145.0 |
| B | 3 | 208 | 25998 | 174.09 | 778 | 763 | 145.0 |
| C | 4 | 254 | 7643 | 39.72 | 750 | 754 | 173.4 |
| C | 13 | 61 | 5735 | 28.72 | 750 | 754 | 173.4 |
| C | 14 | 234 | 5597 | 27.92 | 750 | 754 | 173.4 |
| D | 8 | 195 | 214723 | 1209.43 | 743 | 724 | 176.9 |
| D | 2 | 14 | 75846 | 424.56 | 743 | 724 | 176.9 |
| D | 2 | 16 | 25835 | 141.92 | 743 | 724 | 176.9 |
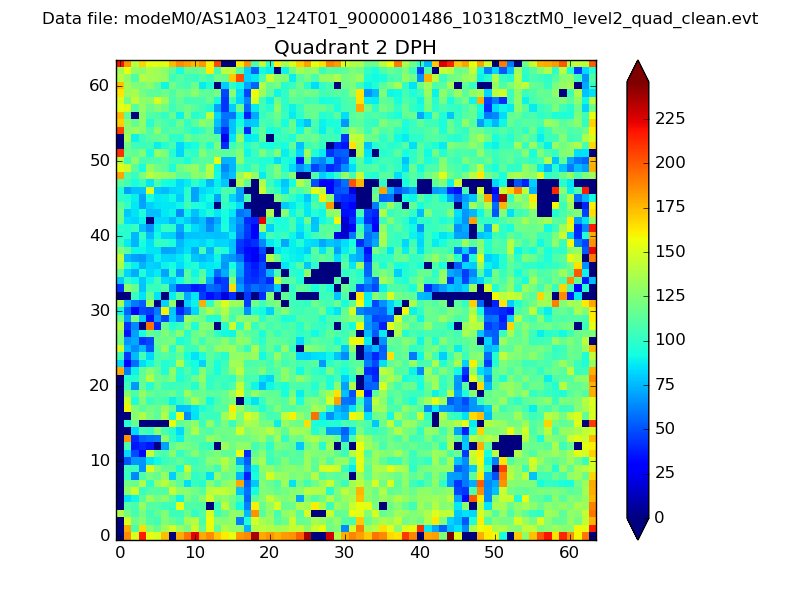
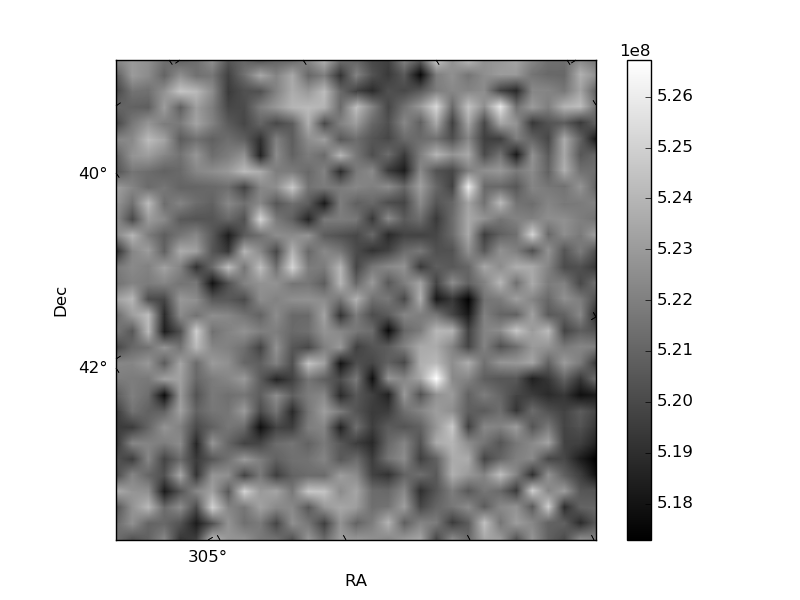
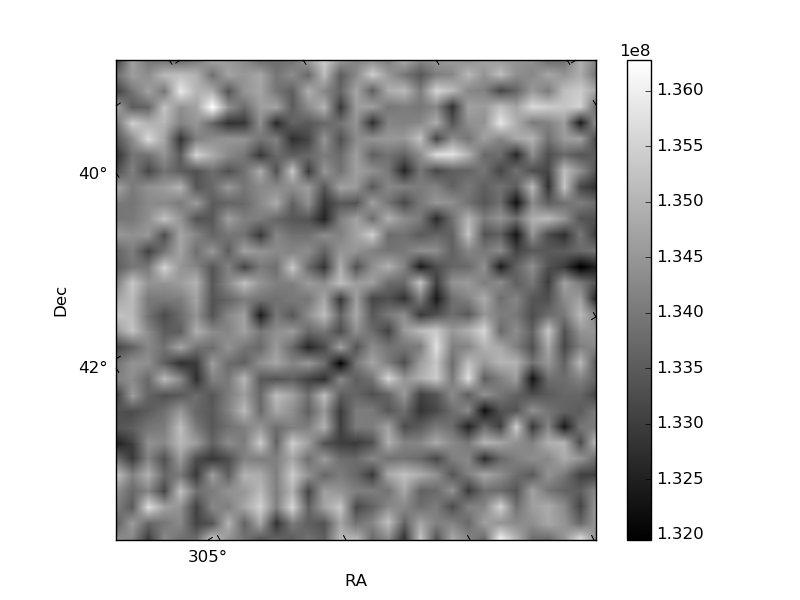
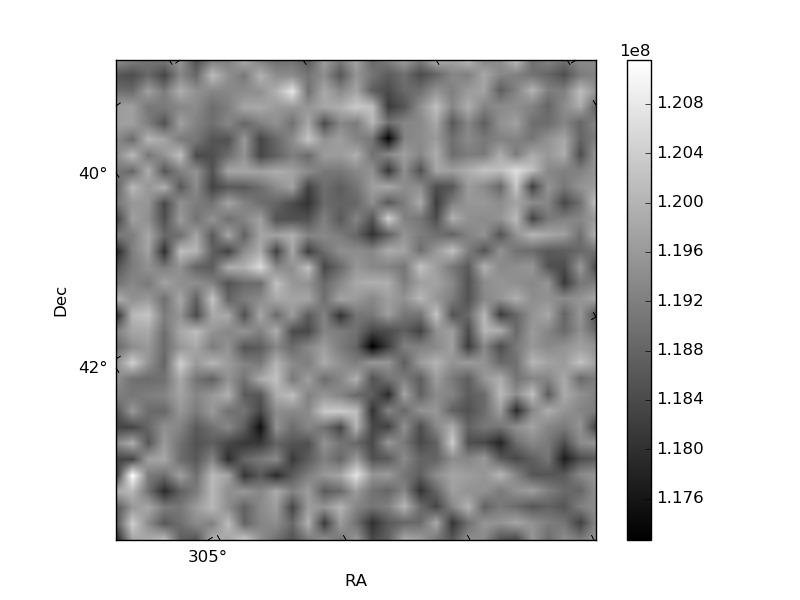
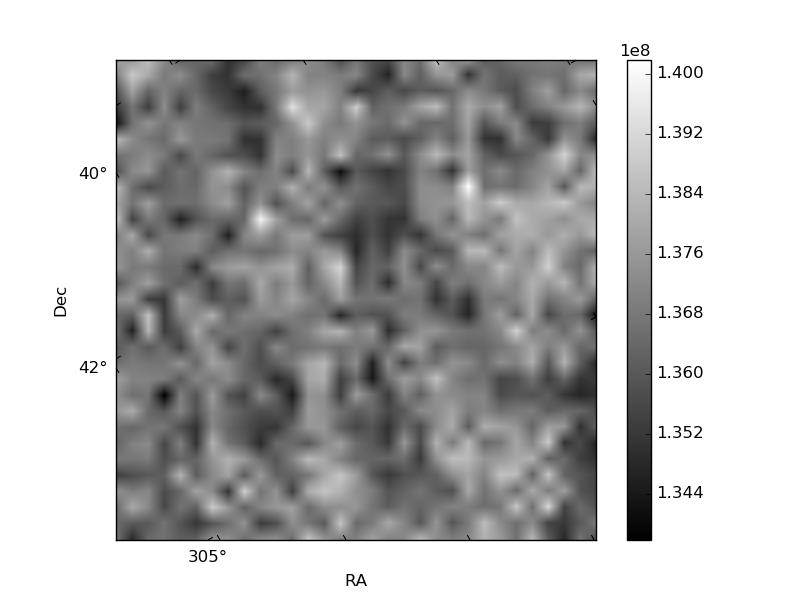
Histogram calculated using DETX and DETY for each event in the final _common_clean file
| Quadrant A | 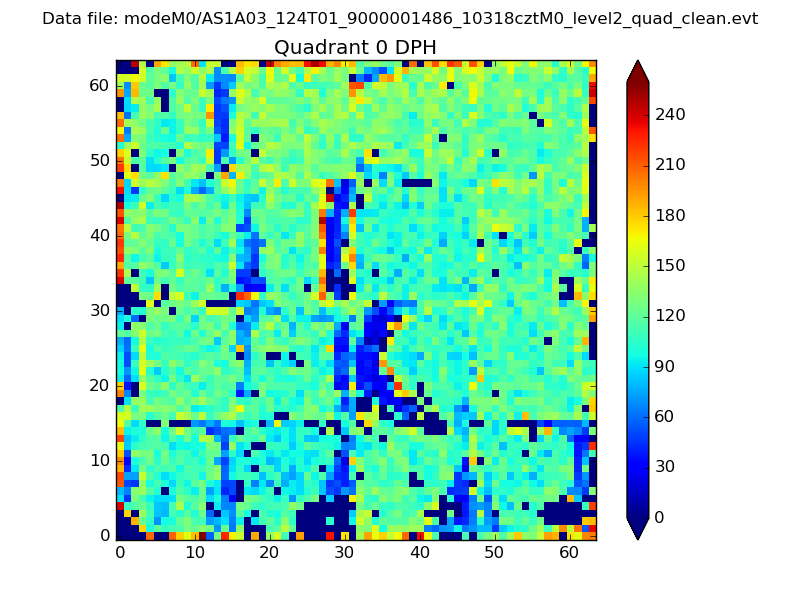 |
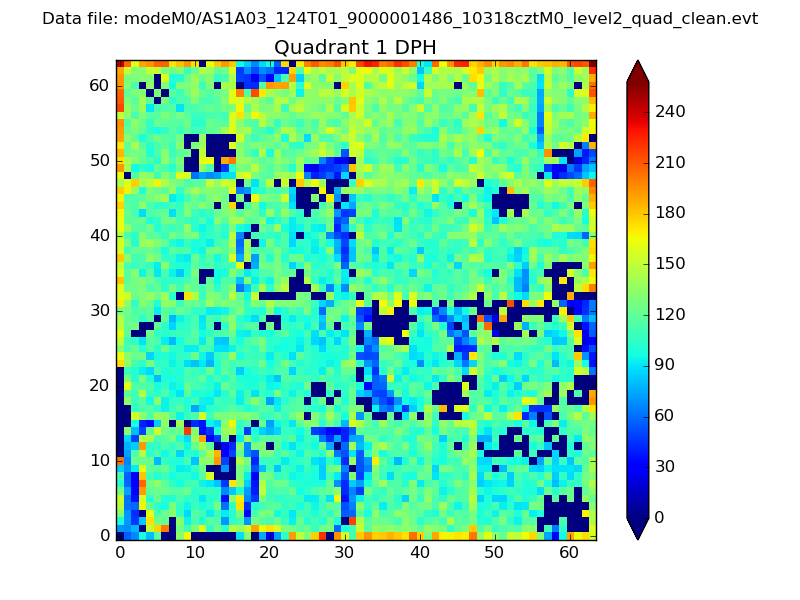 |
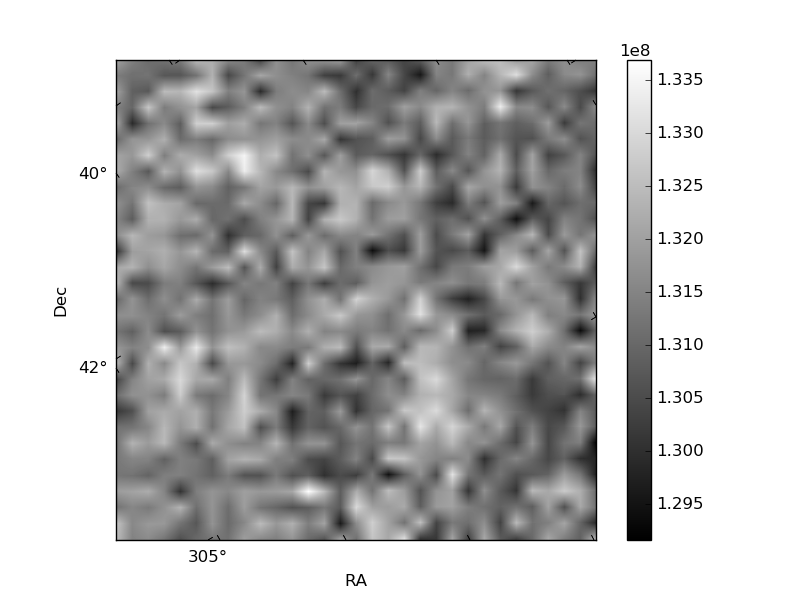
Quadrant B |
|---|---|---|---|
| Quadrant D | 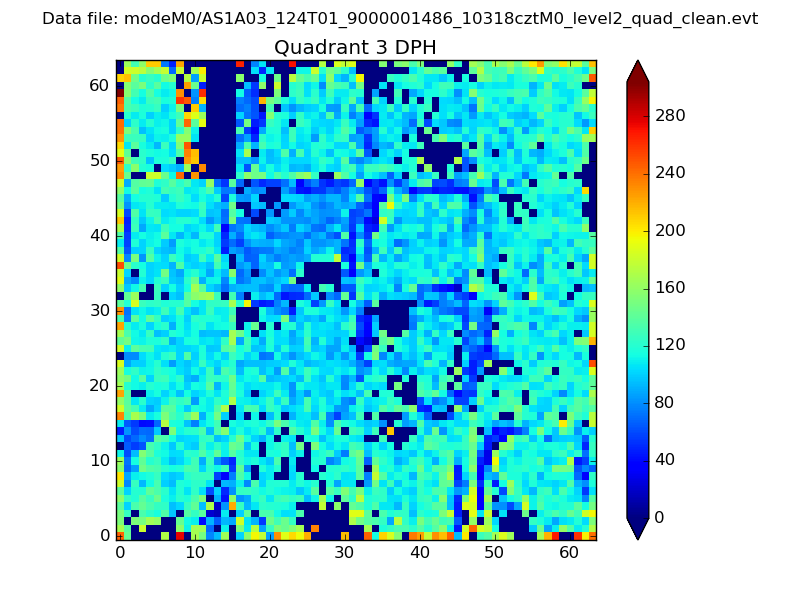 |
 |
Quadrant C |
| Plot type | Count rate plots | Images |
|---|---|---|
| Comparison with Poisson distribution Blue bars denote a histogram of data divided into 1 sec bins. Red curve is a Poisson curve with rate = median count rate of data. |
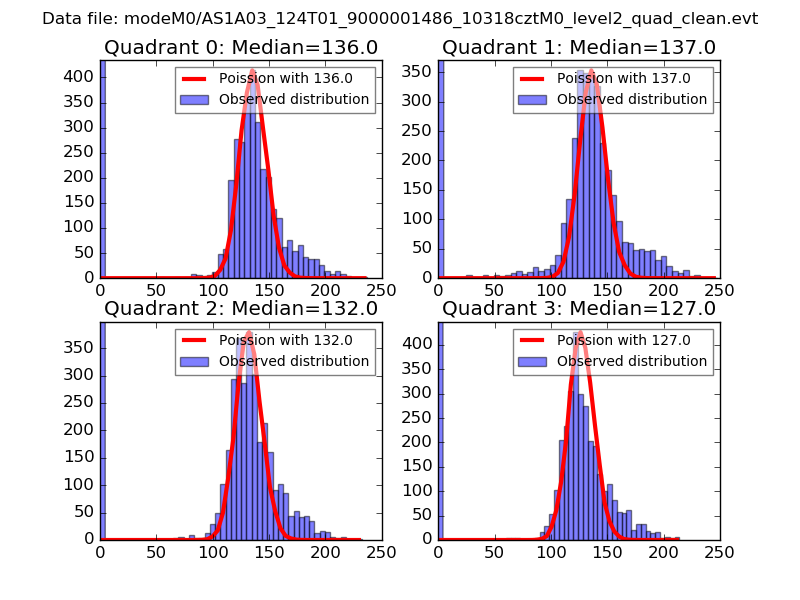 |
 |
| Quadrant-wise count rates Data is divided into 100 sec bins |
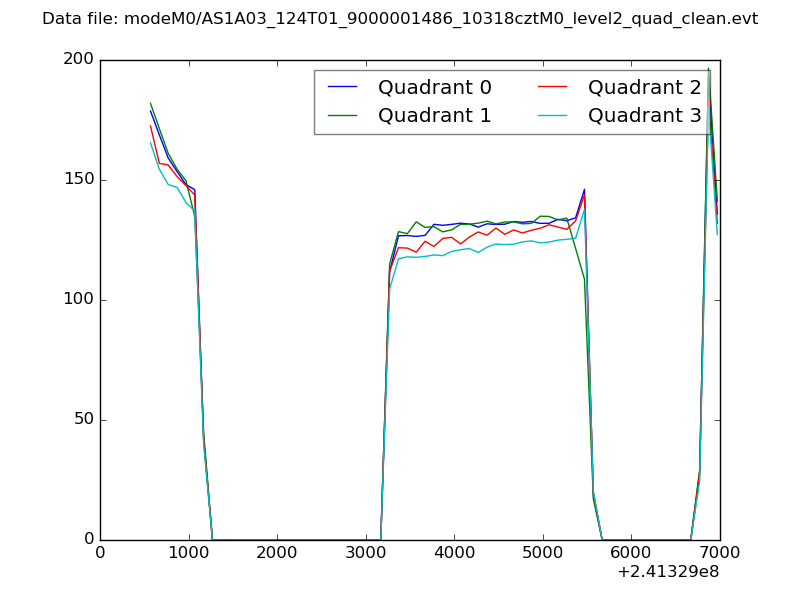 |
|
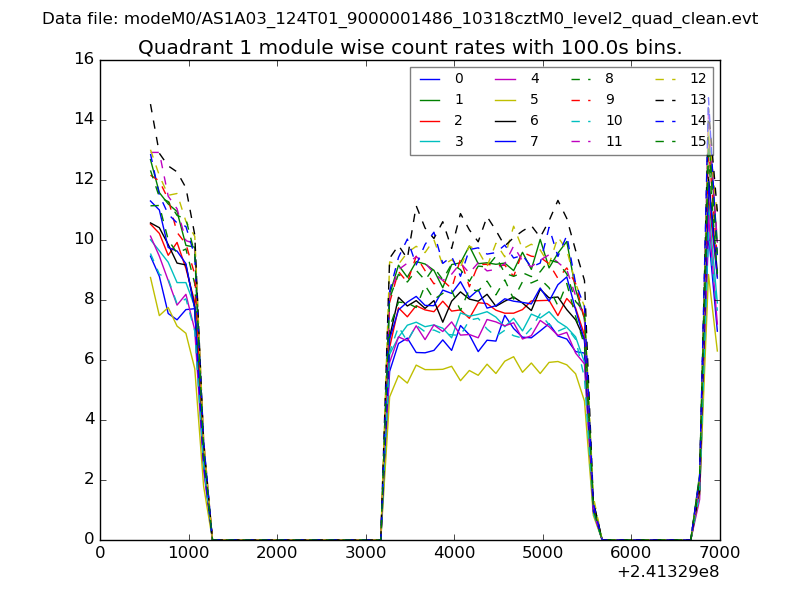
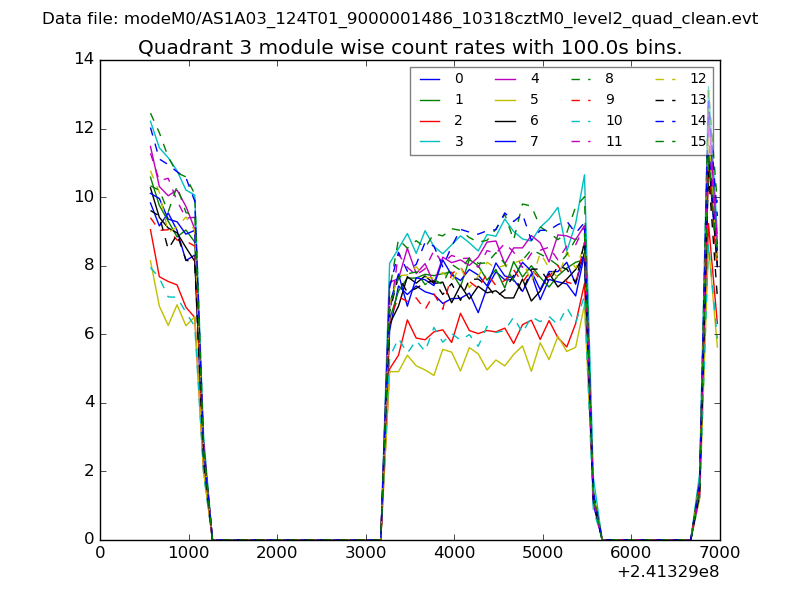
| Module-wise count rates for Quadrant A Data is divided into 100 sec bins |
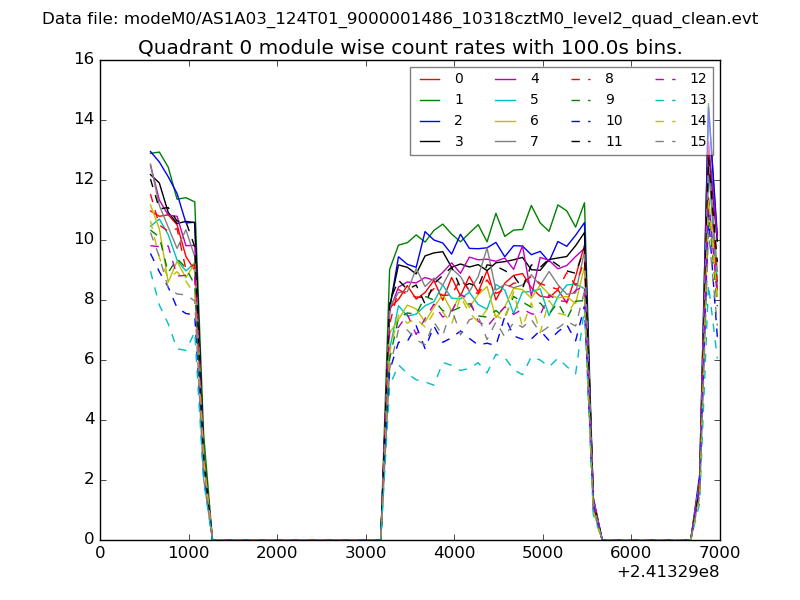 |
 |
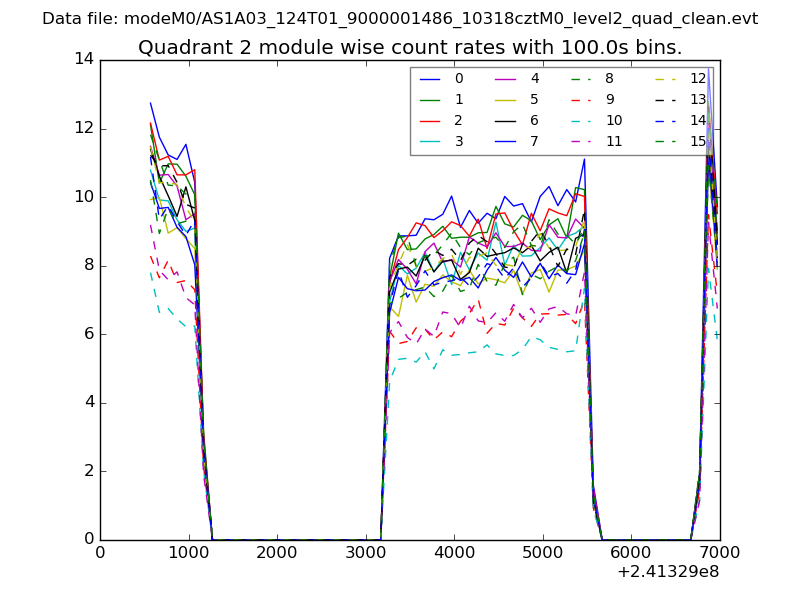
| Module-wise count rates for Quadrant B Data is divided into 100 sec bins |
 |
 |
| Module-wise count rates for Quadrant C Data is divided into 100 sec bins |
 |
 |
| Module-wise count rates for Quadrant D Data is divided into 100 sec bins |
 |
 |
| Parameter | Plot |
|---|---|
| CZT HV Monitor | 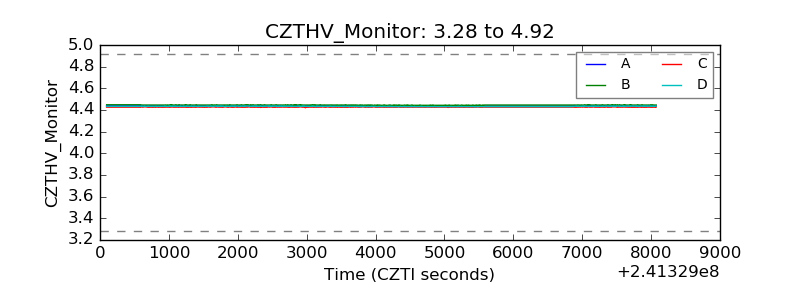 |
| D_VDD | 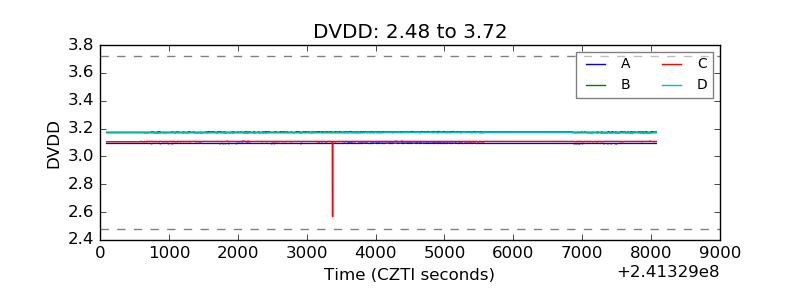 |
| Temperature 1 | 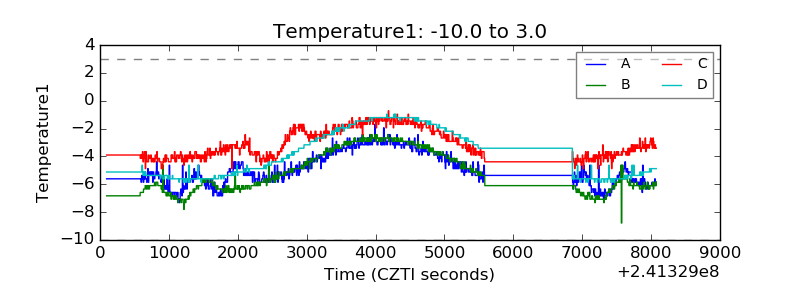 |
| Veto HV Monitor | 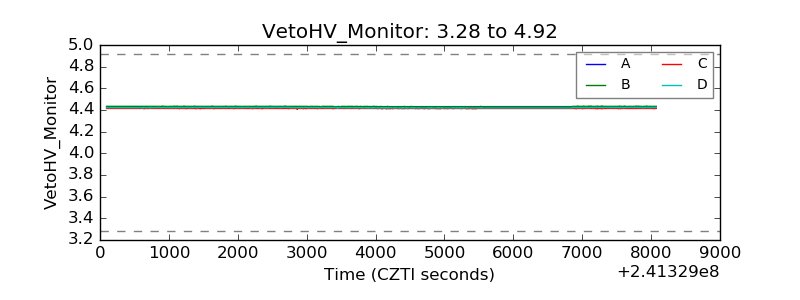 |
| Veto LLD | 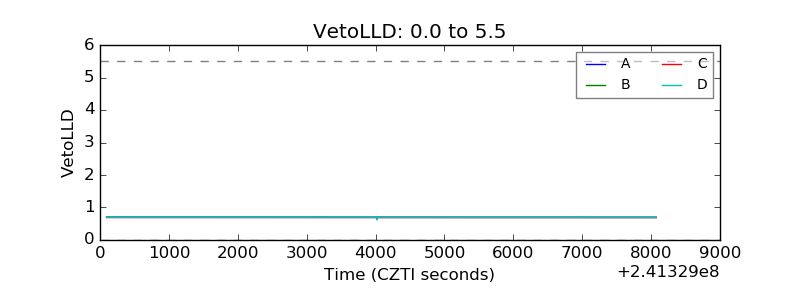 |
| Alpha Counter | 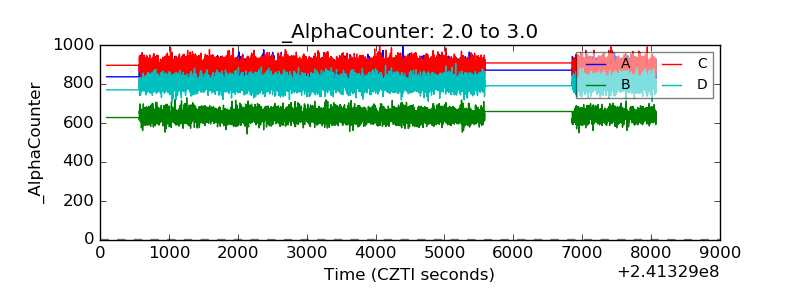 |
| _CPM_Rate | 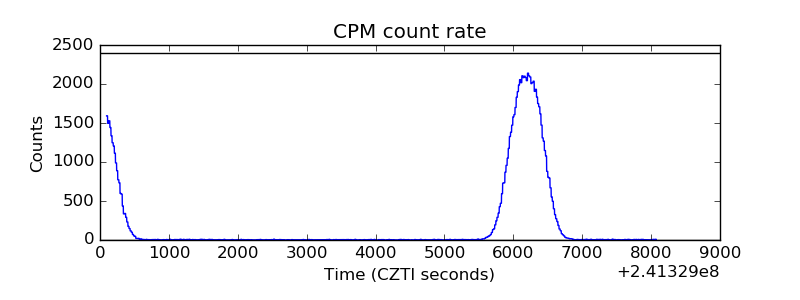 |
| CZT Counter |  |
| +2.5 Volts monitor |  |
| +5 Volts monitor |  |
| _ROLL_ROT | 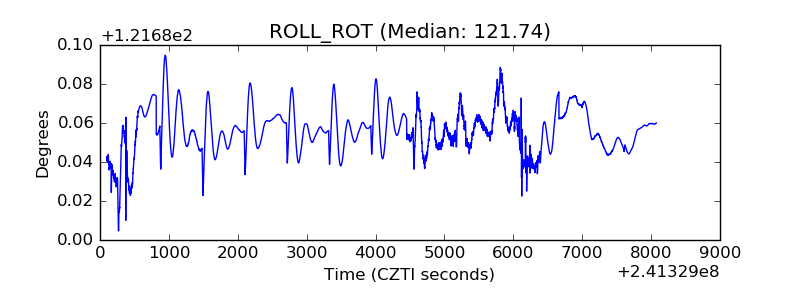 |
| _Roll_DEC | 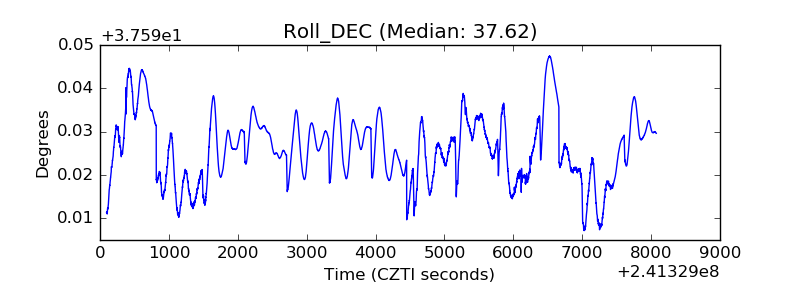 |
| _Roll_RA | 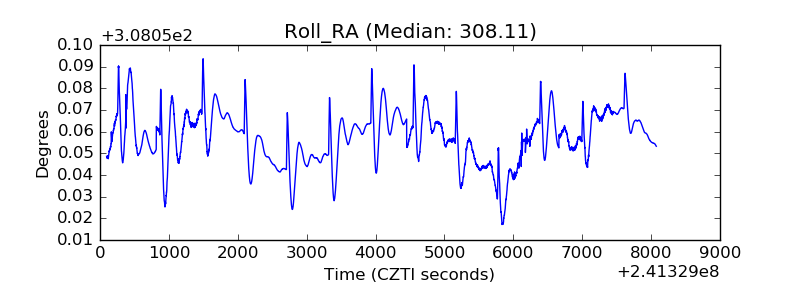 |
| Veto Counter | 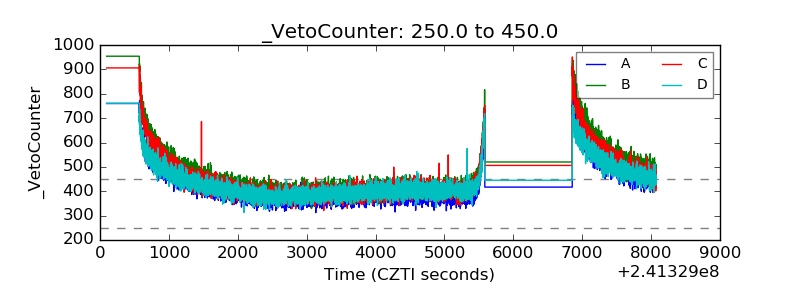 |